SPY Daily Chart – Rising Wedge at Resistance, RSI Near OverboughSPY continues to push higher, but today's candle reinforces a cautious tone as we approach a key inflection point.
The chart is currently forming a rising wedge pattern — historically a bearish structure that often precedes downside breaks, especially when forming after a strong upside move. Price is hugging the upper boundary of the wedge, with multiple failed breakout attempts near 626.87, which is acting as strong resistance.
The RSI sits at 68.59, just below the 70 overbought threshold. While this confirms strong bullish momentum, it also signals that the move may be getting stretched. A rejection here or a lower high on RSI while price continues higher could form a bearish divergence, a classic early reversal signal.
Volume remains moderate (~51.85M), and the candles have tightened — suggesting indecision. The rising wedge’s lower trendline and the short-term moving average (likely the 8 or 10 EMA) are immediate support. A break below these levels would shift the bias more clearly to the downside.
Key levels to watch:
Resistance: 626.87 (wedge top)
Support: rising wedge lower boundary and EMA (around 620–622)
RSI: break below 65 or a confirmed divergence would increase bearish risk
If the wedge breaks down with a drop in RSI and a flip in momentum indicators (such as Parabolic SAR), it may open the door for a pullback toward previous support zones near 603 or even 592.63.
No confirmation yet, but the risk-reward here starts to shift away from chasing longs. Caution is warranted.
S27 trade ideas

Nightly $SPY / $SPX Scenarios for July 15, 2025🔮 Nightly AMEX:SPY / SP:SPX Scenarios for July 15, 2025 🔮
🌍 Market-Moving News 🌍
📦 Dow Futures Dip on New Tariff Announcements
President Trump announced new 30% tariffs on EU and Mexico, with additional duties on Japan, South Korea, Malaysia, Kazakhstan, South Africa, Laos, and Myanmar starting August 1. Dow, S&P, and Nasdaq futures each slipped ~0.3% as markets assess inflation risk ahead of key CPI data this week
📈 Tech & AI Stocks Lead Despite Tariffs
Stocks like Circle (+9.3%), CoreWeave (+5.2%), Palantir (+5%), Roblox (+5.8%), and Shopify (+4.1%) surged, showcasing sector resilience amid broader tariff fears
⚠️ Deutsche Bank Warns of Summer Volatility
With thin market liquidity and rising geopolitical tension (tariff deadline Aug 1), Deutsche Bank flags summer as a period prone to sudden corrections
📊 Key Data Releases & Events 📊
📅 Tuesday, July 15:
8:30 AM ET – CPI (June)
Core CPI is projected at +0.3% MoM (2.7% YoY) and headline CPI +0.3% MoM—signs tariff effects may be feeding into prices
8:30 AM ET – Core CPI (June)
Expected to come in around 3.0% YoY.
8:30 AM ET – Empire State Manufacturing Survey (July)
Forecast: –7.8 (less negative than June’s –16.0) — a modest sign of stabilizing factory conditions
Fed Speakers Throughout the Day
Watch for commentary from Fed officials (Michael Barr, Barkin, Collins, Logan) for fresh insights on inflation and monetary policy
⚠️ Market Interpretation:
Inflation Watch: A hotter-than-expected CPI could delay anticipated rate cuts and lift yields. A pick-up in core CPI above 3% would be a red flag.
Growth Signals: A less-negative Empire State reading may suggest improving industrial momentum but still signals contraction.
Political Risk: Tariff escalation could shift investor appetite, even if markets right now are focusing on broader macro narratives.
Volatility Setup: The combination of thin liquidity, tariff uncertainty, and critical data makes for a potentially choppy week.
📌 #trading #stockmarket #economy #inflation #tariffs #Fed #CPI #manufacturing #technicalanalysis

SPY: Aiming 626 today Slowly./ Let's observe what this market will give us. If there is a setup, we take the trade.

Weekly $SPY / $SPX Scenarios for July 14–18, 2025🔮 Weekly AMEX:SPY / SP:SPX Scenarios for July 14–18, 2025 🔮
🌍 Market-Moving News 🌍
⚖️ Powell Faces ‘Epic’ Trade‑Inflation Dilemma
Former Fed economists warn Chair Powell is navigating nearly unprecedented terrain: tariffs are pushing up prices even as the labor market cools. Striking a balance between inflation control and growth support remains a formidable challenge
📊 Tariff‑Driven Inflation May Peak This Week
June’s CPI is expected to show a 0.3% month-on-month increase, potentially lifting core inflation to ~2.7%—its highest level in 18 months. These data will heavily influence the Fed’s decision-making process
🏦 Big Bank Earnings Kick Off
Earnings season begins with JPMorgan ( NYSE:JPM ), Goldman Sachs ( NYSE:GS ), Wells Fargo ( NYSE:WFC ), and Citigroup ($C) reporting. Strong results could offset trade and inflation anxieties; expect volatility in financials
📈 Goldman Sees Broader S&P Rally
Goldman Sachs projects the S&P 500 to climb roughly 11% to 6,900 by mid‑2026, underpinned by firm earnings and expected Fed rate cuts. But warns that breadth remains narrow, increasing downside risk without robust participation
⚠️ Summer Volatility Risk Lingers
Deutsche Bank warns that summer’s low liquidity and the looming Aug 1 tariff re‑imposition deadline may spark sudden market turbulence—even amid bullish sentiment
📊 Key Data Releases & Events 📊
📅 Monday, July 14
Quiet start—markets digest back-to-back CPI, tariffs, and clearing post‑earnings.
📅 Tuesday, July 15
8:30 AM ET – Consumer Price Index (June)
Watch for potential tariff impact in CPI; core inflation data are crucial.
8:30 AM ET – Core CPI (June)
10:00 AM ET – Empire State Manufacturing Survey (July)
Early view on Northeast factory trends.
📅 Wednesday, July 16
8:30 AM ET – Producer Price Index (June)
Wholesale inflation signals to validate CPI trends.
10:00 AM ET – Housing Starts & Building Permits (June)
📅 Thursday, July 17
8:30 AM ET – Initial & Continuing Jobless Claims
A gauge on labor-market resilience amid talks of cooling.
📅 Friday, July 18
10:00 AM ET – Federal Reserve Beige Book Release
Fed’s regional economic snapshot ahead of next FOMC.
⚠️ Disclaimer:
This is for educational/informational use only—not financial advice. Consult a licensed professional before investing.
📌 #trading #stockmarket #economy #tariffs #inflation #earnings #Fed #CPI #technicalanalysis

Friday afternoon UpdateSPX looks like it's consolidating only. Gold has broken above resistance. OIL and Nat Gas looks like they want to go higher. BTC should go higher, but not too much more.

Multi Market Update 7-9-2025SPY likely put in a C wave this morning, I expect a further move down for the rest of the week. Gold starting to look bullish again. Natural Gas likely keeps dropping towards 2.5. BTC at the top of it's range. USOIL is at resistance. The stock I'm trading - aapl - is showing a bear flag on small time frames

Nightly $SPY / $SPX Scenarios for July 9, 2025🔮 Nightly AMEX:SPY / SP:SPX Scenarios for July 9, 2025 🔮
🌍 Market-Moving News 🌍
📦 Tariff Pause Extended to August 1
President Trump delayed the July 9 tariff deadline, pushing negotiations into early August. Markets reacted with muted volatility, suggesting growing comfort that deals will be struck—yet widespread uncertainty remains
💵 Junk Bonds Rally Amid Tariff Tangling
Despite ongoing tariff risks, investors are doubling down on U.S. high-yield (junk) bonds. They anticipate the Fed may refrain from tightening further—favoring spread-tightening to around 7–8% yields—reflecting confidence in credit quality
🏦 Fed Faces Tough Call on Rate Path
New business surveys show conflicting signals: mixed revenue outlooks, cautious spending, and ongoing tariff pressures. The Fed must weigh slower growth against inflationary risks—keeping the door open to rate cuts in the autumn but unlikely before September
📊 Equities Firm Amid Tariff Uncertainty
Stocks showed resilience—S&P 500 and futures held position—after Monday’s tariff-triggered dip. Dip-buying and expectations of extended trade talks kept markets steady despite policy noise
📊 Key Data Releases & Events 📊
📅 Wednesday, July 9:
All Day – Ongoing U.S.–tariff negotiations; markets focused on any progress toward formal deal-making or extension terms.
Midday – Watch for headlines on tariff letters to 14 countries and any movement in trade discussions.
⚠️ Disclaimer:
This information is for educational and informational purposes only and should not be construed as financial advice. Always consult a licensed financial advisor before making investment decisions.
📌 #trading #stockmarket #economy #tariffs #Fed #fixedincome #credit #technicalanalysis

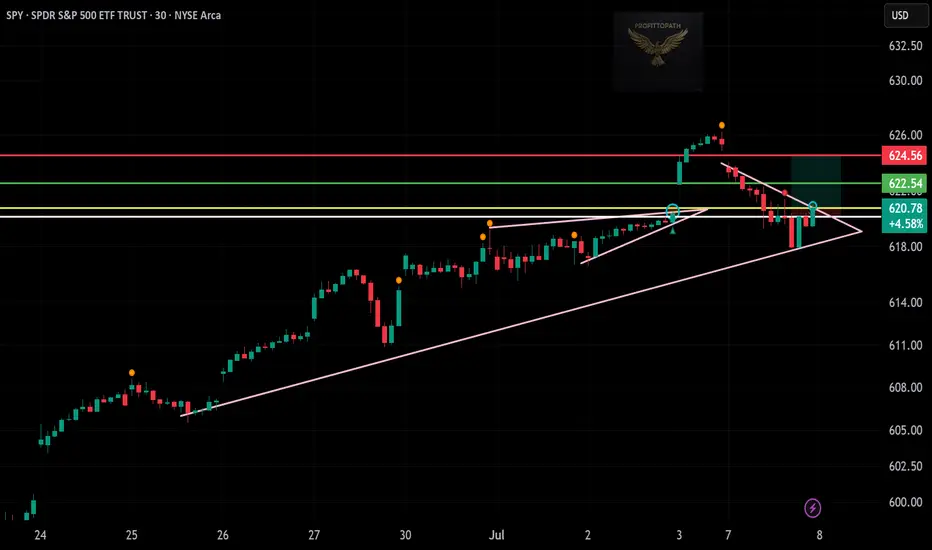
SPY Breakout Setup – Bullish Pattern Watch! 📈 🟢
SPY has formed a clear ascending triangle with strong support at $616. After a pullback, it’s now breaking out above $620.78 with a bounce from trendline support and rejection of lower prices.
📌 Trade Details:
🔹 Entry: $620.78
🔹 Stop Loss: $616.00
🔹 Target: $624.56
🔹 Pattern: Ascending Triangle Breakout
This setup aligns with market momentum and breakout structure. Great risk-reward for bulls watching major index movement.
—
📊 Posted by: ProfittoPath
#SPY #SP500 #ETFTrading #BreakoutSetup #MarketUpdate #ProfittoPath #TechnicalAnalysis #StockTrader #ChartAnalysis
Nightly $SPY / $SPX Scenarios for July 8, 2025🔮 Nightly AMEX:SPY / SP:SPX Scenarios for July 8, 2025 🔮
🌍 Market-Moving News 🌍
📉 U.S. Stocks Slip on New Tariff Threats
President Trump announced plans to impose 25% tariffs on imports from Japan, South Korea, Malaysia, Kazakhstan, South Africa, Laos, and Myanmar starting August 1, reigniting trade jitters. The Dow fell ~0.9%, the S&P 500 dropped ~0.8%, and the Nasdaq slid ~0.9% on the news, while bond futures rallied and the dollar strengthened
⚖️ Tariff Pause Deadline Looms
Markets are focused on the July 9 deadline for the current tariff pause, which now hinges on imminent trade negotiations. Investors are balancing the risk of reimposition against progress with agreements involving the U.K., Vietnam, and Canada
💵 Consumer Credit Moderates
June’s consumer credit increase slowed to $10.60 billion vs. April’s $17.87 billion—still strong, but a cooling sign in household borrowing patterns. This tempered the dollar’s rise amid mixed signals on consumer resilience.
🛢️ Oil Drops on Rising OPEC+ Supply
Oil prices fell, with Brent dipping to ~$68.00/barrel and WTI to ~$65.30, after confirmation of OPEC+’s August supply hike—adding to bearish cues for energy stocks .
📊 Key Data Releases & Events 📊
📅 Tuesday, July 8:
3:00 PM ET – Consumer Credit (June)
Moderation in borrowing signals possible easing in consumer-driven growth.
4:30 PM ET – API Weekly Crude Inventories
A key indicator for energy markets; lower inventories lift oil prices, while builds push them down.
Throughout the Day – Tariff Pause Deadline
Market stability hinges on whether trade agreements materialize before the break expires.
⚠️ Disclaimer:
This information is for educational and informational purposes only and should not be construed as financial advice. Always consult a licensed financial advisor before making investment decisions.
📌 #trading #stockmarket #economy #tariffs #consumercredit #oil #technicalanalysis

spy puts on level 610 and 614There some level i would like to meet 610 and 614
Disclaimer- it a opinion

Weekly $SPY / $SPX Scenarios for July 7–11, 2025🔮 Weekly AMEX:SPY / SP:SPX Scenarios for July 7–11, 2025 🔮
🌍 Market‑Moving News 🌍
📈 From Panic to "Goldilocks" Rally
The S&P 500 and Nasdaq hit fresh record highs, surging ~20% from April lows. Markets rallied on a combination of easing Middle East tensions, the 90‑day tariff pause, a new fiscal bill in Washington, and strong June jobs data. Still, strategists caution that optimism may be ahead of fundamentals, especially if trade volatility returns
💱 Dollar Weakness & Bond Market Watch
The U.S. dollar remains near 3.5‑year lows amid rate‑cut speculation and trade progress. Treasury yields are volatile this week, impacted by concerns over escalating debt issuance, upcoming tariff deadlines (July 9), and the Federal Reserve’s stance .
🏢 Tech Leadership Shifts
With the “Magnificent Seven” tech stocks near heights, growth is spreading: cyclical sectors, small‑caps, and industrials are gaining momentum. AI remains the primary engine, but resilience across a broader stock base is signaling a potentially sustainable rally
⚠️ Tariff Truce Deadline Looms (July 9)
The April tariff pause expires mid‑week. U.S. plans to extend exemptions via trade talks with partners like UK, Vietnam, and Canada—yet any delay or failure may shock markets. Watch for headlines that may trigger spillover effects .
📊 Key Data Releases & Events 📊
📅 Monday, July 7:
Independence Day markets resume. Light trading expected ahead of data and tariff deadline.
📅 Tuesday, July 8:
10:00 AM ET – Consumer Credit (June)
Gauges borrowing trends—an indicator of household health in a low‑rate environment.
📅 Wednesday, July 9:
EIA Crude Oil Inventories & MBA Mortgage Apps & Wholesale Inventories
Key mid‑week data points; oil builds may pressure energy stocks.
Tariff Pause Deadline – Expect market volatility on news of extension or reimposition.
📅 Thursday, July 10:
8:30 AM ET – Initial & Continuing Jobless Claims
10:00 AM ET – Natural Gas Inventories
Markets focus on labor health and energy trends.
📅 Friday, July 11:
10:00 AM ET – Treasury Budget Statement
Details on government borrowing and fiscal outlook—markets sensitive to deficit risks.
⚠️ Disclaimer:
These insights are for educational purposes only—not financial advice. Consult a licensed advisor before making investing decisions.
📌 #trading #stockmarket #economy #news #tariffs #Fed #AI #technicalanalysis
SPY: Bearish Continuation & Short Trade
SPY
- Classic bearish pattern
- Our team expects retracement
SUGGESTED TRADE:
Swing Trade
Sell SPY
Entry - 625.36
Stop - 633.00
Take - 611.27
Our Risk - 1%
Start protection of your profits from lower levels
Disclosure: I am part of Trade Nation's Influencer program and receive a monthly fee for using their TradingView charts in my analysis.
❤️ Please, support our work with like & comment! ❤️

SPY/QQQ Plan Your Trade End Of Week Update For 7-4Happy 4th of July
I've been very busy with projects and new tools for traders, as well as the new book I'm working on, and thought I would deliver an End Of Week update for everyone.
In this video, I cover the past Cycle Patterns and how they played out for the SPY/QQQ, Gold/Silver, and Bitcoin, as well as add some of my own insight related to the market trends.
All of my systems are still LONG and have not changed. I still believe this market is extremely overbought, and I believe it could roll over at any moment into a pullback - but we need to wait to see if/when that may/does happen.
Gold made a big move higher this week, and I believe that move could continue throughout July.
Bitcoin made a surprising Double-Top and is not rolling downward. Could be a breakdown in the markets as BTCUSD tends to lead the QQQ/NQ by about 3-5 days.
The SPY/QQQ rallied like a rocket all week. It was absolutely incredible to see the markets rally like this. But, I'm still cautious of a sudden rollover top.
I managed to catch some nice trades with options spreads this week, and my metals positions were on fire. I'm still trading from a "hedge everything" mode as I don't trust this rally, and I'm still watching for REJECTIONS near these new highs.
Stay safe and GET SOME.
DM me if you have any questions.
#trading #research #investing #tradingalgos #tradingsignals #cycles #fibonacci #elliotwave #modelingsystems #stocks #bitcoin #btcusd #cryptos #spy #gold #nq #investing #trading #spytrading #spymarket #tradingmarket #stockmarket #silver

Debugging Pine Script with log.info()log.info() is one of the most powerful tools in Pine Script that no one knows about. Whenever you code, you want to be able to debug, or find out why something isn’t working. The log.info() command will help you do that. Without it, creating more complex Pine Scripts becomes exponentially more difficult.
The first thing to note is that log.info() only displays strings. So, if you have a variable that is not a string, you must turn it into a string in order for log.info() to work. The way you do that is with the str.tostring() command. And remember, it's all lower case! You can throw in any numeric value (float, int, timestamp) into str.string() and it should work.
Next, in order to make your output intelligible, you may want to identify whatever value you are logging. For example, if an RSI value is 50, you don’t want a bunch of lines that just say “50”. You may want it to say “RSI = 50”.
To do that, you’ll have to use the concatenation operator. For example, if you have a variable called “rsi”, and its value is 50, then you would use the “+” concatenation symbol.
EXAMPLE 1
━━━━━━━━━━━━━━━━━━━━━━━━━━━━━━━━━
//@version=6
indicator("log.info()")
rsi = ta.rsi(close,14)
log.info(“RSI= ” + str.tostring(rsi))
Example Output =>
RSI= 50
Here, we use double quotes to create a string that contains the name of the variable, in this case “RSI = “, then we concatenate it with a stringified version of the variable, rsi.
Now that you know how to write a log, where do you view them? There isn’t a lot of documentation on it, and the link is not conveniently located.
Open up the “Pine Editor” tab at the bottom of any chart view, and you’ll see a “3 dot” button at the top right of the pane. Click that, and right above the “Help” menu item you’ll see “Pine logs”. Clicking that will open that to open a pane on the right of your browser - replacing whatever was in the right pane area before. This is where your log output will show up.
But, because you’re dealing with time series data, using the log.info() command without some type of condition will give you a fast moving stream of numbers that will be difficult to interpret. So, you may only want the output to show up once per bar, or only under specific conditions.
To have the output show up only after all computations have completed, you’ll need to use the barState.islast command. Remember, barState is camelCase, but islast is not!
EXAMPLE 2
━━━━━━━━━━━━━━━━━━━━━━━━━━━━━━━━━
//@version=6
indicator("log.info()")
rsi = ta.rsi(close,14)
if barState.islast
log.info("RSI=" + str.tostring(rsi))
plot(rsi)
However, this can be less than ideal, because you may want the value of the rsi variable on a particular bar, at a particular time, or under a specific chart condition. Let’s hit these one at a time.
In each of these cases, the built-in bar_index variable will come in handy. When debugging, I typically like to assign a variable “bix” to represent bar_index, and include it in the output.
So, if I want to see the rsi value when RSI crosses above 0.5, then I would have something like:
EXAMPLE 3
━━━━━━━━━━━━━━━━━━━━━━━━━━━━━━━━━
//@version=6
indicator("log.info()")
rsi = ta.rsi(close,14)
bix = bar_index
rsiCrossedOver = ta.crossover(rsi,0.5)
if rsiCrossedOver
log.info("bix=" + str.tostring(bix) + " - RSI=" + str.tostring(rsi))
plot(rsi)
Example Output =>
bix=19964 - RSI=51.8449459867
bix=19972 - RSI=50.0975830828
bix=19983 - RSI=53.3529808079
bix=19985 - RSI=53.1595745146
bix=19999 - RSI=66.6466337654
bix=20001 - RSI=52.2191767466
Here, we see that the output only appears when the condition is met.
A useful thing to know is that if you want to limit the number of decimal places, then you would use the command str.tostring(rsi,”#.##”), which tells the interpreter that the format of the number should only be 2 decimal places. Or you could round the rsi variable with a command like rsi2 = math.round(rsi*100)/100 . In either case you’re output would look like:
bix=19964 - RSI=51.84
bix=19972 - RSI=50.1
bix=19983 - RSI=53.35
bix=19985 - RSI=53.16
bix=19999 - RSI=66.65
bix=20001 - RSI=52.22
This would decrease the amount of memory that’s being used to display your variable’s values, which can become a limitation for the log.info() command. It only allows 4096 characters per line, so when you get to trying to output arrays (which is another cool feature), you’ll have to keep that in mind.
Another thing to note is that log output is always preceded by a timestamp, but for the sake of brevity, I’m not including those in the output examples.
If you wanted to only output a value after the chart was fully loaded, that’s when barState.islast command comes in. Under this condition, only one line of output is created per tick update — AFTER the chart has finished loading. For example, if you only want to see what the the current bar_index and rsi values are, without filling up your log window with everything that happens before, then you could use the following code:
EXAMPLE 4
━━━━━━━━━━━━━━━━━━━━━━━━━━━━━━━━━
//@version=6
indicator("log.info()")
rsi = ta.rsi(close,14)
bix = bar_index
if barstate.islast
log.info("bix=" + str.tostring(bix) + " - RSI=" + str.tostring(rsi))
Example Output =>
bix=20203 - RSI=53.1103309071
This value would keep updating after every new bar tick.
The log.info() command is a huge help in creating new scripts, however, it does have its limitations. As mentioned earlier, only 4096 characters are allowed per line. So, although you can use log.info() to output arrays, you have to be aware of how many characters that array will use.
The following code DOES NOT WORK! And, the only way you can find out why will be the red exclamation point next to the name of the indicator. That, and nothing will show up on the chart, or in the logs.
// CODE DOESN’T WORK
//@version=6
indicator("MW - log.info()")
var array rsi_arr = array.new()
rsi = ta.rsi(close,14)
bix = bar_index
rsiCrossedOver = ta.crossover(rsi,50)
if rsiCrossedOver
array.push(rsi_arr, rsi)
if barstate.islast
log.info("rsi_arr:" + str.tostring(rsi_arr))
log.info("bix=" + str.tostring(bix) + " - RSI=" + str.tostring(rsi))
plot(rsi)
// No code errors, but will not compile because too much is being written to the logs.
However, after putting some time restrictions in with the i_startTime and i_endTime user input variables, and creating a dateFilter variable to use in the conditions, I can limit the size of the final array. So, the following code does work.
EXAMPLE 5
━━━━━━━━━━━━━━━━━━━━━━━━━━━━━━━━━
// CODE DOES WORK
//@version=6
indicator("MW - log.info()")
i_startTime = input.time(title="Start", defval=timestamp("01 Jan 2025 13:30 +0000"))
i_endTime = input.time(title="End", defval=timestamp("1 Jan 2099 19:30 +0000"))
var array rsi_arr = array.new()
dateFilter = time >= i_startTime and time <= i_endTime
rsi = ta.rsi(close,14)
bix = bar_index
rsiCrossedOver = ta.crossover(rsi,50) and dateFilter // <== The dateFilter condition keeps the array from getting too big
if rsiCrossedOver
array.push(rsi_arr, rsi)
if barstate.islast
log.info("rsi_arr:" + str.tostring(rsi_arr))
log.info("bix=" + str.tostring(bix) + " - RSI=" + str.tostring(rsi))
plot(rsi)
Example Output =>
rsi_arr:
bix=20210 - RSI=56.9030578034
Of course, if you restrict the decimal places by using the rounding the rsi value with something like rsiRounded = math.round(rsi * 100) / 100 , then you can further reduce the size of your array. In this case the output may look something like:
Example Output =>
rsi_arr:
bix=20210 - RSI=55.6947486019
This will give your code a little breathing room.
In a nutshell, I was coding for over a year trying to debug by pushing output to labels, tables, and using libraries that cluttered up my code. Once I was able to debug with log.info() it was a game changer. I was able to start building much more advanced scripts. Hopefully, this will help you on your journey as well.

Update on the Markets 7/3/25SPY got the pop up I was looking for - now the question is - does it hold and continue? Not sure yet. Gold could be bullish if it gets over 3370. Usoil had a pop but nothing screaming reversal yet. NG is in a wedge. BTC is at the top of it's range

Opening (IRA): SPY July 18th 495 Short Put... for a 5.13 credit.
Comments: Targeting the <16 delta strike paying around 1% of the strike price in credit.
Max Profit: 5.13
ROC at Max as a Function of Strike Price: 1.04%
Will generally look to roll up if the short put is in profit at 45 DTE or greater, add at intervals if I can get in at strikes better than what I currently have on at the June 513's and July 495's, and/or consider a "window dressing" roll (i.e., a roll down to a strike that is paying about the same in credit) to milk the last drops out of the position.

SPRIAL TURN MAJOR JULY 5to the 10th TOP 4 spiral and one FIBThe chart posted is the updated chary for SPY SPIRAL calendar TURN Notice f12 is a spiral from July 16th 2024 top F 10 is from 11/2024 DJI The SPY was 12/5 th TOP F8 is from Feb 19th Top They ALL have a focus point on JULY 5th to 10th 2025 it is also 89 days since the print low. I Am looking for a MAJOR World event into this date . This time I feel it will be something with JAPAN . As to the markets here The put/call is now at the same level as july 2023 top and july 2024 . I have had fib targets in cash sp 500 from 6181 to as high as 6331 we are now in the middle of the targets But Time still has 3 to 5 days .So if we close strong today I will be buying deep in the money puts once again . The QQQ have entered the min target 551/553 But I tend to think {HOPE] we can reach 562 plus or minus 1.5 to move to a full short . But now in cash BTW the SMH target 283/285 is also a target .for its TOP Bitcoin is now setup for the next TOP I just need a new high .Best of trades WAVETIMER

SPY the pattern was there I missed it.THe chart will always show you what it wants to do. You have to see it.

SPY 4HSResistance: 630 – Strong supply zone, potential profit-taking area.
Support Zone: Around 617 – Recently tested, holding as short-term support.
Gap: 615.03 → If SPY loses 617, watch for a retracement to fill the gap toward 615.
Major 4H Support: 610.17 – Institutional block. Losing this level would break the short-term bullish structure.

Long Trade Idea: SPY (S&P 500 ETF)!🧠
📅 Timeframe: 30-Minute
📈 Type: Long Position
📐 Setup: Tight consolidation breakout + bullish wedge pattern
📍 Trade Details:
Entry: $620.39 (breakout from rising wedge)
Stop Loss: ~$618.80 (below wedge support)
Target 1: $622.34 (minor resistance)
Target 2: $624.56 (major resistance zone)
🔎 Technical Breakdown:
Price formed a tight rising wedge, squeezing under resistance
Bullish breakout confirmed above consolidation
Strong uptrend continuation — higher highs + higher lows
SPY remains strong despite market hesitation
🎯 Risk/Reward Outlook:
Risk: ~$1.59
Reward: Up to ~$4.17
RR > 2.5:1 — ideal structure for breakout traders
💬 Caption (for Social/Chart Post):
“SPY breaks higher! 💥📈
Wedge breakout signals bullish momentum 🟢
Clean setup toward $624+ zone 🔓
Watch for continuation above $622.34!”
#SPY #LongTrade #BreakoutSetup #S&P500 #ProfittoPath #ETFTrading

SP500 approaching rising trendline from belowThere has always been some correction when the market approaches the rising trendline from below. AMEX:SPY has about 10 point and SP:SPX about 100 points to go still. The volume is still on the buy side. I expect that to fade before a correction. Some market leaders like AMZN have already touched that trendline

Nightly $SPY / $SPX Scenarios for July 3, 2025🔮 Nightly AMEX:SPY / SP:SPX Scenarios for July 3, 2025 🔮
🌍 Market-Moving News 🌍
📉 U.S. Private Payrolls Surround Weakness
The ADP report showed a drop of 33,000 private-sector jobs in June, the first decline in over two years, reflecting businesses holding back hiring amid trade uncertainty. However, layoffs remain low, signaling no acute stress yet
📊 Markets Braced for NFP Caution
Markets are wary ahead of this morning’s Non‑Farm Payroll (NFP) release—currently projected at +115,000 jobs and 4.3% unemployment—based on indications of labor-market cooling from weak ADP numbers
💵 Canadian Dollar Strengthens
The loonie jumped 0.4% as investors adjust expectations for broader central-bank dovishness, driven by the weak U.S. jobs signals and optimism over a revived U.S.–Canada trade dialogue
📊 Key Data Releases 📊
📅 Thursday, July 3:
8:30 AM ET – Non‑Farm Payrolls (June):
Forecast: +115,000; Previous: +139,000 (May). Watching for signs of sustained job-growth slowdown.
8:30 AM ET – Unemployment Rate:
Forecast: 4.3%, up from 4.2% in May. A rise may increase odds of rate cuts.
8:30 AM ET – Average Hourly Earnings (MoM):
Forecast: +0.3%; prior: +0.4%. Cooling wages would ease inflation pressures.
8:30 AM ET – Initial & Continuing Jobless Claims:
Track week-to-week stability or worsening of labor-market conditions.
9:45 AM ET – Services PMI (June, flash):
Monitor for signs of slowing in U.S. service-sector activity.
10:00 AM ET – ISM Non-Manufacturing PMI (June, flash):
Forecast: 50.8. A reading below 50 suggests contraction in services.
⚠️ Disclaimer:
For informational and educational purposes only. It does not constitute financial advice. Consult a licensed financial advisor before making investment decisions.
📌 #trading #stockmarket #economy #jobs #Fed #labor #technicalanalysis

SPY - TargetsWatching this wedge, Trump making headwinds with trade talks, striking a vietnam deal. Buyers still in control but hesitant, the "Big Beautiful Bill' being hashed out in the next couple of weeks. Could easily see a small pull back into the EMA's, Betting we see prices higher to the bullish target $700 if we can break above T/L with nice volume.
