Nightly $SPY / $SPX Scenarios for March 18, 2025 🔮 🔮
🌍 Market-Moving News 🌍:
🇺🇸🏛️ Federal Reserve Meeting Commences 🏛️: The Federal Open Market Committee (FOMC) begins its two-day policy meeting on March 18, with a decision on interest rates expected on March 19. While markets anticipate that the Fed will maintain current rates between 4.25% and 4.5%, investors will closely monitor the meeting for any signals regarding future monetary policy directions.
🇨🇳📊 China's Economic Data Release 📊: China is set to release key economic indicators, including retail sales and industrial production figures for February. These data points will offer insights into the health of the world's second-largest economy and could have ripple effects on global markets, including the U.S.
📊 Key Data Releases 📊:
📅 Tuesday, March 18:
🏠 Housing Starts (8:30 AM ET) 🏠:This report measures the number of new residential construction projects begun during the month, providing insight into the housing market's strength.
Forecast: 1.31 million units (annualized)
Previous: 1.34 million units
🏢 Building Permits (8:30 AM ET) 🏢:This data indicates the number of permits issued for new construction projects, serving as a leading indicator for future housing activity.
Forecast: 1.35 million units (annualized)
Previous: 1.36 million units
⚠️ Disclaimer: This information is for educational and informational purposes only and should not be construed as financial advice. Always consult with a professional financial advisor before making investment decisions.⚠️
📌 #trading #stockmarket #economy #news #trendtao #charting #technicalanalysis
S27 trade ideas

SPY: HAMMER TIME!!! Multiple Confluences!Fundamentals : Ignore all the boohoo!
Technicals :
Hammer time!
VPA confirmation
uHd
ext. indicator
61.8% fib support
horizontal support
all this = multiple confluences

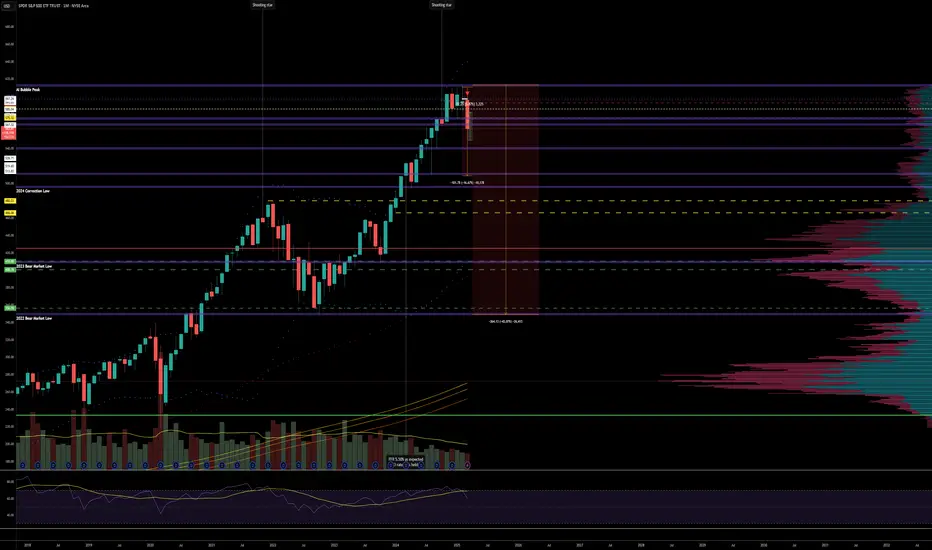
SPY is likely to find support between 530 and 550The SPY ETF (SPDR S&P 500 ETF Trust) recently peaked at 613.23, reaching the upper boundary of a long-term channel that has been in place since 2009. This suggests the market is in an overbought state. Looking at historical trends suggests that the continuation of previous upward trends became unsustainable after reaching critical levels. The current correction signals that the market is adjusting toward a healthier upward trend.
The long-term trend since 2009 remains intact. However, the upward trend that began in 2023 is broken, with the price now trading below the 200-day moving average and previous lows. Overall, the long-term trend is strong, and historical momentum suggests that SPY could find support between 530 and 550. In a worst-case scenario, the price may decline toward the key support zone of 490 to 500. The recent correction also suggests that any rebound could be sharp and V-shaped.

The Bigger Picture5300 area still looks like it will be possible sometime next week. I explain the leading diagonal count and why I think another ABC down is likely.

SPY - support & resistant areas for today March 17, 2025The key support and resistance levels for SPY today are above.
Follow me to get this notified when I publish in the morning.
Understanding key levels in trading can provide valuable insights into potential market movements. These levels often indicate where prices might reverse or consolidate, serving as important signals for traders considering long (buy) or short (sell) positions.
Calculated using complex mathematical models, these levels are tailored for today's trading session and may evolve as market conditions change.
If you find this information beneficial and would like to receive these insights every morning at 9:30 AM, I invite you to support me by boosting this post and following me @OnePunchMan91. Your engagement is greatly valued! However, please note that if this post doesn’t receive more than 10 boosts, I will have to reconsider providing these daily updates. Thank you for your support!
Need any other charts daily, comment on this.
SPY/QQQ Plan Your Trade Video for 3-17: GAP PotentialAs we start moving into the Excess Phase Peak pattern consolidation phase, I believe the SPY/QQQ will attempt a moderate rally for about 3-5+ days, then roll into a deep selling mode after March 21-24.
I don't believe we have reached a bottom - yet.
I do see a lot of people talking about "the bottom is in" and I urge all of you to THINK.
What do you believe will be the basis of US and GLOBAL economic growth starting RIGHT NOW?
Can you name one thing that will be the driver of economic expansion and activity?
I can't either.
Thus, I suggest traders prepare for more sideways consolidation range trading over the next 60+ days as hedge assets and currencies attempt to balance risks.
BTCUSD, Gold, Silver should all be fairly quiet this week. I'm not expecting any huge price moves this week.
I expect the SPY/QQQ & BTCUSD to move a bit higher while Gold and Silver melt upward a bit further.
Then, after March 21, I expect bigger volatility and a broad rotation in the SPY/QQQ/Bitcoin where Gold/Silver will start a bigger move higher.
Get some.
#trading #research #investing #tradingalgos #tradingsignals #cycles #fibonacci #elliotwave #modelingsystems #stocks #bitcoin #btcusd #cryptos #spy #gold #nq #investing #trading #spytrading #spymarket #tradingmarket #stockmarket #silver

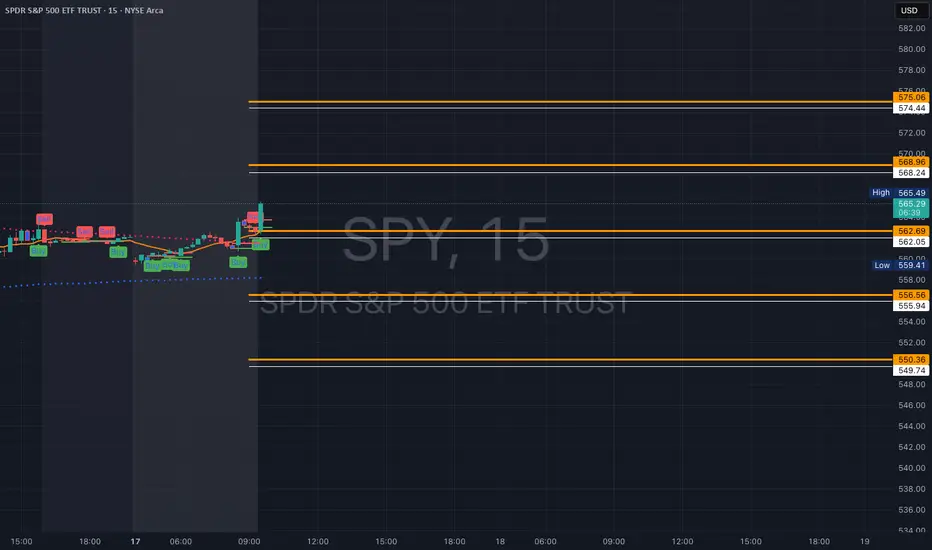
$SPY March 17. 2025AMEX:SPY March 17. 2025
15 Minutes.
AMEX:SPY near 200 averages in 15 minutes.
Big resistance point.
hence a pull back to 560.5 - 558.5 will be a good level to go long.
AMEX:SPY forming HH HL pattern.
A short I expect to be stopped around 556-558 levels.
Not a good R:R setup.
Sidelines today.

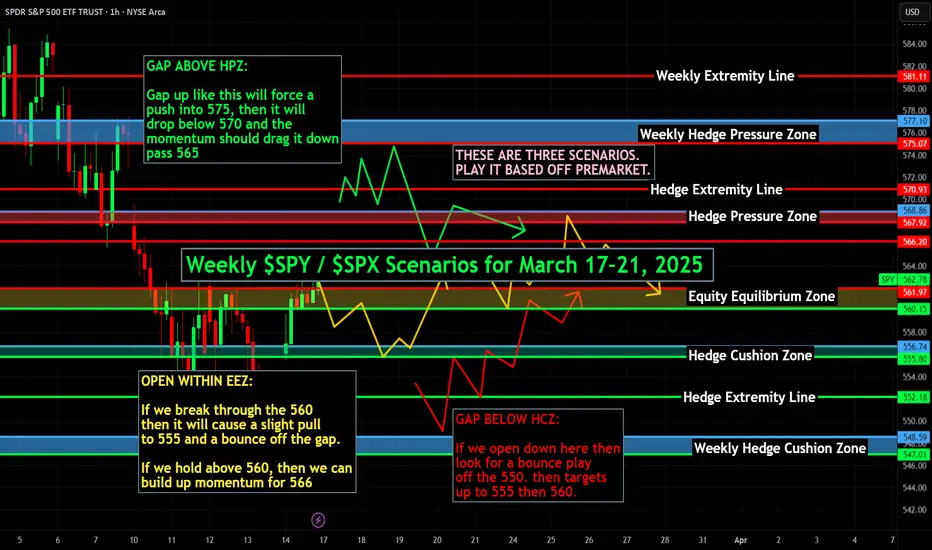
Weekly $SPY / $SPX Scenarios for March 17–21, 2025 🔮 🔮
🌍 Market-Moving News 🌍:
🇺🇸📉 Anticipated Federal Reserve Rate Decision 📉: The Federal Reserve is scheduled to announce its interest rate decision on Wednesday, March 19. Markets widely expect the Fed to maintain the current rates between 4.25% and 4.5%, following favorable inflation data. Investors will closely analyze the Fed's quarterly economic projections and Chair Jerome Powell's remarks for insights into future monetary policy.
🇨🇳📈 China's Economic Stimulus Measures 📈: China has announced plans to implement measures aimed at reviving domestic consumption. This initiative is expected to bolster global markets, including the U.S., as increased Chinese consumption can lead to higher demand for international goods and services.
🇯🇵🏦 Bank of Japan's Monetary Policy Decision 🏦: The Bank of Japan is set to announce its interest rate decision on March 20. While specific expectations are not detailed, any changes or guidance provided could have implications for global financial markets, including currency and equity markets.
📊 Key Data Releases 📊:
📅 Monday, March 17:
🛒 Retail Sales (8:30 AM ET) 🛒:This report measures the total receipts of retail stores, providing insight into consumer spending trends.
Forecast: +0.2% month-over-month
Previous: +0.3% month-over-month
📅 Wednesday, March 19:
🏠 Existing Home Sales (10:00 AM ET) 🏠:This data indicates the annualized number of previously constructed homes sold during the previous month, reflecting housing market conditions.
Forecast: 5.50 million annualized units
Previous: 5.47 million annualized units
📅 Thursday, March 20:
🏦 Federal Reserve Interest Rate Decision (2:00 PM ET) 🏦:The Federal Open Market Committee (FOMC) announces its decision on short-term interest rates, influencing borrowing costs and economic activity.
Forecast: No change, maintaining rates at 4.25%–4.50%
Previous: 4.25%–4.50%
⚠️ Disclaimer: This information is for educational and informational purposes only and should not be construed as financial advice. Always consult with a professional financial advisor before making investment decisions.⚠️
📌 #trading #stockmarket #economy #news #trendtao #charting #technicalanalysis
Skew traders don't lieIt is either a market's bottom, or it is going to get much worse! A reasonable point of entry for moderate-risk position sizes.

SPY Prediction.Here's my SPY breakdown using top-down charting from the 1Hr and 15min timeframes.
On the 1Hr TF, there was a lower low (LL) created last Thursday around ($549.62). For the downtrend to continue, price needs to stay below ($564.02) to form a lower high (LH) and possibly go back to test that Thursday low.
Now switching to the 15min TF, you can see that the ($562 - $564) level was tested four times, and each time price rejected and pushed lower. But remember what happened Friday around 2 PM — price spiked to ($563.83), then sellers stepped in and brought it right back down.
So for Monday, if SPY gaps up over ($564), I’m looking to take calls for a push toward ($570 - $573) (just like the moves we saw on October 31 and November 5). But I would only scalp that move — personally, I wouldn’t be fully bullish unless SPY turns ($568 - $570) into support like it did back in November.
If SPY does not gap up ($564), then I expect more downside pressure with a possible re-test of that ($549.62) low.
This is just my opinion, make sure to chart it out yourself.

Fakeout breakout??Looking pretty damn bullish and have finally closed above this down trend line. What’s going to come from it? I believe big money is ready to hop back into the game now that prices are on a major sale!
What do you think?

2014-2016 fractal Based on the current environment it seems something similar to 2014-2016 could play out. 2014 had a little flash crash like we currently just had. Defensive sectors look set to outperform which is similar to this period as well.

SPY at Key Inflection Point! Big Move Soon? Mar17 Week 🔥Hey traders! Quick update on SPY's 4-hour chart setup.
📈 Technical Analysis (TA):
* SPY broke above the descending trendline signaling possible bullish momentum.
* Immediate resistance overhead between $562–$582, which is critical for confirming a bullish trend reversal.
* Recent Break of Structure (BOS) established a clear support zone around $545-$550, an essential zone for potential reversals.
* Higher resistance around $607–$610 could come into play if bullish momentum builds.
📊 GEX & Options Insights:
* Highest negative NET GEX at $550, marking a critical PUT support level; key to watch if prices dip.
* Strong CALL resistance at $582, significant gamma wall here. Breakout could accelerate price upwards quickly.
* IV Rank is moderate at 42.8%, creating opportunities for both debit and credit options strategies.
* High PUT ratio (92.9%) indicates heavy bearish sentiment in options positioning—stay cautious.
💡 Trade Recommendations:
* Bullish Play: Confirmed break above $582 could trigger a bullish push toward the $607–$610 range. Stops tight under $570.
* Bearish Play: Watch for a clear rejection at $582; puts could target $550 support, potentially even down toward $545.
* Neutral strategies: Consider selling premium via Iron Condors or credit spreads between the clear boundaries ($550–$582).
🛑 Risk Management: Maintain disciplined trades with clear risk control due to volatility at key levels.
Stay focused and good luck!
Disclaimer: This analysis is for educational purposes only and does not constitute financial advice. Always do your own research and manage your risk before trading.

SPY Market Outlook - Week and Month ahead (Mar - Apr 2025)With SPY rejecting off the July ’24 and August ’24 resistance zone, combined with low volume into the close, we need to assess the technical setup, economic landscape, market psychology, and potential institutional strategies to predict where SPY may move next.
⸻
1️⃣ Technical Analysis – Recent Price Action & Key Levels
📌 Friday’s Price Action & Rejection at Resistance
• SPY rallied throughout the day but stalled at a key historical resistance (~563-564).
• The last 10 minutes of trading saw a rejection off resistance, signaling institutional selling or profit-taking at that level.
• Low volume into the close suggests a lack of aggressive buyers at these elevated levels.
📈 Key Resistance Levels (Upside Risks)
• 563.91 - 565.02 → Major resistance from past highs.
• 568 - 570 → Psychological level; breaking above this could trigger an upside squeeze.
📉 Key Support Levels (Downside Risks)
• 553.89 (S1 Pivot) → First support level.
• 550 - 548 → Stronger support, where buyers might step in.
• 540-535 → If macro conditions weaken, this could be tested.
🔹 Bias for next week: Short-term caution. A rejection off a previous resistance with low volume suggests a possible pullback before another attempt higher.
⸻
2️⃣ Economic & Fiscal Factors Influencing SPY
🏦 Federal Reserve & Interest Rates
• March 2025 FOMC Meeting: The Fed’s next decision on interest rates will dictate short-term direction.
• Current market expectation: Fed holds rates steady, but any hawkish stance (no rate cuts) could push SPY down.
• Rate cut speculation: If economic data weakens, the Fed may pivot towards rate cuts, fueling another SPY rally.
🛒 Inflation Data & Consumer Spending
• CPI/PCE Inflation Reports: If inflation data is hotter than expected, SPY could sell off on rate hike fears.
• Retail Sales Data: A slowdown in consumer spending would indicate weakening economic strength.
📉 Fiscal & Geopolitical Concerns
• U.S. Debt & Fiscal Policy:
• Treasury issuing more bonds? Yields could rise, causing stocks to fall.
• Government spending cuts? Negative for growth stocks.
• Global Risks (China Slowdown, Middle East Tensions):
• Any geopolitical escalation could cause a flight to safety (bonds, gold, USD), hurting SPY.
🔹 Bias for next month: If the Fed maintains a hawkish stance, SPY could see a deeper pullback toward 540-550. However, if inflation cools and rate cuts are expected, SPY could attempt another breakout.
⸻
3️⃣ Market Psychology & Institutional Strategies
🎰 The “Casino” Effect: Retail Traders vs. Smart Money
How Market Makers & Algorithms Trap Retail Traders
The stock market operates like a casino, using psychological tactics to keep traders engaged and induce poor decision-making:
• “Near Miss” Effect: Just like slot machines keep gamblers playing by showing near-wins, market makers drive SPY close to resistance before a rejection, making traders believe a breakout is coming.
• “Dopamine Trading” & FOMO: Market structure induces FOMO, encouraging retail traders to buy at the worst times (tops).
• “Liquidity Hunts”: Institutions push prices just above resistance to trigger retail stop-losses before reversing.
🔹 Current Setup Psychology:
• Retail Bulls feel confident after last week’s rally, believing a breakout is imminent.
• Smart Money is likely selling into strength, creating a liquidity trap.
• If volume stays low, it indicates institutions are not supporting higher prices.
📉 Where Institutions Could Take SPY Next
1️⃣ Shakeout Before a Move Higher (Most Likely)
• SPY pulls back to 550-553 early next week to trap weak-handed longs, then reverses higher.
2️⃣ True Reversal (Less Likely Unless Macro Shifts Bearish)
• Failure at 550 → Drop to 535-540.
3️⃣ Parabolic Breakout (Only If Fed Signals Rate Cuts Soon)
• If Fed hints at rate cuts, SPY breaks 565 and runs toward 570+.
⸻
4️⃣ Trading Plan for the Week & Month
🎯 Short-Term (Next 1-2 Weeks)
🔻 Bearish Bias Until SPY Proves Strength Above 565
• Trade Idea:
• Sell SPY 565 Calls & Buy SPY 555 Puts (Credit Spread)
• Target: 550-553
• Stop-loss: If SPY holds 565 with strong volume.
📉 Aggressive Short Play (Only if SPY loses 550)
• Buy SPY 545 Puts, target 540.
📈 Medium-Term (Next 3-4 Weeks)
• Bullish Reversal Levels:
• If SPY holds 550 & reclaims 560 → Go Long.
• Buy SPY 560 Calls, Target 570.
⚠️ Risk Management & Key Triggers
• Watch CPI & FOMC Meeting: Macro news will determine if SPY sells off further or breaks resistance.
• Volume Confirmation: If low volume continues, expect more chop & fakeouts.
• Biggest Bullish Catalyst: Fed signaling rate cuts earlier than expected.
⸻
📌 Final Summary – What to Expect for SPY?
1️⃣ Short-Term Pullback Likely (550-553), Then a Decision Point.
2️⃣ SPY Must Break 565 With Volume for Bulls to Win.
3️⃣ Watch Institutional Behavior – Smart Money Might Be Distributing.
4️⃣ Key Catalysts: CPI, FOMC, & Market Psychology Will Dictate Direction.

SPY IS REPEATING THIS MARCH 2022 PATTERN !! BOUNCE INCOMING?AMEX:SPY is repeating this exact pattern not seen since March 2022. Here's what's next

SPY: Update for Week of March 17Hey everyone,
A bit of a longer idea, but I had lots to talk about about, I guess.
Here is the summary information for next week:
Summary
Most likely high target 568.21 (probability assigned 18%)
Most likely bear target 552.74 (probability assigned 64%)
Retracement target 557 (probability 71%)
Expected return -0.11% (very conservative this week interestingly enough).
EMA 200 average target 533 range
Weekly Levels
Weekly Forecast
Thanks for watching and reading and as always safe trades! 🚀And not advice!🚫

SPY to Crash to $350s by MayPeople fail to realize how dramatic market crashes can be. Historically bear markets have seen 30%+ declines from peak. We are going to see a 40%-50% decline from peak down to 350s by May.
With 1 or 2 exceptions, rate cutting cycles have always coincided with bear markets, which are 30%+ declines from peak in the S&P 500. We have the largest spike in unemployment since covid, largest drop off in real estate sales, massive AI bubble in tech stocks, Q1 GDP falling off a cliff to -2.8%, the list goes on and on.
SPY: Long Trade Explained
SPY
- Classic bullish formation
- Our team expects pullback
SUGGESTED TRADE:
Swing Trade
Long SPY
Entry - 562.78
Sl - 550.29
Tp - 583.92
Our Risk - 1%
Start protection of your profits from lower levels
Disclosure: I am part of Trade Nation's Influencer program and receive a monthly fee for using their TradingView charts in my analysis.
❤️ Please, support our work with like & comment! ❤️

First dead cat bounce in reversing Gamma trend fulfilled SPY/SPXAs the chaos of uncertainty reigns: tariffs on and off again, government shut downs, DOGE hunting down government subsidized industries, we can see a trend change from our general upward long term moves from the past year.
Not only this but we have returned to the bearish channel with many attempts to break and turn resistance to support to no avail. How long will it last? First step is to identify a solid exit out of this channel with a confident market support test on the upper channel.
Until then we will follow this trend with dead cat bounces until the dust settles.

Spy... Where we standWeekly chart...
White line represents Primary trend since 08 housing crisis crash
Blue channel represents price action from 2017 -2025
Now pay attention..
You see the yellow trendlines ? Those represent the up trend from covid crash and 2022 crash.
Those were micro uptrends both lasting 2yrs in length..
So now the market has hit a reset switch and I believe we are headed back to the blue trendlines bottom
Like so -
I think over the next week or so if spy recovers 567 then we will have one more squeeze to 585 before the next leg down
My target by the End of Q2 is 490-500.. basically we are back into 2022 price action
Once we hit channel support I expect An accumulation and consolidation before a new multi yr rally to 700
I know this sell off seems random and tariffs related but it's not! Markets top back in Nov/Dec same as 2022.
To show you what I mean by that just look at the other Indexes and tell me is it a coincidence they all hit their decade long resistance at the same time?
Dow Jones target 38,000
NYA/NYSE (More important then spy)
NASDAQ /Ixic
Notice how NASDAQ , Dow, NYA and Spy all hit resistance at the same time? No Trump tariff , No inflation fears, No interest BS just good ol channel trade.. I know perma bulls want up forever but I suggest waiting for Spy 490-510 for the REAL dip buy..
You're going to see a bunch of charts focusing on the weekly hammer printing this week but I'd like to point out that in 2022 we also had week hammers print
I do think Spy can bounce as high as 585 if it can get over 567 next week..

Bulls are holding the line on SPY!Boost and follow for more 🔥
SPY bulls are holding the line at the weekly trend support line from December 2023, for now bulls still have control and this is just a normal pullback, a rally higher to previous and new highs is likely from here in my opinion..
break of 540 on the weekly timeframe and a lot more blood may come.. but for now its looking like people are buying the dip..
if this post gets some likes ill start posting more SPY updates in the future, this is my first one of the year! its been a while

SPY - rally or bounce?Analysis of SPY, a very clear idea of what should happen if the bulls will keep going or the bears are about to attack.

SPY Market Analysis - 14/3/2025
The bears got a tight bear channel down which means persistent selling.
The current leg down is in the form of a 9-bar bear microchannel. There could be sellers above the first pullback.
The selling pressure has been stronger (big bear bars, consecutive bear bars) as compared with the weaker buying pressure (bull bars with no follow-through buying).
The bears want a measured move to around 5400 in the SPX which is just 100 points away fro yesterday's low.
If the market trades higher, the bears expect at least a small second leg sideways to down to retest the current leg low (Mar 13).
The bulls see the move down as climactic.
They hope to get a reversal from a parabolic wedge.
The problem with the bull's case is that the bull bars have no sustained follow-through buying.
They need to create consecutive bull bars trading near their high to convince traders that they are back on control.
The move down has been strong. The market remain Always In Short.
If there is a pullback, odds favor a second leg sideways to down to retest the current leg extreme low (Mar 13).
There could be sellers above the first pullback from the 9-bar bear microchannel.
For now, traders will see if the weekly candlestick will close with a long tail below (like the last 2 weeks).
Or will the market retest yesterday's low and close the week near its low instead?
