SPY CHANNEL JUNSPY ( AMEX:SPY ) – Multi-Timeframe Volatility Channel Analysis
SPY remains inside a well-defined ascending volatility channel across all key timeframes (2h, 4h, Daily, Weekly), confirming a strong bullish structure with clear institutional control.
🔸 Short-Term (2h – 4h):
Consolidating between 590 and 605, with recent rejection from upper bounds.
Multiple PUT positions triggered near 599 and 603, suggesting institutional hedging.
Key support: 590. Below that, watch for downside toward 586 or 576.
🔸 Mid-Term (Daily):
Bullish channel still intact.
As long as price holds above EMA20 at 585.77, the trend remains bullish.
Breakout above 608 opens targets toward 611 (gap) and then 617–620.
🔸 Long-Term (Weekly):
Weekly channel projects targets up to 635 if structure holds.
Strong institutional resistance zone between 607 and 611.
S27 trade ideas

SnP forming right shoulderSupported by bullish indicators such as the Zweig Breadth Thrust and if May closes green, it means 1 year from now the market will have double digit returns every single time.

SPY JUNSPY – June Update
SPY continues to trade within a well-defined ascending channel, with bullish momentum intact.
Price is currently approaching a major resistance at 608, while holding above the key support at 590.
Immediate upside target: 608, followed by potential extension toward the gap fill near 611.
If price fails to hold above 590, downside pressure could lead to a retest of the gaps at 550 and 530, which act as major support zones.
As long as SPY remains above the channel midpoint and above EMA20 (585.77), the bullish structure remains valid.
#SPY #SP500 #Stocks #TechnicalAnalysis #OptionsFlow #Momentum #Support #Resistance
#globaltrade #investment #investing #stockmarket #wealth #realestate #markets #economy #finance #money #forex #trading #price #business #currency #blockchain #crypto #cryptocurrency #airdrop #btc #ethereum #ico #altcoin #cryptonews #Bitcoin #ipo

Overview of the Architectural Components within HFT SystemsArchitectural Components of HFT Systems
Designing an HFT trading system requires a holistic, ultra-low-latency architecture. Rather than a monolithic program, HFT systems are composed of multiple specialized components, each optimized for speed. A typical HFT software architecture can be broken into several layers or modules, including: Market Data Feed Handlers , Trading Signal/Strategy Engine , Order Routing and Execution Manager , Risk Management , and Exchange Connectivity/Gateway . These work in concert to achieve a full “tick-to-trade” pipeline from incoming data to decision to order placement.
Signal Acquisition (Market Data Handling)
Signal acquisition is the front end of any HFT system – it encompasses the intake of raw market data and extraction of usable trading signals from it. HFT firms typically subscribe to direct exchange data feeds for equities, futures, etc., rather than slower consolidated feeds, to get every quote and trade update as fast as possible. The module responsible for this is often called the Market Data Handler (MDH) or feed handler. Its job is to ingest and parse real-time tick data with minimal latency. This includes order book updates (bids, offers, cancels), trades, and other market events.
A feed handler must handle huge message rates. Major equity exchanges can generate hundreds of thousands of updates per second, and an HFT system may track dozens of instruments across multiple venues. The feed handler maintains an internal representation of the limit order book for each market, updating it with each tick. Efficiency in this component is paramount: processing each message should ideally take only a few nanoseconds to microseconds. To achieve this, HFT feed handlers use highly optimized data structures (often arrays or fixed-size buffers rather than tree/linked structures). They avoid dynamic memory allocation – memory is pre-allocated and reused to avoid garbage collection or
malloc/free overhead during trading.
The output of signal acquisition is a live, updated view of market state plus any derived signals. For example, the feed handler might also compute microstructural features on the fly: current top of book, depth imbalance, last trade price, etc., so that the strategy engine can quickly access these. In an HFT system design, this stage is often where most of the data bandwidth is handled. Everything downstream (trading logic, etc.) depends on the feed handler’s ability to keep up without lagging. If your feed handler falls behind (messages queueing up), your signals are stale – a fatal flaw in HFT. Thus, a guiding principle is to make this layer as bare-metal and streamlined as possible: use efficient languages (I personally use C++ for my algorithms), avoid unnecessary copying of data, batch process if possible, and leverage hardware accelerations. In practice, HFT developers profile their feed handling to the nanosecond level and sometimes even design custom memory layouts to ensure order book updates touch the CPU cache optimally.
Order Routing Logic and Smart Order Routers
Once the strategy decides to trade, the system needs to route orders to the appropriate trading venues. In a fragmented market environment (like U.S. equities with 16+ exchanges, or Europe’s multiple exchanges and dark pools), the logic of where and how to send an order can be complex. This is where the Order Manager and Smart Order Router (SOR) components come in . The order manager constructs orders and passes them to a routing algorithm that determines the best execution venue(s) based on factors like price, liquidity, and latency.
A Smart Order Router is essentially an algorithm that optimizes execution across multiple markets. For example, suppose an HFT strategy wants to buy 10000 shares of XYZ stock. Liquidity might be spread across BATS, NYSE, Nasdaq, IEX, etc. The SOR will observe the order books (via the market data module) and decide how to allocate the order: it might simultaneously send 200 shares to Nasdaq, 300 to BATS, 100 to NYSE, etc., to get the best overall price without tipping its hand too much on any single venue. It may also employ
tactics like order-splitting (slice the order into smaller chunks) or spraying many small orders across venues to hide the true size and reduce market impact. SORs can split aggressively or passively depending on the market data and are enhanced to cope with HFT by reducing latency and using smarter venue-selection algorithms. It's worth noting that the BATS exchange is the only exchange that pays takers of a price a commission fee while the rest of the exchanges pay makers for providing liquidity (Yes, HFT algorithms are paid a commission fee to trade while retail traders through there brokers will always pay outsized commission fees to trade).
Important considerations for order routing in HFT include:
Best Price and Liquidity : In the U.S., Regulation NMS requires routing to the venue with the best price (NBBO). SORs ensure if one exchange has the best offer, an outgoing buy order goes there (unless an exception like a dark pool midpoint is desired). Often HFT SORs will simultaneously access multiple venues to ensure they capture liquidity at the top prices before others do. The router must know in real time where the best prices are – hence tight integration with the live market data feed.
Speed vs. Cost Tradeoff : Some venues might have slightly slower access but lower fees or larger size available. The SOR often optimizes a cost function that balances execution speed, price, and fees. For example, an aggressive SOR might sweep all lit venues up to a certain price tolerance immediately (to minimize timing risk), whereas another might try a ping in a dark pool for price improvement if speed is slightly less critical.
Order Types and Venue Characteristics : Each exchange can have unique order types and behaviours (e.g., IEX has a 350µs speed delay; some venues offer midpoint peg orders; others have rebate vs fee). The SOR logic incorporates these. For instance, it might send an order to IEX only if it anticipates the speed bump won’t harm execution, or it might avoid venues where it predicts queue time would be too long. Venue parameters like average latency, fill probability, and fee are often configured so the router “knows” which markets are preferable.
Internalization and Dark Pools : Some HFT firms operate as market makers that also internalize flow or use dark pools. The SOR might include logic to check internal liquidity (e.g., see if an affiliate or internal crossing system has the opposite side) before going out. Or it might ping a dark pool if that could result in a non-marketable order finding a hidden match. This must be balanced against latency – dark pools can introduce slight delays.
Atomicity and Race Conditions : In fragmented markets, a risk is that by the time you reach the second or third venue, the price might have moved. SORs try to simultaneously hit all venues at once when doing a marketable order, to reduce this risk. There’s a notion of a “sweep” – sending orders in parallel such that you grab liquidity across venues within microseconds of each other. Some routers send immediate-or-cancel (IOC) orders to each venue at the same time. The complexity is handling the responses: some might fill, others partial, etc. The order manager then aggregates these fills and determines if more is needed or if it overshot.
From a technical implementation standpoint, the SOR and order manager operate under extreme time pressure in HFT. The time from a strategy’s trade decision to sending out orders must be minimal (often a few microseconds). This means the order routing logic is often implemented in the same process as the strategy to avoid inter-process latency, or even in hardware (some ultra-low latency routers are done on FPGA). The logic may be pre-compiled or use lookup tables to decide routing rather than complex computations in real-time. Some HFT firms also maintain connections to all exchanges simultaneously (via multiple network interface cards) so they can blast out orders concurrently. The architecture might have a thread per exchange gateway, all woken simultaneously to send messages when a signal to trade is given.
Crucially, risk controls are integrated in the order path. No matter how fast, an HFT system must check outgoing orders against limits (e.g., do not send an order that exceeds position limits or fat-finger bounds). These checks have to be extremely fast as well – often implemented as simple arithmetic comparisons in the order manager. Many exchanges also offer exchange-side risk checks and kill-switches now, but relying on those alone could be too slow or late.
In summary, the order routing logic in HFT serves to get the best execution possible across many venues, without sacrificing speed . A well-designed SOR can be a competitive advantage: if your router grabs liquidity 50 microseconds faster than a competitor’s, you avoid missing trades or chasing moving prices (the worst feeling).
Risk Controls and Safeguards
Despite the emphasis on speed and autonomy, HFT systems must enforce strict risk management at all times. The trading algorithms operate at such high speeds that a small bug or unchecked strategy can bankrupt a firm in seconds (notable incidents like the Knight Capital fiasco in 2012, where a faulty algo lost $440 million in 45 minutes). Therefore, robust risk controls are baked into the system architecture to prevent catastrophic errors and ensure compliance with regulations.
Key risk controls in HFT include:
Pre-Trade Risk Checks : Every order that an HFT system attempts to send is typically vetted against a set of limits before it goes out. These checks happen in the order manager or gateway component, and are designed to incur minimal latency (often just a few CPU instructions). Examples: Max Order Size (don’t send orders larger than X shares or contracts), Price Collar (e.g., if an order’s price is far outside the current market, block it – to avoid fat-finger mistakes like $0.01 asks when stock was just trading for $40 flash crash reference ), and Position Limits (don’t buy more than Y shares in total or more than Z in a single name). For HFT firms registered as market makers, regulatory obligations might also require certain limits (like not exceeding aggregate volume limits without alerts). These checks act as circuit-breakers for the algo’s behaviour.
Credit/Capital Limits : The system tracks its current usage of capital and ensures it doesn’t exceed set thresholds. For example, a running sum of gross and net exposure is updated with each fill. If the net long or short in any instrument exceeds a predefined limit, the system should halt further orders in that direction. Similarly, many firms have a daily loss limit – if cumulative P&L goes below a threshold, the system will cut off trading to prevent a death spiral. These are often hierarchical (per strategy limits, product limits, and firm-wide limits).
Kill Switches : A kill-switch is an emergency stop that can flatten positions and cancel all orders instantly if something goes wrong. This can be triggered automatically by the software (if it detects, say, an unusual burst of orders or loss), or manually by risk managers. Modern HFT platforms implement kill-switches at multiple levels – software, network (some use specialized network devices that can block outgoing traffic if a message with a kill command is sent), and via third-party services (exchanges themselves often have kill-switch APIs that brokers/HFTs can call to cancel all their orders on that exchange). The key is speed and reliability: a kill command should propagate faster than the algo can do harm. For perspective, after Knight Capital’s incident, U.S. regulators mandated broker-dealers (who often host HFT servers) to have risk controls including kill-switch functionality to prevent “errant algorithms” from disrupting markets.
Realtime Monitoring and Alerts : Although HFT is automated, most firms have a monitoring dashboard that shows key stats: positions, P&L, order rates, latency, systems health. If any metric goes out of bounds (e.g., order send rate spikes abnormally, or one strategy’s P&L suddenly plunges), the system can generate alerts or auto-disable that strategy. In some setups, separate shadow processes compute these metrics so as not to slow the main trading loop.
Exchange-Level Protections : HFT systems also take advantage of exchange-provided risk features. For example, many exchanges allow you to set fat-finger limits on their side, or provide cancel-on-disconnect (so if your server disconnects, all your orders are automatically canceled to avoid uncontrolled risk). Some markets have volatility guards – e.g., futures exchanges have stop logic if a trader executes a mass of trades that move price too far, the exchange might reject or halt trading. HFT firms configure these where possible. Additionally, HFT algorithms often incorporate logic to react to exchange trading halts or sudden illiquidity – if an exchange goes down or a symbol is halted, the system should freeze activity in related instruments.
Testing and Safeguards in Code : On the development side, HFT firms invest in simulation and testing frameworks to catch issues before deployment. Strategies are tested on historical data and in sandbox environments. Many firms also utilize a “guarded release” approach – initially running a new algo on small size limits and monitoring it closely. Self-calibration can also be seen as a risk measure: the algorithm might adjust its trading frequency or size down if it observes increasing slippage or error rates, thereby scaling back risk in volatile conditions.
Risk management in HFT must balance two opposing forces: safety vs. speed . Too many checks or overly conservative limits could slow down the system or reduce profits. However, not having adequate checks can be fatal. The best practice is to make checks as computationally cheap as possible and to set sensible thresholds that stop truly abnormal behaviour but do not interfere with normal operation. For example, a max order size of, say, 50,000 shares might never be hit during normal scalping activity, but would catch a wild runaway order. Or a per-second order rate limit might be set just above the typical peak – if the algo goes haywire and blasts orders 10x faster than normal, the limiter kicks in.
A concrete illustration of risk control importance: During the Flash Crash (2010) , some HFT firms’ algorithms exacerbated the crash by continuing to trade or suddenly withdrawing. In its aftermath, many firms implemented stronger guardrails such as “trading pause triggers” – if market volatility exceeds a certain threshold or if the market data feed becomes inconsistent (a known sign of trouble), their algos will automatically reduce activity or shut off . This ensures they don’t amplify a cascade. As another example, consider momentum ignition or other manipulative patterns – a relatively well-behaved HFT firm wants to avoid even accidentally doing something that looks like manipulation (their's a fine line between legal and illegal). So their algorithms might have logic like: “If we have layered 3 or more orders and none get filled, don’t keep layering” or “Avoid cancelling and flipping sides more than X times in Y seconds.” These are internal policies that also serve as risk/compliance controls.
In summary, risk controls are an integral architectural layer of HFT systems, often implemented as the Risk Manager module working closely with the order manager . They enforce trading limits, monitor exposure, and can intervene (or shut down trading) when predefined conditions trip. The ultimate goal is to trade another day – an HFT firm can’t afford a single day of uncontrolled trading that could wipe it out. As Hemang Dave on Linkedin put it in his HFT Architecture article : “While speed is important, robustness, risk management, and system reliability are equally critical. Over-optimizing without proper controls can lead to catastrophic losses.”.
Execution Logic and Fill Handling
The execution logic of an HFT algorithm governs how it actually places and manages orders to fulfill a desired trade. This is distinct from the high-level “strategy” decision (e.g., decide to go long 2000 shares) – execution logic is the tactical set of rules that achieve that position in the market, given the microstructure. In other words, it’s the layer that turns a trading intention into specific orders, and handles the outcomes (fills or lack thereof).
Key aspects of execution logic include:
Order Type Selection : Modern markets offer a variety of order types (limit, market, IOC, FOK, midpoint peg, discretion, etc.). HFT algos carefully choose order types that suit their needs. For passive market making, they’ll use limit orders, possibly with pegging (like pegging to midpoint or best bid with some offset) to systematically join the spread. For urgent liquidity, they might use IOC (Immediate-Or-Cancel) orders to avoid posting. Some HFT strategies exploit special order types – e.g., using hidden or iceberg orders if they want to conceal size, or using Add-liquidity-only orders to ensure they get maker rebates or queue priority. An algorithm’s execution module might have logic like: “If spread > X and volatility low, place a passive bid; if spread is tight or we urgently need to exit, send a market order (taker).” Also, certain venues have unique order types that HFTs leverage – e.g., Nasdaq’s Midpoint Peg, IEX’s D-Limit (pegged with protection), etc. Choosing when to use these is part of execution logic.
Order Placement and Cancellation Strategy : Execution logic often involves deciding the price level and timing for placing orders, as well as when to cancel or replace them. For example, a market making algo might place a buy limit order one tick below the best bid to improve queue position but not cross the spread. If it’s not filled within, say, 50 milliseconds, maybe it moves the order up or cancels if conditions changed. HFT execution often entails frequent order cancellations – in fact, high cancellation rates (often >90%) are normal as algos continuously adjust their quotes. A fill (execution) might trigger immediate subsequent actions: e.g., if a buy order got partially filled for 100 shares, the algo might cancel the remainder and reposition, or immediately place a sell order to take profit if it was a very short-term scalp. Execution logic is like an “inner control loop” that constantly reacts to feedback: fills, changes in market prices, etc.
Fill Handling and Bookkeeping : When an order (or part of it) executes, the system updates its internal state: position changes, cash balance, etc. The execution module ensures all these updates happen atomically and correctly – this is important for risk and for subsequent decisions. For instance, if an HFT strategy sent out 10 orders and 3 get filled, it needs to recognize that it now has that inventory and perhaps cancel the other 7 if they’re no longer needed.
Order Book Queue Management : Especially for passive execution, HFT cares about queue position. Execution logic might try to infer how far back in line its order is at a given price. This can be done by estimating how many shares are ahead (from order book data when the order was placed minus any intervening trades). Some algorithms will cancel and re-post if they suspect they are too far back to get a fill in time. For example, an algo might only want to sit in queue if it’s in the top 10% of the queue, otherwise it’s wasting opportunity and could instead try a different approach. This leads to behaviours like order layering and replacing – e.g., sending multiple small orders sequentially to hop closer to the front as other orders cancel, or canceling and re-submitting slightly revised orders to maintain priority. However, note that excessive cancel/replace can cross into “layering” if done with deceptive intent (illegal), so algos tune this carefully for legitimate purposes.
Trade Execution Algorithms (Execution Algos) : Within the HFT context, sometimes HFT firms implement their own mini execution algos akin to how brokers/traders use VWAP, TWAP, etc., but on a much faster scale. For instance, if an HFT strategy wants to acquire a large position, it might stealthily do so via a series of small orders to minimize impact – effectively an intra-second TWAP. Another scenario: in futures markets, if an HFT needs to roll over or unwind a position quickly without spooking the book, it may randomize its order size/timing a bit to appear less predictable. These are execution tactics that are part of the algorithm’s design. Some HFT systems separate the logic: the “decision engine” says what to do (buy X amount), and an “execution engine” module decides how to do it optimally (slice into N pieces, stagger them, etc.).
Smart Order Cancellation on External Events : Good execution logic is very responsive to context changes . For example, if an algo has a resting buy order and suddenly the market price starts dropping rapidly, it might be prudent to cancel that order to avoid catching a falling knife (unless the strategy explicitly wants to buy the dip). Or if news comes out or a related instrument moves sharply, the execution logic might adjust all working orders. HFT systems implement cancel-on-condition rules: if best bid/ask moves away from our order by more than X, cancel it; if our order is at risk of trading through (e.g., our buy is now above the new best ask due to a flicker), definitely cancel to avoid bad fills. These ensure the algo’s orders don’t get “hung” in dangerous positions.
Handling Partial Fills and Remainders : HFT algos rarely show their full hand if it’s sizeable – they tend to get filled in small chunks. The execution logic deals with the case where, say, you wanted 1000 units but only got 300 on the first attempt. It can then reassess: do we still want the remaining 700? If yes, what’s the next step – try again at the same price? move price? try another venue? Or sometimes a partial fill on one side triggers an action on the other side – e.g., a pairs trading strategy got half of its long leg filled, it might start filling the short leg proportionally to stay balanced.
In essence, the execution and fill logic is where the market microstructure knowledge is hard-coded. This part of the system embodies all the if-then rules and algorithms that a skilled trader might manually use, but at machine speed. It’s also the part that interacts directly with the exchange via the Exchange Gateway (the software that formats orders to exchange API). An HFT architecture’s components include an Order Manager linked to an Exchange Connection/Gateway , which together handle order placement and acknowledgments. The exchange gateway usually provides confirmation of order receipt
and reports fills back; the execution logic must handle these in real-time.
Notably, HFT execution often assumes non-blocking, asynchronous operation: the system can send dozens of orders without waiting for each fill confirm – it keeps track of outstanding orders via IDs. This means concurrency issues need to be handled (like two orders filling at once), and careful state management is required. Modern languages and libraries that allow lock-free programming (e.g., using atomic operations for counters) are often employed here to avoid any delays from thread synchronization when updating fills or positions.
Feedback Loops and Self-Calibration
High-frequency trading algorithms operate in a dynamic environment where market conditions can change in milliseconds. As such, effective HFT systems incorporate feedback loops and self-calibration mechanisms that allow them to adjust their parameters on the fly. This can be thought of as the HFT equivalent of control systems in engineering: the strategy monitors its own performance and the market’s response, and tunes itself for optimal performance or to avoid problems.
Some examples of feedback and self-correction in HFT algorithm design:
Adaptive Order Placement : An HFT strategy might start by posting at a certain rate or spread, but if it observes that its orders are not getting filled at the expected rate (perhaps because competition increased or volatility changed), it can adjust. For instance, a market maker algo might widen its quotes if it starts getting too many toxic fills (losing money on immediate adverse price moves), which indicates adverse selection. Conversely, if it’s not getting filled at all (perhaps being outcompeted), it might tighten quotes or increase size. This adaptation can occur on very short timescales – e.g., “if 100 successive order placements resulted in zero fills, maybe our price is off; adjust price or size by a small epsilon.”
Latency and Queue Position Feedback : As mentioned earlier, HFT algos estimate their queue position. They also measure how long it typically takes to get a fill at a given position. If an algo notices that every time it’s, say, 5th in line it almost never gets filled before the price moves away, it might incorporate that feedback to only post when it expects to be within the top 3. Some advanced strategies use learning algorithms to predict fill probabilities based on current order book state and recent history, and then adjust their posting behavioir accordingly (this borders on machine learning applied to microstructure).
Profit and Loss (P&L) Monitoring : An HFT strategy usually has real-time P&L computation. If the strategy’s P&L starts consistently trending negative under certain conditions, that’s a feedback signal. For example, maybe the strategy loses money in the lunchtime period when liquidity is thin – a self-calibrating approach would be to automatically scale down trading during those hours. Some HFT systems will dynamically turn off or on certain sub-strategies based on recent performance. This is akin to regime detection: the system figures out “the current market regime is one where my strategy doesn’t do well, so I’ll trade less aggressively until conditions improve.”
Parameter Tuning : Many strategies have parameters (thresholds, aggression levels, etc.). While these are often initially set via offline optimization, HFT systems can also tweak them in production. For instance, a statistical arbitrage strategy might have a parameter for how wide a divergence needs to be to trade. If it finds that signals are too sparse, it could lower the threshold to get more trades (but risking more noise). Alternatively, if it’s getting too many false signals (trades that revert to losses), it might tighten the threshold. Some firms use real-time analytics to estimate the short-term volatility or noise level and adjust strategy parameters accordingly – essentially implementing a volatility filter . For example, a pairs trading algo might widen its band during high volatility so it doesn’t trade on movements that are just random noise.
Reinforcement Learning Elements : A cutting-edge approach is to use reinforcement learning agents that continuously learn from market interaction. While full RL in live trading is still experimental, certain elements are used. For example, a market making algorithm can be framed as an RL problem where the agent observes state (order book, positions) and takes actions (place/ cancel orders) with the goal of maximizing profit minus inventory risk. Such an agent would inherently use feedback (rewards) to adjust its policy. Recent research indeed has applied deep reinforcement learning to high-frequency market making, training algorithms that adjust quoting strategies based on observed reward signals . In live deployment, one might not have the RL learn from scratch, but an algorithm could have multiple modes or sub-policies and learn which mode works best in the current market environment (explore/exploit on a meta-level).
Execution Feedback : Execution algos often measure slippage – the difference between expected execution price and actual. If slippage starts increasing, the algo might decide to be less aggressive or trade smaller clips. For instance, if an algo is breaking a large order into 500-share lots but sees that every lot is moving the price, it might drop to 200-share lots. This is a feedback loop using market impact observations to calibrate order size.
Systematic Self-Test : Some HFT systems periodically run heartbeat orders – tiny, non-risky orders – to gauge latency or market responsiveness. For example, sending a 1-lot order in a quiet instrument to confirm that the trading loop is functioning within normal latency. If the return trip (order send to acknowledgment) is slower than usual, perhaps there’s a system issue and the system might reduce trading until that’s resolved (this overlaps with system health monitoring, but it’s a feedback to the algorithm to possibly halt if infra is lagging).
Implementing feedback loops requires careful design to avoid oscillation or unintended consequences. You don’t want your strategy over-correcting (e.g., widening spreads a lot at the first loss and then missing out on profit opportunities). Typically, designers use smoothing or incremental adjustments and perhaps a floor/ceiling on parameters. The adjustments might also be asymmetric: if things are bad, cut risk quickly; if things improve, scale up slowly (an analogy to how traders might manage risk).
A good example of self-calibration in a real system is an adaptive market-making model that monitors realized volatility and order flow imbalance . If volatility spikes, the model widens quotes (less inventory, more spread). If order flow becomes one-sided (indicating a trend), the model might skew quotes or reduce size on the losing side to avoid getting run over. Once volatility normalizes, it narrows back. All of this can be automatic.
From an implementation perspective, these feedback computations run in parallel with trading. They might operate on aggregated data over seconds or minutes (which in HFT is a long horizon) and then feed new parameter values into the fast trading loop. In highly sophisticated outfits, a meta-algorithm could even temporarily turn off a strategy if it gauges that the strategy is performing significantly worse than expected in current conditions – like a circuit breaker on strategy performance.
In summary, feedback loops and self-calibration make HFT algorithms more robust and adaptive . Markets aren’t static, and an algo that was calibrated on last month’s conditions might falter today if nothing is adjusted. By incorporating real-time performance feedback, HFT systems keep themselves tuned close to the optimal operating point. It’s analogous to a high-performance engine with sensors and an ECU that adjusts timing and fuel mixture on the fly for maximal performance and safety. This adaptiveness is one reason HFT firms invest in not just speed, but smarter algorithms – the ability to learn and adjust faster than competitors can be even more important than raw speed in the long run.
Market Microstructure-Aware Design
Market microstructure – the fine-grained rules and mechanics of how orders interact in an exchange – plays a pivotal role in HFT algorithm design. A successful HFT algorithm is deeply microstructure-aware , meaning it exploits the specific workings of the trading venue: order priority rules, fee structures, available order types, tick sizes, etc.
Features that HFT algorithms leverage:
Order Priority (Price/Time Priority) : Most order matching engines give priority to the best price, and among orders at the same price, to the earliest order (first-in, first-out queue). HFT algos thus crave being at the front of the queue when they post limit orders. Queue position management is almost an art form in HFT. Strategies will carefully decide which price level to post at – if you post at the best bid, you join the back of the queue; if you improve by one tick, you become first in line at a new best bid (but now you’re crossing a tick and potentially giving up edge). HFTs often improve the quote by the minimal increment to get priority when they sense it’s safe to do so. Some strategies even rotate their orders: if they’ve been sitting and not getting filled (meaning they’re deep in queue and others are ahead getting filled), they might cancel and re-enter the order, effectively moving to the back but resetting the time (this would be counterproductive normally – you lose priority – but if you were so far back that chances of fill were near zero, resetting might not hurt, and could in fact place you ahead of other slow market participants who haven’t updated their orders). However, exchanges have made some rules to discourage frivolous queue resets (e.g., certain markets
penalize excessive order updates).
Maker-Taker Fees and Rebates : Many equity venues operate on a maker-taker model (liquidity adders get a rebate, takers pay a fee) or the inverse (taker-maker on some venues like BATS). HFT algos absolutely factor in these economics. A strategy might be willing to sell at a slightly lower price on an exchange that gives a high rebate because that rebate offsets the price difference. Or an arbitrage strategy might simultaneously post on multiple venues aiming to collect rebates while capturing a spread. Part of microstructure-aware design is routing orders in a way that maximizes net after-fee P&L. For example, if both NASDAQ and NYSE have the same price, an HFT might prefer the one with the better rebate for adding liquidity – but only if the latency and fill likelihood are comparable. Some sophisticated strategies also rebate arbitrage , where the goal is less about price difference and more about capturing the rebate by providing liquidity and then hedging on another venue.
Tick Size Constraints : Each market has a minimum price increment (tick). HFT algos often exploit tick dynamics. In a stock with a relatively large tick (say $0.01) and low price volatility, the inside quotes tend to stick at a level until a trade clears them out. HFT market makers in such stocks can earn the full spread (e.g., buy at $10.00, sell at $10.01) because the tick is wide relative to true value variation. Conversely, in futures or FX where ticks are finer, spreads can be one tick most of the time, so strategies might compete on speed to earn even a fraction of a tick. Queue dynamics are also tick-dependent: if tick size is large, being second in queue still guarantees the same price, so queue position is crucial. If tick size is extremely fine relative to volatility, you might see price flipping frequently by a tick, in which case being at the front is less important than reacting to price changes. HFT algos adapt to this – for instance, knowing whether to join an existing price level or to establish a new one depends on tick size and likelihood of price movement.
Order Types and Exchange-Specific Features : Exchanges offer various order types that HFT algos use to their advantage:
Midpoint Pegs : e.g., exchanges allow orders pegged to mid-price, which might get better fills if there’s hidden liquidity crossing at midpoint. HFTs providing midpoint liquidity might capture half the spread consistently, but they must predict when midpoint orders will execute (often against hidden or IOC liquidity).
Iceberg Orders : These display only a portion of their size. HFT can either use them (if they want to hide size) or detect others’ icebergs (for example, seeing the same price level refresh repeatedly after partial fills is a sign of an iceberg – HFT algos detect this and then may try to execute against it fully by repeatedly taking the displayed part until the iceberg is exhausted).
Discretionary and Conditional Orders : Some venues have order types that can automatically adjust (e.g., IEX’s D-Limit which pegs and can move with the CQI signal). HFT algos must understand these – both to use them and to anticipate their effect on the order book.
Market-on-Close, Opening Auction orders : HFT firms also play around auctions (opens/closes) – placing orders that participate in the opening or closing auction when that suits the strategy (especially if there’s an imbalance they detect from imbalance feeds). Auction dynamics are different (one large batch match), so algos might have separate logic for that.
Latency Arbitrage Considerations (Protected Quotes) : In the U.S., Reg NMS ensures that the best quotes are “protected” – you can’t trade through them. HFT algos exploit this by cross-market arbitrage : e.g., if they see Nasdaq about to update its price, they race to other exchanges to trade before those exchanges update their NBBO. The microstructure angle
is that the securities information processor (SIP), which publishes consolidated NBBO, is slower than direct feeds, giving an edge to those with direct feeds who can act before the NBBO officially moves. Many HFT strategies are built around direct-feed vs SIP delays, essentially microstructure quirks of how information disseminates. Some strategies also anticipate which venue’s quote will update next – e.g., if EDGX executes a big trade that clears out liquidity, it will drop from the NBBO, and HFT could quickly adjust quotes elsewhere in anticipation.
Exchange Latency and Queue Modeling : Each exchange might have slightly different matching engine latency and mechanics for queuing incoming orders. HFT firms empirically measure how long it takes to get a response from each venue and even how the matching engine processes batch arrivals (e.g., if multiple orders arrive in the same millisecond, does the exchange randomize them or queue by receive time?). Some markets (like certain dark pools or IEX with speed bump) intentionally randomize or delay, which HFT microstructure-aware algos account for – e.g., they know they can’t race someone on IEX due to the 350µs delay, so they adjust their arbitrage logic accordingly (maybe avoiding IEX in races, or using IEX only for certain order types like D-Peg that rely on their signal).
Market Structure Differences Across Asset Classes : HFT algorithms are tailored to the specifics of each market type. For instance, equity markets have lit order books and dark pools – HFTs may run strategies that ping dark pools (liquidity detection as discussed) and simultaneously manage lit quotes. Futures markets often have a single central limit order book per contract (no fragmentation like equities), but they have different fee structures and often different priority rules (e.g., CME uses price-time, Eurex uses price-pro rata for some products, etc.). An HFT algo on a pro-rata matching market (common in options or some futures) will use different tactics – e.g., posting larger size can get a proportional fill even if not first in line. So if the algorithm is trading such a product, it might post more size than it actually wants, expecting to cancel the remainder after partial fill (this can be tricky as it edges towards anti-gaming rules – exchanges monitor that too).
Adverse Selection Metrics : HFT firms often develop quantitative measures of adverse selection in each venue or for each order type. For example, how often does a posted order that gets filled end up being a loser (price moves against it right after)? They might find that passive fills on Venue A are more toxic than Venue B, perhaps because Venue A is where informed traders aggregate. Then the microstructure-aware move is to post on B more than A , and maybe use A more for aggressive orders only. This kind of venue analysis is a microstructure-informed allocation of trading.
In essence, market microstructure-aware design means knowing the game’s rules intimately and designing your playbook around them. HFT algorithms are engineered with the details of each target market in mind – nothing is generic. The code often has per-exchange constants and behaviour toggles. For example, an equity algo might have a table of “exchange characteristics” (rebate, latency, queue estimate model, etc.) that it references when deciding routing or quoting. It will exploit any deterministic rule to its advantage: e.g., if an exchange randomizes queue priority for orders arriving in the same time bucket (some dark pools
do), a strategy might try to always slightly stagger its multiple orders to avoid being in the same batch, thereby potentially getting better priority.
A case study of microstructure exploitation is how some HFTs handled dark pools pre-2014 : They realized many dark pools were crossing at midpoint without price-time priority – meaning if you send a ping of 100 shares and there’s a 10000 share order resting, you’d get a fill and the big order would shrink, but nobody sees that. HFTs would sequentially ping multiple dark pools with small orders, detect liquidity, then potentially trade more once found. When regulators began cracking down and dark pools changed rules (like minimum order sizes or ping frequency limits), those strategies had to change. This shows how microstructure is not static – exchanges tweak rules and HFT algos must adapt quickly.
To conclude, microstructure-aware design is the heart of HFT advantage . Speed is the muscle, but microstructure knowledge is the brain. Whether it’s managing queue position, choosing the perfect order type, arbitraging minute cross-venue rule differences, or leveraging each exchange’s unique features, HFT algorithms derive much of their edge from being designed with these microscopic details in mind . That is why many HFT firms actively participate in exchange advisory committees or read every new rule filing – a tiny
rule change (say a new pegged order type, or a new matching engine update) can obsolete some strategies or enable new ones. The algorithms must continually evolve alongside the market’s microstructure.

BREAKING $SPY Ultra Rare Not seen since 2023 Holy GrailBREAKING AMEX:SPY Ultra Rare Not seen since 2023 Holy Grail
Inside week has broken out given last week!
I loaded in 45 contracts up 6 figures call me crazy but I want 7
All will be alerted here NO charge Low risk setups only
All I ask is drop a 👍

Stock Market Forecast | TSLA NVDA AAPL AMZN META MSFTStock Market Forecast | CME_MINI:NQ1! CME_MINI:ES1! QQQ AMEX:SPY
Mag 7 Forecast | NASDAQ:TSLA NASDAQ:NVDA AAPL AMZN META MSFT GOOG

SPY Swing Trade Plan – 2025-06-06📈 SPY Swing Trade Plan – 2025-06-06
Bias: Moderately Bullish
Timeframe: 3–4 weeks
Catalysts: Strong institutional flows, trade talk optimism, solid jobs report
Trade Type: Long equity position
🧠 Model Summary Table
Model Bias Entry Stop Loss Take Profit Holding Period Confidence
DS Moderately Bullish $600.02 $595.54 $618.02 3 weeks 65%
LM Moderately Bullish $598.50 $586.70 $616–618 3–4 weeks 75%
GK Strongly Bullish $600.02 $592.00 $610.00 4 weeks 72%
GM Moderately Bullish ~$600.50 $587.50 $627.50 3–4 weeks 70%
CD Moderately Bullish $600–600.50 $585.00 $620 / $635 3–4 weeks 72%
✅ Consensus: SPY is in a bullish trend across timeframes
⚠️ Disagreements: MACD momentum and entry/pullback levels
🔍 Technical & Sentiment Summary
Trend: SPY above 10/50/200 EMAs on all models
RSI: 60–61 → bullish but not overbought
MACD: Mostly positive, DS cautious on daily histogram
Support Levels: $591.06, $595.54, $597.26
Resistance Zones: $600.83, $605.21, $610
VIX: 17.6 (declining), supports risk-on sentiment
News: Trade talk optimism and strong jobs data fueling momentum
✅ Final Trade Setup
Parameter Value
Instrument SPY
Strategy LONG
Entry Price $600.00
Stop Loss $588.00
Take Profit $625.00
Position Size 83 shares (1% risk on $100K)
Entry Timing At market open
Confidence 70%
💡 Rationale: Aligned bullish signals across timeframes, falling VIX, and strong macro sentiment favor a trend continuation move toward $625. Position sized for conservative risk management.
⚠️ Key Risks & Considerations
MACD divergence could signal near-term stall
Resistance zone at $605 may act as a cap
Macro volatility: Strong jobs could raise rate expectations
VIX Watch: A spike above 20 could reverse market trend
Exit Protocol: Consider closing if SPY closes below the 10-day EMA (~$591)
📊 TRADE DETAILS SNAPSHOT
🎯 Instrument: SPY
📈 Direction: LONG
💰 Entry Price: 600.0
🛑 Stop Loss: 588.0
🎯 Take Profit: 625.0
📊 Size: 83 shares
💪 Confidence: 70%
⏰ Entry Timing: Open
S&P 500 in EUR - SHORT- in 15 days timeline
- broke the trendline that comes from 2020 to the downside
- retested and could not go above
- may try again and if fails again, then 25% correction likely

SPY: Swing Trading & Technical Analysis
Balance of buyers and sellers on the SPY pair, that is best felt when all the timeframes are analyzed properly is shifting in favor of the sellers, therefore is it only natural that we go short on the pair.
Disclosure: I am part of Trade Nation's Influencer program and receive a monthly fee for using their TradingView charts in my analysis.
❤️ Please, support our work with like & comment! ❤️

Warren Buffett's Approach to Long-Term Wealth BuildingUnderstanding Value Investing: Warren Buffett's Educational Approach to Long-Term Wealth Building
Learn the educational principles behind value investing and dollar-cost averaging strategies, based on historical market data and Warren Buffett's documented investment philosophy.
---
Introduction: The Million-Dollar Question Every Investor Asks
Warren Buffett—the Oracle of Omaha—has consistently advocated that index fund investing provides a simple, educational approach to long-term wealth building for most investors.
His famous 2007 bet against hedge funds proved this principle in dramatic fashion: Buffett wagered $1 million that a basic S&P 500 index fund would outperform a collection of hedge funds over 10 years. He crushed them. The S&P 500 returned 7.1% annually while the hedge funds averaged just 2.2%.
Today, we'll explore the educational principles behind this approach—examining historical data, mathematical concepts, and implementation strategies for learning purposes.
---
Part 1: Understanding Value Investing for Modern Markets
Value investing isn't about finding the next GameStop or Tesla. It's about buying quality assets at attractive prices and holding them for compound growth .
For beginners, this translates to:
Broad Market Exposure: Own a cross-section of businesses through low-cost index funds
Long-term Perspective: Think decades, not months
Disciplined Approach: Systematic investing regardless of market noise
"Time is the friend of the wonderful business, the enemy of the mediocre." - Warren Buffett
Real-World Application:
Instead of trying to pick between NASDAQ:AAPL , NASDAQ:MSFT , or NASDAQ:GOOGL , you simply buy AMEX:SPY (SPDR S&P 500 ETF) and own pieces of all 500 companies automatically.
---
Part 2: Dollar-Cost Averaging - Your Secret Weapon Against Market Timing
The Problem: Everyone tries to time the market. Studies show that even professional investors get this wrong 70% of the time.
The Solution: Dollar-Cost Averaging (DCA) eliminates timing risk entirely.
How DCA Works:
Decide on your total investment amount (e.g., $24,000)
Split it into equal parts (e.g., 12 months = $2,000/month)
Invest the same amount on the same day each month
Ignore market fluctuations completely
DCA in Action - Real Example:
Let's say you started DCA into AMEX:SPY in January 2022 (right before the bear market):
January 2022: AMEX:SPY at $450 → You buy $1,000 worth (2.22 shares)
June 2022: AMEX:SPY at $380 → You buy $1,000 worth (2.63 shares)
December 2022: AMEX:SPY at $385 → You buy $1,000 worth (2.60 shares)
Result: Your average cost per share was $405, significantly better than the $450 you would have paid with a lump sum in January.
---
Part 3: The Mathematics of Wealth Creation
Here's where value investing gets exciting. Let's run the actual numbers using historical S&P 500 returns:
Historical Performance:
- Average Annual Return: 10.3% (1957-2023)
- Inflation-Adjusted: ~6-7% real returns
- Conservative Estimate: 8% for planning purposes
Scenario 1: The $24K Start
Initial Investment: $24,000 | Annual Addition: $2,400 | Return: 8%
Calculation Summary:
- Initial Investment: $24,000
- Annual Contribution: $2,400 ($200/month)
- Expected Return: 8%
- Time Period: 20 years
Results:
- Year 10 Balance: $86,581
- Year 20 Balance: $221,692
- Total Contributed: $72,000
- Investment Gains: $149,692
Scenario 2: The Aggressive Investor
Initial Investment: $60,000 | Annual Addition: $6,000 | Return: 10%
Historical example after 20 years: $747,300
- Total Contributed: $180,000
- Calculated Investment Gains: $567,300
Educational Insight on Compound Returns:
This historical example illustrates how 2% higher returns (10% vs 8%) could dramatically impact long-term outcomes. This is why even small differences in return rates can create life-changing wealth over decades. The mathematics of compound growth are both simple and incredibly powerful.
---
Part 4: Investing vs. Savings - The Shocking Truth
Let's compare the same contributions invested in stocks vs. a high-yield savings account:
20-Year Comparison:
- Stock Investment (8% return): $221,692
- High-Yield Savings (5% return): $143,037
- Difference: $78,655 (55% more wealth!)
"Compound interest is the eighth wonder of the world. He who understands it, earns it... he who doesn't, pays it." - Often attributed to Einstein
Key Insight: That extra 3% annual return created an additional $78,655 over 20 years. Over 30-40 years, this difference becomes truly life-changing.
📍 Global Savings Reality - The Investment Advantage Worldwide:
The power of index fund investing becomes even more dramatic when we examine savings rates around the world. Here's how the same $24K initial + $2,400 annual investment compares globally:
🇯🇵 Japan (0.5% savings):
- Stock Investment: $221,692
- Savings Account: $76,868
- Advantage: $144,824 (188% more wealth)
🇪🇺 Western Europe Average (3% savings):
- Stock Investment: $221,692
- Savings Account: $107,834
- Advantage: $113,858 (106% more wealth)
🇬🇷 Greece/Southern Europe (2% savings):
- Stock Investment: $221,692
- Savings Account: $93,975
- Advantage: $127,717 (136% more wealth)
🇰🇷 South Korea (2.5% savings):
- Stock Investment: $221,692
- Savings Account: $100,634
- Advantage: $121,058 (120% more wealth)
💡 The Global Lesson:
The lower your country's savings rates, the MORE dramatic the advantage of global index fund investing becomes. For investors in countries with minimal savings returns, staying in cash is essentially guaranteed wealth destruction when compared to broad market investing.
This is exactly why Warren Buffett's advice transcends borders - mathematical principles of compound growth work the same whether you're in New York, London, or Athens.
Note: Savings rates shown are approximate regional averages and may vary by institution and current market conditions. Always check current rates in your specific market for precise calculations.
---
Part 5: Building Your Value Investing Portfolio
Core Holdings (80% of portfolio):
AMEX:SPY - S&P 500 ETF (Large-cap US stocks)
AMEX:VTI - Total Stock Market ETF (Broader US exposure)
LSE:VUAA - S&P 500 UCITS Accumulating (Tax-efficient for international investors)
Satellite Holdings (20% of portfolio):
NASDAQ:QQQ - Technology-focused (Higher growth potential)
AMEX:VYM - Dividend-focused (Income generation)
NYSE:BRK.B - Berkshire Hathaway (Value investing & diversification)
---
Part 6: Implementation Strategy - Your Action Plan
Month 1: Foundation
Open a brokerage account (research low-cost brokers available in your region)
Set up automatic transfers from your bank
Buy your first AMEX:SPY shares
💡 Broker Selection Considerations:
Traditional Brokers: Interactive Brokers, Fidelity, Vanguard, Schwab
Digital Platforms: Revolut, Trading 212, eToro (check availability in your country)
Key Factors: Low fees, ETF access, automatic investing features, regulatory protection
Research: Compare costs and features for your specific location/needs
Month 2-12: Execution
Invest the same amount on the same day each month
Ignore market news and volatility
Track your progress in a simple spreadsheet
Year 2+: Optimization
Increase contributions with salary increases
Consider additional core holdings like LSE:VUAA for tax efficiency
Consider tax-loss harvesting opportunities
Visualizing Your DCA Strategy
Understanding DCA concepts is easier when you can visualize the results. TradingView offers various tools to help you understand investment strategies, including DCA tracking indicators like the DCA Investment Tracker Pro which help visualize long-term investment concepts.
🎯 Key Visualization Features:
These types of tools typically help visualize:
Historical Analysis: How your strategy would have performed using real market data
Growth Projections: Educational scenarios showing potential long-term outcomes
Performance Comparison: Comparing actual vs theoretical DCA performance
Volatility Understanding: How different stocks behave with DCA over time
📊 Real-World Examples from Live Users:
Stable Index Investing Success:
AMEX:SPY (S&P 500) Example: $60K initial + $500/month starting 2020. The indicator shows SPY's historical 10%+ returns, demonstrating how consistent broad market investing builds wealth over time. Notice the smooth theoretical growth line vs actual performance tracking.
Value Investing Approach:
NYSE:BRK.B (Berkshire Hathaway): Warren Buffett's legendary performance through DCA lens. The indicator demonstrates how quality value companies compound wealth over decades. Lower volatility = standard CAGR calculations used.
High-Volatility Stock Management:
NASDAQ:NVDA (NVIDIA): Shows smart volatility detection in action. NVIDIA's explosive AI boom creates extreme years that trigger automatic switch to "Median (High Vol): 50%" calculations for conservative projections, protecting against unrealistic future estimates.
Tech Stock Long-Term Analysis:
NASDAQ:META (Meta Platforms): Despite being a tech stock and experiencing the 2022 crash, META's 10-year history shows consistent enough performance (23.98% CAGR) that volatility detection doesn't trigger. Standard CAGR calculations demonstrate stable long-term growth.
⚡ Educational Application:
When using visualization tools on TradingView:
Select Your Asset: Choose the stock/ETF you want to analyze (like AMEX:SPY )
Input Parameters: Enter your investment amounts and time periods
Study Historical Data: See how your strategy would have performed in real markets
Understand Projections: Learn from educational growth scenarios
🎓 Educational Benefits:
This tool helps you understand:
- How compound growth actually works in real markets
- The difference between volatile and stable investment returns
- Why consistent DCA often outperforms timing strategies
- How your current performance compares to historical market patterns
- The visual power of long-term wealth building
As Warren Buffett said: "Someone's sitting in the shade today because someone planted a tree a long time ago." This tool helps you visualize your financial tree growing over time through actual market data and educational projections.
---
Part 7: Common Mistakes to Avoid
The "Perfect Timing" Trap
Waiting for the "perfect" entry point often means missing years of compound growth. Time in the market beats timing the market.
The "Hot Stock" Temptation
Chasing individual stocks like NASDAQ:NVDA or NASDAQ:TSLA might seem exciting, but it introduces unnecessary risk for beginners.
The "Market Crash" Panic
Every bear market feels like "this time is different." Historical data shows that patient investors who continued their DCA through 2008, 2020, and other crashes were handsomely rewarded.
---
Conclusion: Your Path to Financial Freedom
Value investing through broad index funds and dollar-cost averaging isn't glamorous. You won't get rich overnight, and you won't have exciting stories about your latest trade.
But here's what you will have:
Proven strategy backed by decades of data
Peace of mind during market volatility
Compound growth working in your favor 24/7
A realistic path to serious wealth creation
The Bottom Line: Warren Buffett's approach works because it's simple, sustainable, and based on fundamental economic principles. Start today, stay consistent, and let compound growth do the heavy lifting.
"Someone's sitting in the shade today because someone planted a tree a long time ago." - Warren Buffett
Educational Summary:
Understanding these principles provides a foundation for informed decision-making. As Warren Buffett noted: "The best time to plant a tree was 20 years ago. The second-best time is now" - emphasizing the educational value of understanding long-term investment principles early.
---
🙏 Personal Note & Acknowledgment
This article was not entirely my own work, but the result of artificial intelligence in-depth research and information gathering. I fine-tuned and brought it to my own vision and ideas. While working with AI, I found this research so valuable for myself that I could not avoid sharing it with all of you.
I hope this perspective gives you a different approach to long-term investing. It completely changed my style of thinking and my approach to the markets. As a father of 3 kids, I'm always seeking the best investment strategies for our future. While I was aware of the power of compound interest, I could never truly visualize its actual power.
That's exactly why I also created the open-source DCA Investment Tracker Pro indicator - so everyone can see and visualize the benefits of choosing a long, steady investment approach. Being able to see compound growth in action makes all the difference in staying committed to a strategy.
As someone truly said: compound interest is the 8th wonder of the world.
---
Disclaimer: This article is for educational purposes only and does not constitute financial advice. Past performance does not guarantee future results. Always consult with a qualified financial advisor before making investment decisions.

No explanation put predictionas the header says; The market is likely to decline down to yesterday's low starting from right now

Update on the markets and what may come in June/JulySPY reached 90% of the down move from the top today, and that could be significant if we completed a larger B wave. Gold lost it's balance and probably goes lower. Oil is breaking up, as of now looks bullish. BTC had a nice pump but I think it will go lower.

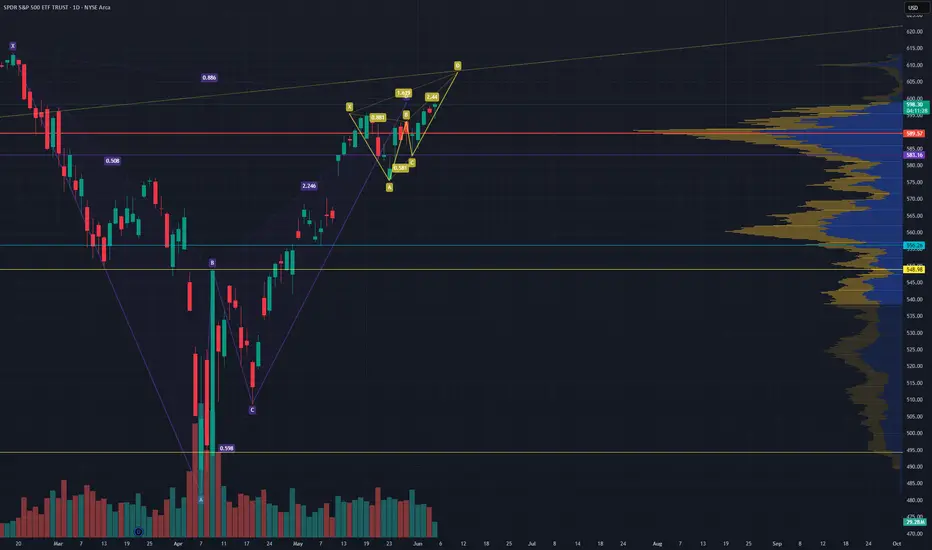
SPY Macro Analysis: Premium-Discount Dynamics, Trade Setup etc..Macro Perspective:
The SPDR S&P 500 ETF Trust (SPY) is currently consolidating in a critical premium zone, with a tug-of-war between buyers and sellers. Economic uncertainty and broader market sentiment suggest a cautious approach, particularly with upcoming economic events (e.g., Fed policy updates, inflation data). The equilibrium level (~599) appears to be pivotal for directional bias.
Technical Breakdown
Premium Zone (599.80–606.19):
Price is testing key resistance levels near Fibonacci 0.886 and 2.618 extensions. A failure here could signal a bearish reversal.
A sustained breakout beyond 606.19 would open doors to higher targets (612–617.50).
Discount Zone (585–577):
A retracement into this zone could attract buyers looking for value entries.
Key support: 565.51 (swing low, potential liquidity grab).
Volume Dynamics:
Noticeable spikes at resistance levels, suggesting potential liquidity sweeps before a decisive move.
Trade Setup
Scenario 1: Bullish Continuation
Entry: Upon breakout and close above 606.19.
Stop-Loss: Below 604 (to avoid fakeouts).
Targets: 612 (initial), 617.50 (extended).
Risk-Reward: Maintain at least 1:3.
Scenario 2: Bearish Reversal
Entry: Upon rejection from the premium zone (~599–606).
Stop-Loss: Above 607.
Targets: 585 (initial), 577 (secondary).
Risk-Reward: At least 1:4.
Scenario 3: Discount Rebound
Entry: Bullish price action confirmation within the 585–577 range (e.g., engulfing candle, double bottom).
Stop-Loss: Below 575.
Targets: 599 (initial), 606.19 (secondary).
Risk-Reward: Adjust based on entry levels.
Risk Management
Position Sizing: Use no more than 2% of your account per trade.
Confirmation: Wait for clear price action signals or key volume levels to confirm entries.
Trailing Stop: Consider trailing stops to lock in profits during trending moves.
Macro Insights
Keep an eye on macroeconomic drivers like inflation data, job reports, and Federal Reserve commentary.
Correlation with bond yields and volatility (e.g., VIX) could provide additional cues for market sentiment.
💡 Pro Tip: Patience pays—let the price come to you. Always stick to your plan and maintain discipline in both entries and exits.

Opening (IRA): SPY August 15th 502 Short Put... for a 5.10 credit.
Comments: Adding at a strike better than what I currently have on in August at the 535 strike, targeting the <16 delta paying around 1% of the strike price in credit.

SPY/QQQ Plan Your Trade For 6-6 : Inside-Breakaway Counter-TrendToday's pattern suggests the markets may attempt a Counter-trend type of Inside Breakaway pattern.
I read this as a downward price trend (counter to the current upward price trend).
The markets seem to have bounced overnight - prompting a potentially strong opening price level.
If my Inside-Breakaway shows up today, things could get very interesting if a breakdown in price sets up.
Many of you know I've been expecting a broader market breakdown to take place - sending the SPY/QQQ down about 7% to 13% or more.
It hasn't happened yet and the SPY/QQQ continue to try to push a bit higher - but, until we break to new highs, the breakdown event is still possible.
Let's see how things play out today. Platinum is showing that the global markets are entering an extreme speculative phase (very similar to 2000-2008). Transports are stalling, showing the US economy is expected to weaken over the next 3+ months.
Imagine that. Speculation is ramping up while the US market may move into a recession in H2:2025. Wow.
We certainly live in interesting times.
Get some.
#trading #research #investing #tradingalgos #tradingsignals #cycles #fibonacci #elliotwave #modelingsystems #stocks #bitcoin #btcusd #cryptos #spy #gold #nq #investing #trading #spytrading #spymarket #tradingmarket #stockmarket #silver

$SPY Leaning Bearish: Dipping out of Rising Pennant Looking at Key Ranges, Pivot Points, and MA's on multiple timeframes with the sum leaning more bearish for me.
Feel free to give your thoughts/perspectives!

Nightly $SPY / $SPX Scenarios for June 6, 2025 🔮 Nightly AMEX:SPY / SP:SPX Scenarios for June 6, 2025 🔮
🌍 Market-Moving News 🌍
🇺🇸 U.S. Labor Market in Focus
Investors are closely watching the upcoming May employment report, which is expected to show a gain of 125,000 jobs, down from 177,000 in April. The unemployment rate is anticipated to remain steady at 4.2%. These figures will provide insights into the labor market's response to recent economic pressures, including tariff impacts .
🇮🇳 RBI Expected to Cut Rates Amid Low Inflation
The Reserve Bank of India (RBI) is anticipated to announce a 25 basis point cut in the repo rate on June 6, marking the third consecutive reduction. This move aims to support economic growth amid persistent low inflation and global uncertainties .
📊 Key Data Releases 📊
📅 Friday, June 6:
8:30 AM ET – U.S. Employment Report (May):
Analysts expect non-farm payrolls to increase by 125,000, with the unemployment rate holding at 4.2%. Average hourly earnings are projected to rise by 0.3% month-over-month. These figures will be critical in assessing the health of the labor market and potential Federal Reserve policy actions .
3:00 PM ET – U.S. Consumer Credit (April):
The Federal Reserve will release data on consumer credit, with forecasts predicting an increase of $10 billion. This report will shed light on consumer borrowing trends and financial health .
⚠️ Disclaimer:
This information is for educational and informational purposes only and should not be construed as financial advice. Always consult a licensed financial advisor before making investment decisions.
📌 #trading #stockmarket #economy #news #trendtao #charting #technicalanalysis

$SPY bearish, to break April lows?Most people are thinking that we'll see a correction that goes back to the $560 area and then from there, we'll go to new highs. They also don't think it's likely that we'll retest the lows from April and think it's nearly impossible that we'll break the lows.
However, my base case is that we will break the lows. Yes, in the past, most dips like the one in April were good buying opportunities, but the chart looks different here.
You can see that ever since April, all we've done is consolidate up into a rising wedge.
We look set to break down from that in the coming days. If we do break down and are unable to reclaim the highs, then I think my base case will become the highest probability outcome.
I think it's likely that the move down will take us to the $424- 402 levels. Let's see what happens.

Big BAT Little Deep Crab on SPY WTF is going on with the marketI don't know what to make of this market but the BAT completed and what looked like a cup and handle is starting to look like a BAT and a deep crab. The deep Crab finishes right around a trendline I have that goes way back.
Publishing for tracking purposes
#SPY
SPY/QQQ Plan Your Trade For 6-5 : Inside BreakawayToday's SPY Cycle Pattern is an Inside Breakaway pattern - which indicates the markets want to try to break away from the sideways range I've been sharing with you.
Gold and Silver are making a very big move higher this morning - which may be indicative of some crisis or military conflict move throughout the world.
I see this move in Metals as a bit of a warning to the global markets. Metals hedge global risk levels. A rise in metals suggests traders fear some crisis event and are banking on Silver/Gold as an efficient hedge.
BTCUSD is still trading within the sideways channel as well. I see BTCUSD less as a hedge and more as a technology/Block-chain asset. No matter how you slice it, BTCUSD is not really an alternate currency, it is a Technology asset.
We could see some big moves over the next 2-5+ days because of how the markets are setting up and how Gold/Silver are reacting.
Buckle Up.
Get Some.
#trading #research #investing #tradingalgos #tradingsignals #cycles #fibonacci #elliotwave #modelingsystems #stocks #bitcoin #btcusd #cryptos #spy #gold #nq #investing #trading #spytrading #spymarket #tradingmarket #stockmarket #silver

Thesis on the SPY ETF being rigged (live demonstration 5/5/25)Worlds Saddest Story
I have an algorithm running to find order block's in the form of resistance in the market at any given time. Here I will show the power of computers and how they both effectively and unknowingly create a repeatable system than unfortunately rigs the market to act in predictable ways. This theory will be tested at open today and lucky souls who find this thesis before open will have a rare opportunity to witness these events unfold. The events I am referring to are the SPY ETF opening at or around 597.75~ and immediately creating the high point of the day and promptly descending to create a market drop that exceeds 1% by EOD. While it is rather unfortunate and unfair that the stock market, a once globally competitive market for people to fund ventures, has now turned into a profit making machine for math specialists who have an knack for understanding price movements that inevitably widens the wealth gap for the rich that can afford to invest in computer driven algorithms, while the working man must try to create their own system that CAN NEVER consistently beat the machine.
TL/DR: Bet on the SPY ETF making a high off open and plummeting over 1%

Introduction to HFT Involvement in financial marketsIntroduction to HFT Involvement in financial markets
Market Making algorithms continuously post buy (bid) and sell (ask) limit orders, aiming to earn the bid- ask spread while providing liquidity. HFT market makers function much like traditional market makers but at much higher speed and scale. They simultaneously quote both sides of the market and profit from the small price differential (spread) between bids and asks . Exchanges often incentivize market makers via liquidity rebates (fractions of a penny per share) for adding liquidity, which HFT firms capitalize on through very large trading volumes. Over the past two decades, human specialists have largely been supplanted by automated HFT market makers, which now dominate liquidity provision. Limit orders are prioritized over market orders, which in some capacity is fair; however special order types made for HFT that are just slightly more advanced limit orders are prioritized over regular limit orders but are not accessible by retail investors is very unfair. If you search up the IEX exchange website and look at their order types you can see that they are targeting HFT system creators and retail isn't able to use those products themselves.
Statistical Arbitrage (Stat Arb) strategies use quantitative models to exploit pricing inefficiencies among related instruments. In traditional stat arb, a trading system might track a portfolio of securities and identify when price relationships deviate from statistical norms, betting on convergence. In an HFT context, stat arb often means very short-term, high-speed versions of these tactics, sometimes called “data-driven” or “quantitative” HFT strategies. These strategies are market-neutral and typically involve trading a long-short portfolio of correlated assets based on mean reversion expectations. For example, an HFT stat-arb algorithm might monitor price spreads between an ETF and its underlying basket of stocks, or between index futures and the index’s component equities, and rapidly trade to exploit divergences before they close. One common HFT arbitrage is index arbitrage – comparing the real-time value of an index future (say the S&P 500 E-mini) with the aggregated price of the index’s constituent stocks. If the future is temporarily overpriced relative to the underlying, the algo will sell the future and buy the basket (or vice versa), capturing a virtually risk-free profit as prices realign. This is a relatively difficult strategy but is also the strategy I primarily focus on building since as someone who lacks resources, it is the one thing I can make, test, and deploy from my computer.
Latency Arbitrage strategies exploit tiny timing differences in information arrival between trading venues or market participants. If one market moves slightly before another, an HFT latency-arb algorithm can capitalize by racing to trade on the slower venue with knowledge of the price change that is about to occur. In essence, this is a race condition: the fastest trader to react to new information can “pick off” resting orders on venues that have not yet updated their prices. Latency arbitrage is often considered a predatory strategy – it’s been described as effectively front-running public information by virtue of speed. Virtually every time you place a trade through a broker, one of these systems will profit off you buy being payed a maker taker fee for bringing you to an exchange; this isn't fair since in many cases you'll be brought to the BATS exchange which pays the taker and charges the maker (every other exchange does the opposite) and you'll still be stuck paying a commission that someone else profits from.
Event-Driven HFT strategies focus on trading around news or specific trigger events. These algorithms rapidly analyze real-time news feeds, economic data releases, earnings reports, or even social media, and execute trades before human traders can react. In the modern market, machine-readable news feeds and NLP (Natural Language Processing) models are integrated directly into some HFT systems. For example, an event-driven algo might parse a company’s earnings press release the instant it appears and decide to buy or sell the stock based on whether results beat or miss expectations – all within milliseconds. HFT firms subscribe to low-latency news services and sometimes even co-locate servers near newswire sources to get a time advantage in receiving the information. This is self explanatory, just whatever system can react to news the fastest wins.
Some of the more controversial HFT strategies involve detecting liquidity and exploiting it, or conversely avoiding adverse selection from toxic order flow. Liquidity detection algorithms (sometimes called “pinging” strategies) attempt to sniff out hidden orders and large trading interest in the market. HFT firms may send out a flurry of tiny orders – often immediate-or-cancel (IOC) orders for 100 shares or 1 lot – across different price levels or venues to probe for supply or demand. If these pinging orders get hits (even partial fills), it indicates the presence of a large buyer or seller hidden in the order book or a dark pool. The HFT’s algorithm can then escalate its activity: for example, if a ping reveals a big buyer in a dark pool, the HFT might buy up shares on other venues and then sell into the buyer’s demand at a higher price. I'd compare this to playing call of duty and throwing a stun grenade into a room before entering, if someone gets stunned and you get +25 points, you know to move in immediately, and if you don't stun someone, you may proceed with caution.
Momentum Ignition refers to a strategy where a trader deliberately attempts to ignite a rapid price movement – up or down – and capitalize on the frenzy that follows. An HFT or algorithmic trader employing momentum ignition will initiate a series of aggressive orders (market orders or large trades) in a short span, hoping to spark other algorithms or investors to also start buying or selling, thereby driving the price further in that direction. Once momentum takes hold, the instigator can profit by flipping their position (for example, buying shares to start an up-move, then selling into the rally they created). This is what happens every time you see newsa drop and the price of the stock goes in the opposite direction for a split second
Spoofing and Layering are abusive tactics where a trader places non-genuine orders to mislead other market participants about supply or demand, with the intent to cancel those orders before execution. They are illegal in most jurisdictions (for example, spoofing was explicitly outlawed in the US via the 2010 Dodd- Frank Act). These tactics deserve discussion both to understand how rogue algorithms might attempt them and how modern systems detect and prevent them. Currently an order can be cancelled in 0.5 seconds after it has been placed legally.
In essence all of these are ways of fooling retail and institutional investors to profit off their lack of knowledge; I think its important to be informed hence I am pointing this out and publicizing it. There are 100's of pages on the federal registry that will tell you how HFT algorithms are screwing you (the retail investor) over and with all that being said I believe that investing should be left to computers as they have taken over the market. It isn't fair but it's how the world works now. You are just liquidity swimming in pools for larger fish to feed off.

Nightly $SPY / $SPX Scenarios for June 5, 2025🔮 Nightly AMEX:SPY / SP:SPX Scenarios for June 5, 2025 🔮
🌍 Market-Moving News 🌍
🇺🇸 JOLTS Job Openings Surprise to Upside
U.S. job openings unexpectedly rose to 7.39 million in April—well above forecasts—indicating that labor demand remains robust despite macro headwinds and trade-policy uncertainty
🛢️ OPEC+ Greenlights July Supply Increase
OPEC+ agreed to boost production by 411 K barrels per day starting in July, adding downward pressure to oil prices and weighing on energy equities
📈 Fed’s John Williams Signals Patience
New York Fed President John Williams reiterated that the Fed sees no urgency to cut rates, citing mixed inflation signals and a balanced labor market—keeping investors cautious on rate-cut timing
📊 Key Data Releases 📊
📅 Thursday, June 5:
8:30 AM ET – JOLTS Job Openings (April)
Measures total U.S. job vacancies, a leading indicator of labor-market strength.
10:00 AM ET – OPEC+ Press Conference (Post-Meeting)
Details on production quotas for July, guiding energy market supply expectations.
⚠️ Disclaimer:
This information is for educational and informational purposes only and should not be construed as financial advice. Always consult a licensed financial advisor before making investment decisions.
📌 #trading #stockmarket #economy #news #trendtao #charting #technicalanalysis
