SATS Full of PotentialSATS, a former superstar, seems to be making a comeback this year. The pandemic and WFS acquisition raised many doubts about management, but the latest excellent quarterly results and dividend distribution show that the company is coming back stronger. The recent contract renewal with SIA and the acquisition of Menzies World Cargo (Amsterdam) to expand EU market capacity signal growing demand for cargo handling recovery. SATS appears to be regaining investor confidence.
S58 trade ideas

SATS appears to be in an oversold condition. SATS currently trades at 18.1x FY26F PE and 15.4x FY27F PE.
The target price has been adjusted to S$4.00, based on an 18.4x FY27F PE valuation, which is 0.5 standard deviations (SD) below its historical mean PE of 19.9x.
The negative impact of tariff and tax rule changes is likely already priced in, making SATS an attractive long-term investment despite near-term risks.
SATS is well-positioned for long-term growth despite near-term challenges posed by US trade policies and global macroeconomic factors. The company’s strong fundamentals, ongoing expansion strategy, and historical resilience make it a compelling investment at current valuation levels. The recommendation remains a BUY, with a revised target price of S$4.00.
From a technical analysis perspective, SATS appears to be in an oversold condition. The stock price has the potential to rebound to $3.46, followed by $3.58, presenting investors with an opportunity for an upside of 3.5% to 7% range over the next few weeks.

SATS is testing the $2.93 resistance levelSingapore's aircraft food supplier and airport service provider, SATS, has posted strong financial results, including a positive PATAMI (Profit After Tax and Minority Interests) after completing its acquisition of Worldwide Flight Services (WFS) and integrating it into the fiscal year. This was followed by a significant reduction in liabilities due to debt restructuring. Investors are eagerly waiting for SATS to resume paying dividends as it has done in the past.
With global travel demand returning to normal, SATS' share price has started to recover, supported by improving financials. Is now a good time to buy?

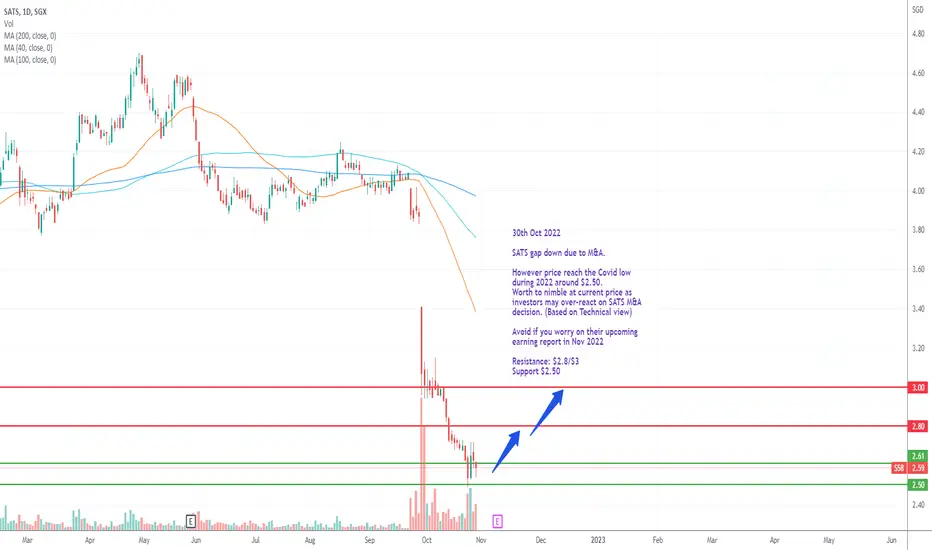
SATS Bias more on upside from chart perspective30th Oct 2022
SATS gap down due to M&A.
However price reach the Covid low during 2022 around $2.50.
Worth to nimble at current price as investors may over-react on SATS M&A decision. (Based on Technical view)
Avoid if you worry on their upcoming earning report in Nov 2022
Resistance: $2.8/$3
Support $2.50
Bias more on upside. 27th March 2022
SATS part of the business is to provide flight catering. Since country open up, all related to Travel Sector will be benefited from it.
Once it break above the flag channel resistance, we may see next resistance at $4.60 and may hit jackpot at $5.16 (78.6% Fibo) to complete the flag patten

[Analysis] SATS... is recovery on its way?From a long-term perspective, the low during Apr 2020 covid19 marks a higher low and creates major support at 2.50-3.00 level. Since then, prices have rebounded more than 60% and eventually hitting the resistance of 4.60.
The price is now retracing lower and forming (seems like) a bullish flag on a smaller time frame.
We have a few things to take note of here.
1) The major resistance at 4.50-5.00 will not be broken anytime soon. Price will be met with supplies/selling at this zone. In the short/mid-term, this will be the target price.
2) Price is currently retracing, and we do not know how far it will retrace.
3) Anything below 2.50 is considered bearish, as we will be breaking the higher low.
As such, your best approach to taking this counter will be buying as close to the major support as possible, so you have room for profits. You can split your entries into two buy levels. One will be at 3.50, and the other will be at 3.00. This will ensure you will at least get one position in should the price decide to recover midway.
Needless to be said, you want to be out of this trade if it broke down below 2.500.
2021 FY earnings will be a key decider.

<TradeVSA> SATS Pullback Successfully with green pentagonSign of Strength in the chart:
1. Strong uptrend with GAP
2. Reaccumulation
3. Triple NS signal
4. Green Pentagon, increasing volume at resistance
Hit the "LIKE" button to support us :)
Disclaimer
This information only serves as reference information and does not constitute a buy or sell call. Conduct your own research and assessment before deciding to buy or sell any stock

SATS $4.55 then $5.85SATS S58 : TARGETS $4.55 (quantstrategic.com.sg)
Refer to my previous post, $4.55 has been hit intraday.
Short term trend is UP
Medium trend is UP since 091120
Long term trend down pending break of $4.55
PIVOT $4.15
Long positions above $4.15 target 4.55 and 5.85
Short positions below $4.15 target 3.65 and 3.55

S58.SGX_LongENTRY: 4.12
TP: 4.46
SL: 3.89
- ADX<25. Would like to be higher.
- RSI>60.
- FFI and RS +ve
- MAs are aligned. 10MA below 40MA but pointing up.
- Looks like demand is there.
- Once above HVN 4.14, it should have more upside.

SATS S58 : TARGETS $4.55SATS is bullish with a buy signal on 020221 on the 4hr at $3.95 and the dailies on 080221 at $4.05. The medium term trend is up since 091120 last year with buyers pushing price above $3.40 to test $4.55, the pivot point on the longer term monthly charts.
Short Term Trend UP since 020221
Medium Trend UP since 091120
Long Term will turn UP if we break and hold above $4.55
PIVOT $3.95
Long positions above $3.95 target $4.55 and $5.85
Short positions below $3.95 target $3.60 and $2.50

SATS Ready to Explode Higher!False break below 100 & 200 Month MA and now waiting for announcement of COVID Relief bill to explode for Santa Claus Rally!
Lots of profits from COVID vaccine storage


SATS - Bullish Adam & Eve Reversal?SATS has been staging several strong rebounds since late March which failed. However the stock fell on 29 May with a massive volume but without forming a new low from the March's low. There is a chance that the weak bulls have been flushed out once and for all and that the rebound that started 2 days ago is sustainable this time, especially when it appeared to have formed an Adam & Eve base formation. Time to stake it for some upside. Long @ 3.00 with initial stop just below 2.85 and looking to scale out @ 3.28-3.30 then 3.55 and perhaps even 3.80 if lucky.
Disclaimer: This is just my own analysis and opinion for discussion and is not a trade advice. Kindly do your own due diligence and trade according to your own risk tolerance. Thank you.


SGX SATS Neutralmovements depends on whether stock trend up or down in subsequent move. To monitor further

SATS- Downside is still strongSATS have further downside till the dmeand area and 161.8% extension level. We believe a bullish rebound can happen at 4.16-4.07


SAT broke out of long term falling wedge (Bullish)I got into this trade at 5.00 and added at 5.07 as it broke out of the long term falling wedge formation and am looking at a possible wedge target of 5.70 - 5.80 with a stop loss just below 4.90. However targets are not guaranteed, will place trailing stops as it rises - usually a fractal low or the below the low of the previous day's candle (if it was a large bullish candle).
