MyShell Signals: Bottom Confirmed Rise ConfirmedWhat you see here is a big, classic, Adam & Eve bottom pattern.
First the rounded bottom followed by the pointed-bottom. And this reveals the market will change its trend coming from a classic signal.
What you see on this chart is a perfect falling wedge pattern (orange). This reveals an upcoming bullish breakout, the breakout leading to a new uptrend.
Then you can see a perfect higher low (purple trendline). Coupled with a reversal candle and continuation with a full green candle after the higher low, 22-June, is in. A strong combination of bullish signals but I can show you more.
The full green candle 23-June pushed SHELLUSDT daily above EMA8 and EMA13.
There was high volume 9-June. The highest volume day in months.
There is also a resistance baseline that was conquered around 0.1380. All bullish but still early. SHELLUSDT is still trading at bottom prices compared to what you will be seeing in a matter of months.
The RSI is trending up. Notice the same falling wedge pattern...
The MACD produced a bullish cross after a major higher low. This is all ultra, hyper bullish of course.
When so many bullish signals are combined together, it simply leaves no room for doubt; Crypto is going up.
MyShell is trading at bottom prices with many confirmed signals, soon to grow.
Thank you for reading.
Namaste.
SHELLUSDT trade ideas

SHELLUSDT UPDATE
Pattern: Falling Wedge Breakout
Current Price: \$0.1444
Target Price: \$0.2084
Target % Gain: 45.71%
Technical Analysis: SHELL has broken out of a falling wedge pattern on the 8H chart, signaling a potential bullish reversal. The breakout is supported by a strong bullish candle and a slight uptick in volume. Confirmation is visible as price holds above resistance.
Time Frame: 8H

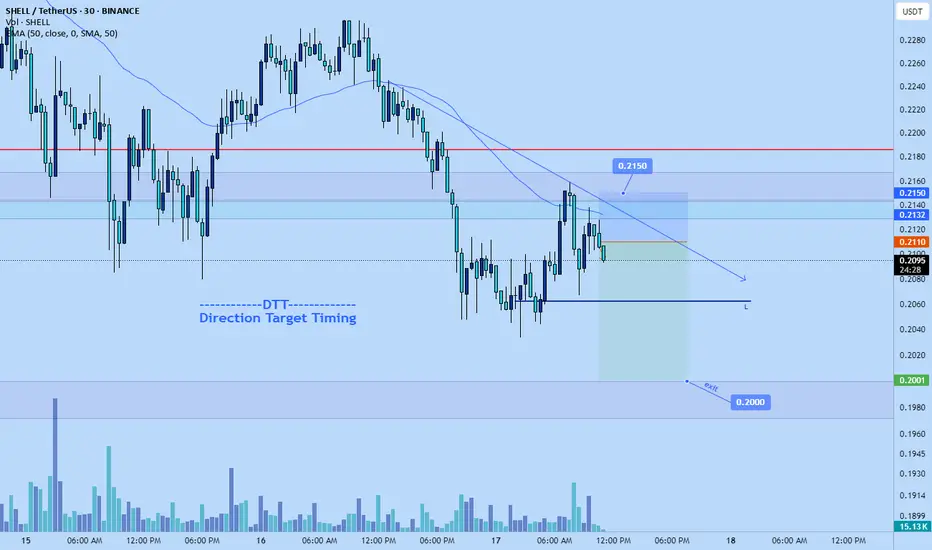
Shellusdt shotJust now entered short on Shellusdt. I think the market will most likely fall down to $0.2 area today.
trade is roughly 2.7 RR from my entry. Might be around 2RR at time of this post.
Time sensitive.
Trade in alignment with my DTT strategy.
Stop: $0.2150 or higher

Shellusdt short to $0.1457Just now opened a short position on shellusdt. Expecting even more downside before weekly closure.
3-5.7 RR trade.
Time sensitive.
Am still monitoring entry for potential early exit, just incase. But once it starts falling again its likely gonna drop aggressive.

SHELL/USDTKey Level Zone: 0.1160 - 0.1170
HMT v8 detected. The setup looks promising, supported by a previous upward/downward trend with increasing volume and momentum, presenting an excellent reward-to-risk opportunity.
HMT (High Momentum Trending):
HMT is based on trend, momentum, volume, and market structure across multiple timeframes. It highlights setups with strong potential for upward movement and higher rewards.
Whenever I spot a signal for my own trading, I’ll share it. Please note that conducting a comprehensive analysis on a single timeframe chart can be quite challenging and sometimes confusing. I appreciate your understanding of the effort involved.
Important Note :
Role of Key Levels:
- These zones are critical for analyzing price trends. If the key level zone holds, the price may continue trending in the expected direction. However, momentum may increase or decrease based on subsequent patterns.
- Breakouts: If the key level zone breaks, it signals a stop-out. For reversal traders, this presents an opportunity to consider switching direction, as the price often retests these zones, which may act as strong support-turned-resistance (or vice versa).
My Trading Rules
Risk Management
- Maximum risk per trade: 2.5%.
- Leverage: 5x.
Exit Strategy
Profit-Taking:
- Sell at least 70% on the 3rd wave up (LTF Wave 5).
- Typically, sell 50% during a high-volume spike.
- Adjust stop-loss to breakeven once the trade achieves a 1.5:1 reward-to-risk ratio.
- If the market shows signs of losing momentum or divergence, ill will exit at breakeven.
The market is highly dynamic and constantly changing. HMT signals and target profit (TP) levels are based on the current price and movement, but market conditions can shift instantly, so it is crucial to remain adaptable and follow the market's movement.
If you find this signal/analysis meaningful, kindly like and share it.
Thank you for your support~
Sharing this with love!
HMT v2.0:
- Major update to the Momentum indicator
- Reduced false signals from inaccurate momentum detection
- New screener with improved accuracy and fewer signals
HMT v3.0:
- Added liquidity factor to enhance trend continuation
- Improved potential for momentum-based plays
- Increased winning probability by reducing entries during peaks
HMT v3.1:
- Enhanced entry confirmation for improved reward-to-risk ratios
HMT v4.0:
- Incorporated buying and selling pressure in lower timeframes to enhance the probability of trending moves while optimizing entry timing and scaling
HMT v4.1:
- Enhanced take-profit (TP) target by incorporating market structure analysis
HMT v5 :
Date: 23/01/2025
- Refined wave analysis for trending conditions
- Incorporated lower timeframe (LTF) momentum to strengthen trend reliability
- Re-aligned and re-balanced entry conditions for improved accuracy
HMT v6 :
Date : 15/02/2025
- Integrated strong accumulation activity into in-depth wave analysis
HMT v7 :
Date : 20/03/2025
- Refined wave analysis along with accumulation and market sentiment
HMT v8 :
Date : 16/04/2025
- Fully restructured strategy logic

Shellusdt short to $0.1270Just recently open a short position on shellusdt. It seems to me market want to make lower lows so anticipating before end of day it will likely push back down lower to $0.1270 area

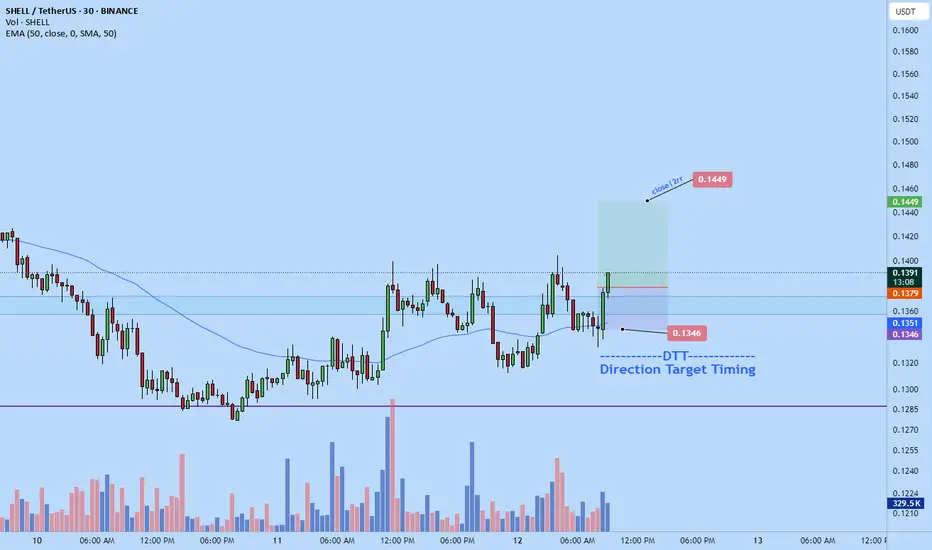
Shellusdt long to $0.1449Just opened a scalp long position on shellusdt. I anticipate that the market will pump towards $0.1449 soon
Time sensitive
SHELL/USDTKey Level Zone: 0.3310 - 0.3345
HMT v6 detected. The setup looks promising, supported by a previous upward/downward trend with increasing volume and momentum, presenting an excellent reward-to-risk opportunity.
HMT (High Momentum Trending):
HMT is based on trend, momentum, volume, and market structure across multiple timeframes. It highlights setups with strong potential for upward movement and higher rewards.
Whenever I spot a signal for my own trading, I’ll share it. Please note that conducting a comprehensive analysis on a single timeframe chart can be quite challenging and sometimes confusing. I appreciate your understanding of the effort involved.
Important Note :
Role of Key Levels:
- These zones are critical for analyzing price trends. If the key level zone holds, the price may continue trending in the expected direction. However, momentum may increase or decrease based on subsequent patterns.
- Breakouts: If the key level zone breaks, it signals a stop-out. For reversal traders, this presents an opportunity to consider switching direction, as the price often retests these zones, which may act as strong support-turned-resistance (or vice versa).
My Trading Rules
Risk Management
- Maximum risk per trade: 2.5%.
- Leverage: 5x.
Exit Strategy
Profit-Taking:
- Sell at least 70% on the 3rd wave up (LTF Wave 5).
- Typically, sell 50% during a high-volume spike.
- Adjust stop-loss to breakeven once the trade achieves a 1.5:1 reward-to-risk ratio.
- If the market shows signs of losing momentum or divergence, ill will exit at breakeven.
The market is highly dynamic and constantly changing. HMT signals and target profit (TP) levels are based on the current price and movement, but market conditions can shift instantly, so it is crucial to remain adaptable and follow the market's movement.
If you find this signal/analysis meaningful, kindly like and share it.
Thank you for your support~
Sharing this with love!
HMT v2.0:
- Major update to the Momentum indicator
- Reduced false signals from inaccurate momentum detection
- New screener with improved accuracy and fewer signals
HMT v3.0:
- Added liquidity factor to enhance trend continuation
- Improved potential for momentum-based plays
- Increased winning probability by reducing entries during peaks
HMT v3.1:
- Enhanced entry confirmation for improved reward-to-risk ratios
HMT v4.0:
- Incorporated buying and selling pressure in lower timeframes to enhance the probability of trending moves while optimizing entry timing and scaling
HMT v4.1:
- Enhanced take-profit (TP) target by incorporating market structure analysis
HMT v5 :
Date: 23/01/2025
- Refined wave analysis for trending conditions
- Incorporated lower timeframe (LTF) momentum to strengthen trend reliability
- Re-aligned and re-balanced entry conditions for improved accuracy
HMT v6 :
Date : 15/02/2025
- Integrated strong accumulation activity into in-depth wave analysis

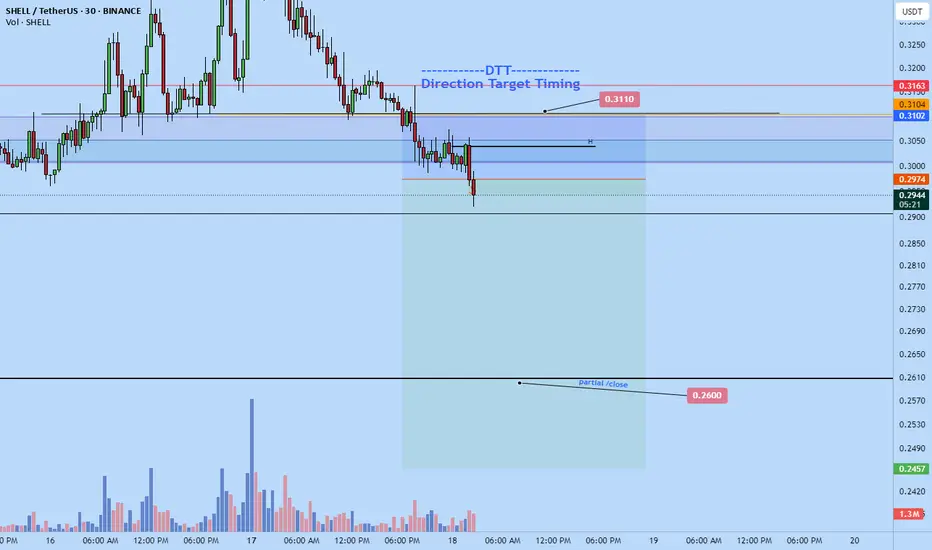
Shellusdt short to $0.26 or lowerI just now opened a short position on shellusdt.
I expect the market to start breaking down based on my DTT strong. An earlier entry would have been nice but just found the pair.
Ideally would want the current hr to close as is in terms of the candle formation without much rejection

Is Shell Ready to Break Through Key Resistance on Its 5th Try..?🚨 Shell's 5th Attempt to Break Resistance at 0.3380 🚨
Shell is currently testing the key resistance level of 0.3380 for the 5th time. 🔥 Here's what to watch for:
📈 Strategy:
Wait for a breakout on the 4-hour timeframe. If Shell sustains above **0.3380**, we could enter a long position on the retest.
🎯 Targets:
First target: 0.4000
Second target: 0.4500
Keep an eye on this level—could be a big move ahead! 🚀

Shellusdt Hello guys welcome. I share here my idea about trend that what happen next and why? So please follow me and learn about market. Please before any investment research own your risk.
Shellusdt recent large selling but in bottom not enough down move so now market pullback atleast a level than Market again try strong down movement 😜😜 so 🙏 keep watching

SHELLUSDT UPDATESHELLUSDT is a cryptocurrency trading at $0.3100. Its target price is $0.4500, indicating a potential 60%+ gain. The pattern is a Bullish Falling Wedge, a reversal pattern signaling a trend change. This pattern suggests the downward trend may be ending. A breakout from the wedge could lead to a strong upward move. The Bullish Falling Wedge is a positive signal, indicating a potential price surge. Investors are optimistic about SHELLUSDT's future performance. The current price may be a buying opportunity. Reaching the target price would result in significant returns. SHELLUSDT is poised for a potential breakout and substantial gains.

shellIt's a good currency (just kidding) 😅🙈 But I'll buy it and let it come to the blue line. If it reaches that, of course.

SHELL/USDT – Strong Uptrend AnalysisSHELL/USDT – Strong Uptrend Analysis
SHELL/USDT is currently in a strong uptrend, demonstrating sustained bullish momentum. The price has been making higher highs and higher lows, indicating continued strength. Based on the current market structure, I anticipate that the price will continue its upward movement in the near term.
However, potential resistance levels could emerge at the mid-point of the channel or near the upper boundary, where selling pressure might increase. Traders should closely monitor these levels for potential reactions.
As always, this is not financial advice. Conduct your own research (DYOR) and manage risk accordingly.

#SHELLUSDT – Bullish Scenario, Expecting a Breakout📈 LONG BYBIT:SHELLUSDT.P from $0.7000
🛡 Stop Loss: $0.6671
⏱ 1H Timeframe
⚡ Trade Plan:
✅ The BYBIT:SHELLUSDT.P price is showing strong momentum after breaking out of a consolidation zone.
✅ The asset has broken above $0.6957 and is holding above this level, signaling a potential continuation of the uptrend.
✅ Increasing volume confirms buyer activity.
🎯 TP Targets:
💎 TP 1: $0.7350
🔥 TP 2: $0.7700
📢 Holding above $0.7000 would confirm further bullish movement.
📢 POC at $0.4671 is far below the current price, indicating a trend shift.
📢 Increasing volume supports the bullish case.
📢 Securing partial profits at TP1 ($0.7350) is a smart risk-management strategy.
🚀 BYBIT:SHELLUSDT.P remains in an uptrend – monitoring for continuation and securing profits at TP levels!
