CUP & HANDLE + ROUNDED BOTTOM IN SILVERSilver (MCX: SILVER1!) – 1 Hour Chart Analysis
🔍 Pattern Formation: Cup and Handle + Rounded Bottom
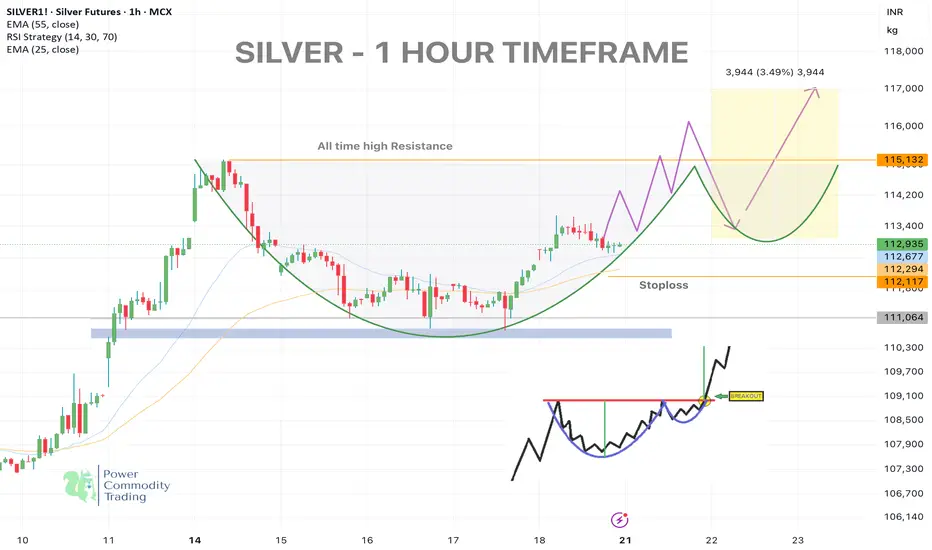
Silver has formed a classic Cup and Handle pattern on the 1H timeframe, indicating a potential bullish breakout above the neckline near 115132 (all-time high resistance).
A smooth rounded bottom confirms strength in accumulation.
📈Bullish Signals Observed:
Price holding above 25 & 55 EMA
Strong volume near the neckline
Rounded base indicates strength from bulls
Potential breakout zone highlighted
🎯 Upside Targets (upon breakout):
Target 1: 113820
Target 2: 114600
Target 3: 115132 (Neckline / Breakout Level)
Target 4: 116750
Target 5: 118850 (Fib Extension 161.8%)
Stoploss: 112117 (below handle low & EMA crossover zone)
🪙 Risk Management:
Trade only on breakout confirmation with volume. Maintain defined SL as price is near a historic resistance.
📌 Disclaimer:
This is a technical analysis based on historical chart behavior and is not financial advice. Please conduct your own due diligence. Trading involves risk.
❤️ If you found this helpful, don’t forget to like the post!
Silver Futures (Apr 2026)
AGJ2026 trade ideas
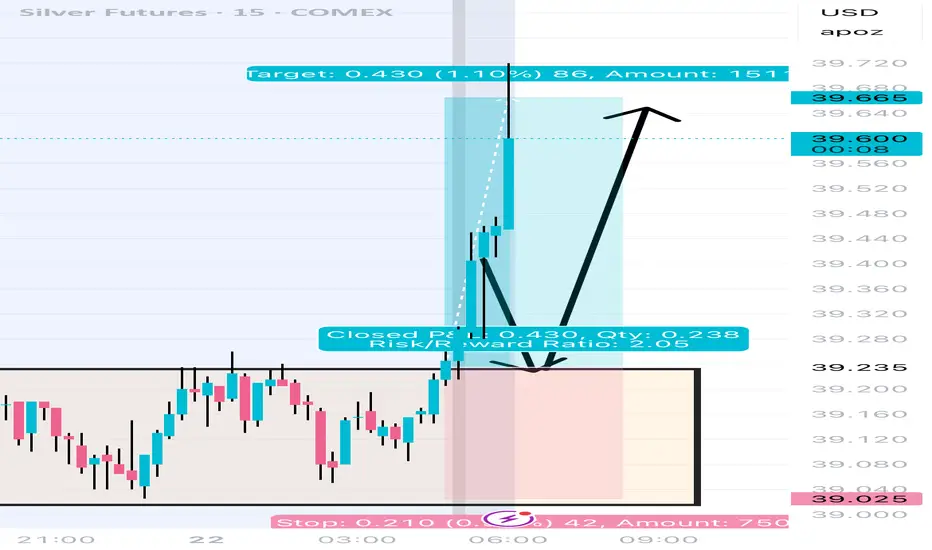
7/22/2025 SI Futures Bullish
weekly: 🐂
daily: 🐂
risk: 1:2
strategy: supply and demand
86 ticks on SI, no drawdown! 📈
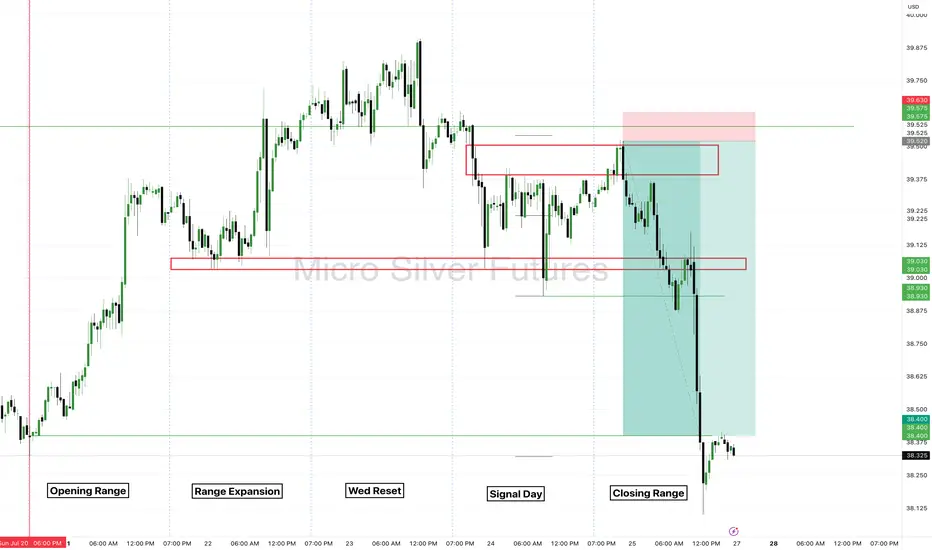
Silver Futures - Closing Range of the Week.Real trading comes down to the patience combined with emotional control to have the highest possible edge.
COMEX_MINI:SIL1!
There is no reason for your chart to filled be filled with ineffective distraction. Instead focus on simplicity to know exactly what to take a trade on. Be a hunter looking for the easy prey!
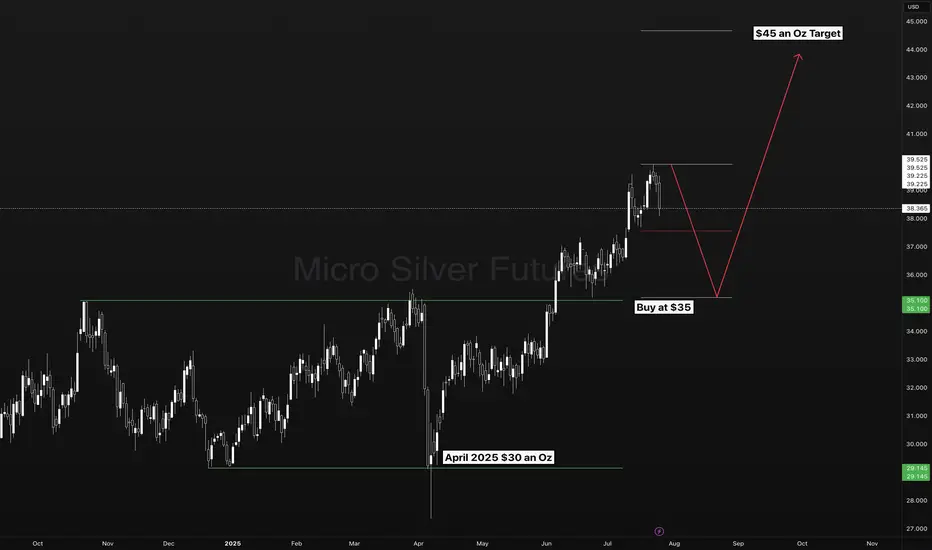
Silver - The Long Term SetupSilver on the longer term may be setting up for a trend continuation opportunity from $35 to $45 dollars an Oz.
Do you Trade FOREXCOM:XAGUSD ?
Do you Trade FOREXCOM:XAUUSD ?
Short term buying opportunity Silver Futures ComexRecent weakness in silver futures could be an buying opportunity on 3 hour candel chart.
Wait for both indicators below to reach oversold levels like it is showing now. Long term 1 day chart showing long term bull trend with much higher upside. I expect silver prices to remain in uptrend. All time highs could be reached in 6 to 1 year period from now.

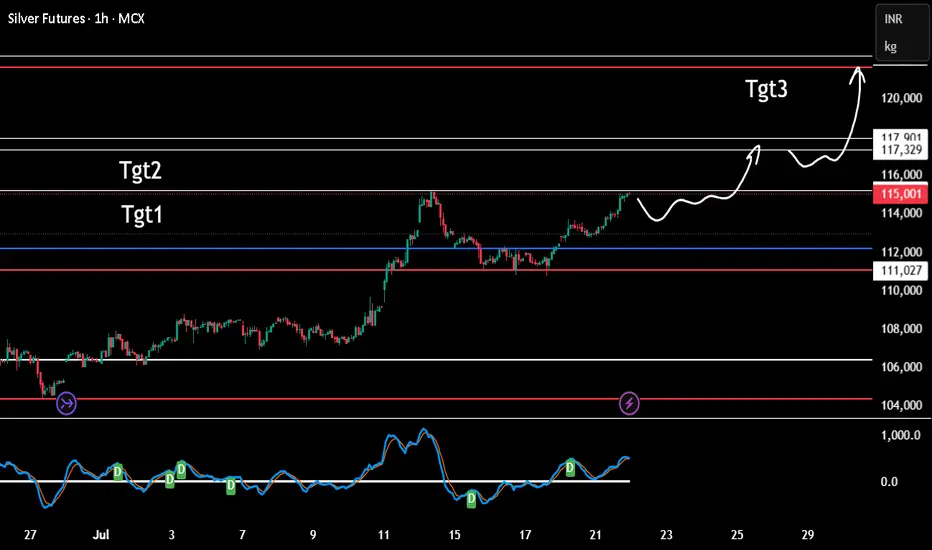
Silver expectationTgt 1 reached. A break out will take to tgt 2 and then tgt 3
Tgt1 is being tested second time, for good break out we need third re-test hence expecting some retracement before a a real break out. Anything above is a possible trap unless the momentum is fast and swift.
Silver to $38The move from March 2020 to August 2020
Was a measured move that played out to the Tee.
We have a similar structure building that projects to the High 30's
Suggesting #Gold move beyond ATH's and #Silver the beta play to move faster in an attempt to catch up, and move towards it's high's again.

Silver Futures Rally: Riding the Upper Bollinger Band
Price is riding the upper band, a classic signal of strong bullish trend continuation.
Strong support near $34.50–$35.00 (prior consolidation zone and Bollinger midline).
Psychological support at $36.00 which was broken and now may act as support-turned-resistance.

Silver futures could be hitting a high resistance zone.Resistance along this upper channel was significant on 3 prior occasions over the last couple of years. We're here now for the 4th time. Could be a high resistance zone. I expect a retrace at the least.
Fibs are pointing higher however unlikely that seems.
If we bust through, WOAH NELLIE!

Silver: Daily Reversal Possible at Supply ZoneI'm anticipating a potential daily reversal in silver prices. Retail traders are maintaining a bullish stance, while commercial traders remain heavily short. The current price action suggests a possible reaction to a key supply area. What are your thoughts on the likelihood of a reversal, and what technical indicators might support or refute this potential shift?
✅ Please share your thoughts about SI1! in the comments section below and HIT LIKE if you appreciate my analysis. Don't forget to FOLLOW ME; you will help us a lot with this small contribution.

BTC, ETH, GC & SI Daily Trade SetupsIn this update we review the recent price action in Bitcoin, Ether, Gold & Silver futures contracts and identify the next high-probability trading opportunities and price objectives to target. To review today's video analysis, click here!

Silver's Key Support Holds: Bullish Target at $39.20 Near TermCurrent Price: $37.12
Direction: LONG
Targets:
- T1 = $38.50
- T2 = $39.20
Stop Levels:
- S1 = $36.60
- S2 = $36.20
**Wisdom of Professional Traders:**
This analysis synthesizes insights from thousands of professional traders and market experts, leveraging collective intelligence to identify high-probability trade setups. The wisdom of crowds principle suggests that aggregated market perspectives from experienced professionals often outperform individual forecasts, reducing cognitive biases and highlighting consensus opportunities in Silver.
**Key Insights:**
Silver has shown resilience at its current levels, supported by increased industrial demand and heightened investor interest due to inflationary concerns. The metal remains strongly positioned as a hedge against macroeconomic uncertainties, including currency devaluations and geopolitical tensions. Technical indicators show a consolidation phase near the $37 range, presenting an upside potential if momentum persists. Key support levels around $36.60 strengthen the case for bullish sentiment, while upside resistance near $38.50 may be tested soon.
**Recent Performance:**
Over the last few weeks, Silver has experienced steady growth with a notable 5% climb from the $35 price zone. Despite minor retracements triggered by short-term profit-taking, strong underlying demand has consistently pushed prices back above critical levels. This performance highlights growing optimism for commodities in general, as traders eye Silver's historic role as a safe-haven asset during times of economic uncertainty.
**Expert Analysis:**
Market experts point to bullish patterns forming on Silver's daily charts, with its relative strength index (RSI) hinting at further upward movement. The convergence of moving averages signifies medium-term bullish strength, bolstered by increasing net longs in futures contracts. Experts also cite expanding industrial applications of Silver, especially in renewable energy technologies and electric vehicles, enhancing its demand profile in the long run.
**News Impact:**
Recent inflation-linked announcements have bolstered Silver's appeal as an investment hedge, while budget allocations in renewable energy initiatives signal supply-chain expansions for Silver usage. Additionally, the Federal Reserve's cautious stance on rate hikes has maintained supportive conditions for precious metals, which thrive in lower interest rate environments. These factors contribute positively to Silver's price outlook.
**Trading Recommendation:**
Traders seeking exposure to safe-haven assets or hedges against economic uncertainty may consider taking a long position on Silver. With critical support levels holding firm and a favorable demand backdrop, the metal offers a robust upside potential toward the $39.20 resistance in the near term. Placing stops below $36.20 can help mitigate downside risks, allowing traders to capitalize on this promising setup.

Short on SILVERHTF look BULLISH whit news of IRAN but just munpelation news
I see Silver engage on weely FVG but still shorting so my real bias is bearish > Overlapping parte whit +OB in HTF
So after that engagement on 4H FVG i waited for failure of creating FVG higher
Then after opening price directly go down that give me shift down side after that i jumped to engage short and my SL was above BAG of 1H as protected SL
My target just 2RR my BE i will see how the price reacting after taking PWL

Coffee just gave a two-bar reversal to go long6 23 25 oil just went higher presumably from what happened with Tehran... and I heard several people say that oils going a lot higher. I really don't believe that but more importantly we can use some of the tools on the chart to decide when to take trades as a buyer and a seller. there's a clear difference between the S&P and the Russell and I would treat both of them differently. Tesla is bullish but it is coming to the sellers and they talked about that in the video. there are several other markets that I looked at as well.

Futures Watchlist for week ending 6/27/2025Come join as i go through the future tickers that im watching this week and where i see them going. With war talks filling up on social media this will add to our volatility and we will look at key levels to capitalize off of it! Let me know your thoughts on these tickers. Also let me know if there is another symbol futures or stocks that you want me to breakdown for you!

trade updateas we see here in futures chart the target already has been taken that's why i closed my trade on fx and taking my profits CMCMARKETS:SILVERN2025

Silver- The New Love of GOLD bugs ?!The chart displays a bullish impulse wave structure, with clear labeling of waves ① to ⑤ (sub-waves) and i to v (main impulse structure). Here's the breakdown:
🔹 Wave Structure
Wave ① and ②:
Wave ② retraced to around the 0.382 Fibonacci level (94,054), which is a healthy correction.
Wave ③:
A powerful rally exceeding wave ①.
Internally subdivided into 5 subwaves: (1)-(2)-(3)-(4)-(5), currently completing wave (4).
Wave iv:
Expected correction towards the trendline support zone (drawn in pink dotted line).
May complete near or above the previous wave (i) high, respecting Elliott Rule.
🔹 Fibonacci Extensions
1.618 extension at 113,930 for wave ③ seems accurate — a common target for wave ③.
Full Wave V target appears around 121,525, aligning with typical extensions (2.618+ of wave i).
🔹 Volume Analysis
Declining volume during the current correction (wave 4) supports the idea of a healthy pullback.
No excessive sell-off or distribution pattern seen.
🔹 RSI Indicator
RSI currently at 39, below its MA (63.55), indicating short-term weakness or wave 4 correction in play.
Oversold region not yet reached, suggesting room for a further drop before wave iv completes.
🟢 Summary
✅ Elliott Wave Count:
Clean and accurate 5-wave impulse structure is developing.
Currently in wave 4 correction, possibly moving into wave iv of Wave 3 or start of Wave 4 of the higher degree.
📉 Support Levels to Watch:
100,000–102,000 zone as a potential end of wave iv (confluence of trendline + prior resistance).
📈 Upside Targets:
113,930 (1.618 of wave i – ideal wave 3 top).
121,525 (likely wave v top).
📊 RSI Insight:
Correction underway; not yet oversold.
RSI confirmation around 30–35 with bullish divergence could validate wave iv bottom.

RTY1, BTC1 & SL1 Daily Trade SetupsIn this update we review the recent price action in Russell2k, Bitcoin & Silver futures markets and identify the next high-probability trade setups and price objectives to target. to review today's veideo analysis clcik here!

Path to $40 and beyondAs long as gold trends higher vs the CPI, silver catches tailwinds, not headwinds.
That’s the path to $40 and beyond.

SI1! - 7 months RECTANGLE══════════════════════════════
Since 2014, my markets approach is to spot
trading opportunities based solely on the
development of
CLASSICAL CHART PATTERNS
🤝Let’s learn and grow together 🤝
══════════════════════════════
Hello Traders ✌
After a careful consideration I came to the conclusion that:
- it is crucial to be quick in alerting you with all the opportunities I spot and often I don't post a good pattern because I don't have the opportunity to write down a proper didactical comment;
- since my parameters to identify a Classical Pattern and its scenario are very well defined, many of my comments were and would be redundant;
- the information that I think is important is very simple and can easily be understood just by looking at charts;
For these reasons and hoping to give you a better help, I decided to write comments only when something very specific or interesting shows up, otherwise all the information is shown on the chart.
Thank you all for your support
🔎🔎🔎 ALWAYS REMEMBER
"A pattern IS NOT a Pattern until the breakout is completed. Before that moment it is just a bunch of colorful candlesticks on a chart of your watchlist"
═════════════════════════════
⚠ DISCLAIMER ⚠
Breakout Area, Target, Levels, each line drawn on this chart and any other content represent just The Art Of Charting’s personal opinion and it is posted purely for educational purposes. Therefore it must not be taken as a direct or indirect investing recommendations or advices. Entry Point, Initial Stop Loss and Targets depend on your personal and unique Trading Plan Tactics and Money Management rules, Any action taken upon these information is at your own risk.
═════════════════════════════

Silver trend directionSilver 105,525 is in upthrust after distribution.
We expect Silver will drop to 101,630-99,960 zone shortly.

This is Friday and this is an intense look at Silver Friday I am showing you excruciating insights on Trading 2 bar setups and how they guide you to trading decisions that will send you off into the right direction and keep you out of decisions that will turn you in the wrong direction. you can only trade A two-bar reversal when it happens and sometimes the market doesn't have a two-bar setup and because of that you can miss some trades but if you follow the 2 bar patterns your trade performance should be much better than arbitrarily taking trades with no specific plan that gives you entries whether you're going long or short that are likely to trade in to the direction you're anticipating the vast majority of the time you keep the 2 bar set up near where your stop will be if you're wrong you'll have minimal risk. from my perspective if somebody told me they were Traders and they have good trades from time to time but they're taking a lot of losses and they're Trading with big stops I know they're not trading too by reversals and it tells me that their entries are not effective and that they don't know the direction of the market before they take the trade.

ZIG ZAG PATTERN SILVER The time frame for above pattern to complete might take 1-3 months make your postion as per the time frame. Target green line Stoploss red line and silver will fly as per pattern can add now and in little dips later
