Bullish MGC1! Trade Idea If you're looking for a bullish gold trade idea after a sweep of the lows into support, the concept you're working with would generally be a form of market manipulation where prices briefly dip below key support levels before reversing to the upside. Here's how you could approach it
Gold Futures
AU1! trade ideas

Will Gold give us a Break out before the week is over???Monitoring price to see if the go for a level they left behind. It could break out for the end of the week but I am doubting it and thinking they might save it for next week.

Equity Markets Lagging the Precious Metals
Equity indices slipped today as they are looking to retest all time high levels for the ES and the NQ. Traders saw economic data released today including a higher than expected initial jobless claims number along with a lower than expected Philadelphia Fed Manufacturing number. As the equity markets slipped, the precious metals complex saw gains today with Gold, Silver, and Copper all in positive territory.
As the week wraps up, traders can look ahead to the existing home sales number along with the S&P Global Manufacturing PMI tomorrow to add some volatility to the market. The CME Fed Watch Tool is currently indicating that rates will again be unchanged for the March meeting, and then a 43.6% chance of a rate cut of 25 basis points at the June meeting. These expectations can change as the year progresses based on different employment and inflation data and will help give a better indication of the strength of the equity and precious metal markets.
If you have futures in your trading portfolio, you can check out on CME Group data plans available that suit your trading needs tradingview.com/cme/
*CME Group futures are not suitable for all investors and involve the risk of loss. Copyright © 2023 CME Group Inc.
**All examples in this report are hypothetical interpretations of situations and are used for explanation purposes only. The views in this report reflect solely those of the author and not necessarily those of CME Group or its affiliated institutions. This report and the information herein should not be considered investment advice or the results of actual market experience.

Tracking Crisis with Stocks/Gold RatioGold Surges with Three Major Crises
Over the past 25 years, we have witnessed three significant financial crises: the Dot-Com Bubble, the 2008 Financial Crisis, and the recent 9% inflation crisis. In each of these events, a distinct pattern emerged—gold surged before the crisis reached its full intensity.
Historically, gold's price has experienced notable gains before economic downturns:
• Dot-Com Bubble: +34% surge
• 2008 Financial Crisis: +89% surge
• Inflation Crisis (2022): +24% surge
Currently, gold has surged 83% from its trough in November 2022. Given this historical correlation, could we be on the verge of another financial crisis?
Why Are Central Banks Stockpiling Gold?
This current gold rally bears similarities to past surges but also has a crucial distinction. While demand for gold remains strong, this time around, central banks are leading the charge in purchasing gold at an unprecedented rate since 2022.
Gold serves a dual function:
1. Inflation Hedge – A safeguard against inflation.
2. Currency Hedge – Protection against currency devaluation.
Central banks' aggressive gold acquisitions suggest expectations of prolonged inflation and currency instability. As fiat currencies weaken, inflationary pressures mount, reinforcing gold’s attractiveness as a safe haven asset.
Fundamental Indicators Paint a Cautionary Picture
A deeper dive into key economic indicators suggests a challenging outlook. Here are some red flags:
• Treasury Bonds in a Downtrend – Indicating a loss of confidence in long-term debt
securities.
• Interest Rates Remain High – Despite inflation cooling from 9% to 3%, borrowing
costs remain significantly higher than pre-2022 levels. Elevated interest rates place
pressure on businesses and, eventually, stock prices.
• Inflation Remains Stubborn – The lowest recorded inflation since the peak was 2.4%,
but it has now ticked back up to 3%. With ongoing tariff escalations, inflation could
reignite.
These fundamental factors indicate that financial markets remain vulnerable to shocks, reinforcing the case for cautious positioning.
The Technical Outlook: A Bullish Trend Still Holds
Despite fundamental concerns, technical analysis suggests that the current AI-driven market rally, which began after the introduction of ChatGPT, remains intact. A strong uptrend line connecting all major troughs continues to act as a support level.
Timing the Bear with the Crisis
The bond market is already signaling distress. If equity markets break below this well-established uptrend line, my strategy will shift dramatically. Instead of looking for buying opportunities on dips, I will pivot to selling on strengths, anticipating a market downturn.
My Trading Strategy: Still Buying on Dips
I have provided a daily chart with updated trendlines, marking key support and resistance levels. My trading approach will be guided by these levels to manage risk effectively.
Preferred Instruments: Outright futures and call options.
Market Outlook: Cautiously bullish.
While economic conditions warrant vigilance, technical indicators suggest that the bullish trend remains intact—until proven otherwise. Happy trading!
Please see the following disclaimer and information that you may find useful:
E-mini Nasdaq Futures & Options
Ticker: NQ
Minimum fluctuation:
0.25 index points = $5.00
Micro E-mini Nasdaq Futures & Options
Ticker: MNQ
Minimum fluctuation:
0.25 index points = $0.50
Disclaimer:
• What presented here is not a recommendation, please consult your licensed broker.
• My mission is to create lateral thinking skills for every investor and trader, knowing when to take a calculated risk with market uncertainty and a bolder risk when opportunity arises.
Trading competition: www.tradingview.com
Trading the Micro: www.cmegroup.com
CME Real-time Market Data help identify trading set-ups in real-time and express my market views. If you have futures in your trading portfolio, you can check out on CME Group data plans available that suit your trading needs www.tradingview.com

New update for Gold Futures.**Gold Futures: A Comprehensive Update**
Hey everyone! It's been a while since my last post, and there's been a lot happening in the gold market. Let's take a closer look at the current state of gold futures and what's driving the market right now.
**Price Trends**
Gold prices have been trading around **$2,900** per ounce, struggling to break above this level. The price has been relatively stable, but there's a lot of speculation about where it might head next.
**Market Drivers**
Several factors are influencing gold prices at the moment:
**US-Russia Talks**
The ongoing discussions between the US and Russia regarding the war in Ukraine are causing some uncertainty. Any significant developments could impact gold prices as investors look for safe-haven assets.
**Federal Reserve Policies**
Comments from Fed officials about inflation and interest rates are also affecting the market. Fed Governor Michelle Bowman mentioned that rising asset prices may have hampered progress on inflation. This kind of news can make investors nervous and drive them towards gold.
**US Dollar Strength**
The US Dollar has been rebounding, which typically puts downward pressure on gold prices. A stronger dollar makes gold more expensive for holders of other currencies, which can dampen demand.
**Technical Analysis**
The 14-day Relative Strength Index (RSI) is currently around **68**, suggesting a lack of fresh impetus. If sellers enter the market, the price could test the February low of **$2,864**. This level is crucial as a break below it could lead to further downside.
**Upcoming Events**
There are a few key events to keep an eye on:
**Fed Minutes**
The release of the Fed’s January meeting minutes could provide insights into future policy directions. This will be closely watched by market participants.
**US Economic Data**
Reports like Non-Farm Payroll and Consumer Price Index (CPI) will be key indicators to watch. These reports can give us a better understanding of the US economy and influence Fed policy decisions.
**Claims About Trump and Musk Auditing Fort Knox Gold Reserves**
Donald Trump and Elon Musk have indeed raised concerns about the gold reserves at Fort Knox. Trump has publicly stated that he wants to ensure the gold is still there, and Musk has echoed these sentiments on social media. However, it's important to note that Treasury Secretary Scott Bessent has confirmed that the gold reserves are audited annually and that all the gold is present and accounted for.
**Gold Bar with Silver Allegations**
There have been rumors circulating online about a gold bar with silver found at Fort Knox, but there is no verified evidence to support this claim. The U.S. Mint and other official sources have not reported any such discovery. It's likely that this is just another conspiracy theory without any factual basis.
**Conclusion**
While it's always good to question and seek transparency, the claims about Trump and Musk auditing Fort Knox and finding a gold bar with silver seem to lack credible evidence. The official stance is that the gold reserves are well-documented and secure.

GOLD Set to make new Highs before the week ClosesI was looking for a bigger pullback but we didnt get it. The way price is moving and based on the FOMC news I think the pull back is over and price is ready to continue bullish. We just came into the killzone and things look like they are lining up. Trailing stop along the way.

gold futur(daily-4h-1h)daily is up
4 hours and 1 hour is up but in correction
gold comes down to strong 1h demand
in this area trend of daikly and 4 hour and 1 hour is still intact
due to the power of daily uptrend and strong of demand zone in one our that can break previous swing and excellent move out buy with target 1to 2 is logical

GOLD Ready for ALL TIME HIGH BREAKOUT...MCX:GOLD1! trade at 79000 level. You can watch for more upside move after 80000 level breakout.

New Highs coming for gold...but First we need a low created!Looking for a move but we have to be patient in these conditions cause price is rotational. A move is coming. just have to wait for it.

Overbought price, overbought positioning is not a good signThis analysis shows warning signs of gold's uptrend could potentially see a solid correction over the coming weeks.

Tracking Crisis with This Ratio – US Markets vs GoldThese are the 3 major crisis over the last 25 years. The dot com, 08 and the recent 9% inflation crisis.
Before each crisis get into its full swing, I have observed there was a surge in gold.
In this tutorial, I will share:
1) Why a surge in gold before each crisis?
2) What are the key variables that we should be looking out for this year? and
3) I hope I don’t sound too ambitious in discussing how to time this move?
E-mini Nasdaq Futures & Options
Ticker: NQ
Minimum fluctuation:
0.25 index points = $5.00
Micro E-mini Nasdaq Futures & Options
Ticker: MNQ
Minimum fluctuation:
0.25 index points = $0.50
Disclaimer:
• What presented here is not a recommendation, please consult your licensed broker.
• Our mission is to create lateral thinking skills for every investor and trader, knowing when to take a calculated risk with market uncertainty and a bolder risk when opportunity arises.
Trading the Micro: www.cmegroup.com
CME Real-time Market Data help identify trading set-ups in real-time and express my market views. If you have futures in your trading portfolio, you can check out on CME Group data plans available that suit your trading needs www.tradingview.com

GC1!I am looking a gold for a possible corrective wave, gold has been running hard and it needs a corrective wave to continue running so here is my idea

**Gold Futures: Current Trends and Analysis****Gold Futures: Current Trends and Analysis**
Gold futures have been experiencing significant volatility recently, driven by a combination of economic data, geopolitical tensions, and market sentiment. The price of gold has been fluctuating within a range, with key support and resistance levels being closely watched by traders.
**Market Drivers**
1. **Economic Data**: Recent economic reports have shown mixed signals, with some indicators pointing to a strong economy while others suggest potential slowdowns. This has led to uncertainty among investors, pushing them towards safe-haven assets like gold.
2. **Geopolitical Tensions**: Ongoing geopolitical conflicts and trade disputes have added to market uncertainty. Investors often turn to gold as a hedge against geopolitical risks.
3. **Interest Rates**: The Federal Reserve's stance on interest rates has been a major factor influencing gold prices. Expectations of rate hikes or cuts can significantly impact investor sentiment towards gold.
4. **Currency Movements**: The strength of the US dollar plays a crucial role in determining gold prices. A weaker dollar typically makes gold more attractive to investors holding other currencies.
**Technical Analysis**
Technical indicators suggest that gold futures are currently in a consolidation phase. The Relative Strength Index (RSI) and Moving Average Convergence Divergence (MACD) are showing mixed signals, indicating that the market is indecisive. Key levels to watch include the weekly high, previous day high, and previous week high, which have acted as resistance, and the previous day low and previous week low, which have provided support.
**Current Statistics**
- **Gold Price**: As of the latest data, gold futures are trading at approximately $2,911 per ounce.
- **Volume**: Trading volume has increased by 12% over the past week, indicating heightened interest and activity in the market.
- **Open Interest**: Open interest in gold futures has risen by 8% in the last month, suggesting a growing number of contracts outstanding.
- **Volatility**: The volatility index for gold futures has increased by 4% over the past month, reflecting the current market uncertainty.
**Historical Context**
To put the current trends into perspective, gold prices reached an all-time high of approximately $2,070 per ounce in August 2020, driven by the economic uncertainties brought about by the COVID-19 pandemic. In contrast, gold prices were as low as $1,050 per ounce in December 2015. Comparing current prices to these historical highs and lows can help investors gauge the market's direction.
**Market Sentiment**
The general sentiment among traders and investors is mixed. While some are optimistic about gold as a safe-haven asset amidst ongoing uncertainties, others are cautious due to potential economic improvements and higher interest rates. Monitoring sentiment indicators and trader positioning can provide additional insights.
**External Factors**
Several external factors may influence gold prices in the near future:
- Upcoming economic reports, such as employment data and GDP growth rates, could impact market sentiment and gold prices.
- Central bank meetings, particularly the Federal Reserve's decisions on interest rates, will be closely watched by traders.
- Geopolitical events, such as trade negotiations and conflicts, could add to market volatility and affect gold prices.
**Investment Strategies**
Based on the current trends and analysis, here are some potential investment strategies:
- **Long-Term Holding**: Investors who believe in gold's long-term potential as a hedge against economic uncertainties may consider holding gold futures for an extended period.
- **Short-Term Trading**: Traders looking to capitalize on short-term price movements can take advantage of the current volatility by employing technical analysis and setting clear entry and exit points.
- **Diversification**: Diversifying with other precious metals, such as silver and platinum, can help spread risk and potentially enhance returns.
**Conclusion**
In summary, gold futures are currently in a state of flux, with various factors influencing price movements. Traders and investors should keep a close eye on economic data, geopolitical developments, and central bank policies to make informed decisions.

Stock Market Super Bowl Saga continues...Bulls vs Bears... No clear winner yet. Bulls have possession of the ball. They're in the end zone. They may have scored a field goal kick but no winning touchdown yet.

GC1: Buy ideaOn GC1 we are in a bullish channel situation with the breakout of the vwap by buyers, hence a high probability of an upward trend over a 15-minute time unit. This uptrend will be confirmed when the resistance line is broken forcefully by a large green candle.

Gold is poised for a bullish run; consider long positions for ne
- Key Insights: With gold climbing approximately 85% year-to-date, strong
investor sentiment amid economic uncertainty is palpable. Psychological
barriers near the $3,000 mark can spark further interest. Pay attention to
potential bullish opportunities amidst short-term bearish signals which may
prompt temporary pullbacks.
- Price Targets:
- Next week targets: T1=$2,950, T2=$3,040
- Stop levels: S1=$2,820, S2=$2,780
- Recent Performance: Gold has displayed a robust market presence, notably after
reaching an all-time high this trading cycle. Currently, it stands at
$2,910.69995, with the trend signaling a continuation of this upward
movement. However, a cautious approach is warranted given recent short-term
bearish signals.
- Expert Analysis: Analysts emphasize gold's crucial role as a safe-haven asset
amidst stagflation worries, with many central banks enhancing their gold
holdings. Expectations of resistance near $2,940 to $2,980 could influence
short-term dynamics, but the long-term outlook remains positive, especially
with gold's historical value against inflation.
- News Impact: Recent discussions around delivery issues of physical gold
present potential challenges to traditional pricing and could lead to
noteworthy price divergences. Additionally, concerns about dollar weakness
heighten liquidity risks, making gold increasingly appealing as a secure
financial asset during these volatile times.

My thoughts for GCIm looking for areas of consolidation on a higher time frame preferably the one hour then on the 5min wait for a bullish engulfing to print to enter for buys, now Monday is a holiday so I know NYSE will be closed so for the entries already taken, during Asian opening will only be technical trades, but there is high impact news, and depending on descolations with
Russia, I plan for contiunation buys, but I plan to watch the dollar and the yields for any potential reversals to the. downside

GOLD will set up for bigger moves this weekWaiting for price to set up the move for the week. need to see a low for the week first between tues and Thurs to consider a Long. Just patience is key.

"Gold Extends Wave 5 Amid Strong Demand, Weak Dollar"Gold's recent pullback signals a sub-wave 1 extension of Wave 5, supported by strong demand and bullish momentum. Weakening DXY and rising Japan bond yields confirm a shift to safe havens. With no sell signals, gold is poised for another rally, targeting higher levels.

GOLD - WEEKLY SUMMARY 10.2-14.2 / FORECAST🏆 GOLD – 14th week of the base cycle (15-20+ weeks). The pivot forecast on February 11 worked as a reversal on Tuesday and set a new high. Based on cycle timing, this pivot forecast may mark the top of the current base cycle. The cycle is quite mature. However, we should not forget about strong support at the October 28 extreme forecast level (2850 on the current futures contract).
⚠️ Next pivot forecast: February 24. Next extreme forecast: March 3 – the beginning of the retrograde Venus period, which I mentioned in early December.
👉 The working range of movement for the GC futures contract from the February 3 pivot forecast was between $5K and $10K per contract, depending on the exit strategy. Congratulations to those who entered – a great trade.

Short Selling in Gold MCX and Comparison with Global MarketsShort selling in gold on the **MCX (Multi Commodity Exchange)** involves betting on a decline in gold prices. Traders borrow gold contracts, sell them at the current market price, and aim to buy them back at a lower price to profit from the difference. However, this strategy carries risks, especially in a volatile market like gold.
### Key Factors to Consider for Short Selling in Gold MCX:
1. **Price Trends**:
- Analyze technical indicators (e.g., moving averages, RSI, support/resistance levels) to identify bearish trends.
- Look for signs of weakness, such as breaking key support levels or forming lower highs and lower lows.
2. **Global Gold Prices**:
- MCX gold prices are influenced by international gold prices, typically tracked via benchmarks like **COMEX gold** (New York) or **London Bullion Market (LBMA)**.
- A strong correlation exists between MCX and global gold prices, but currency fluctuations (USD/INR) can cause deviations.
3. **Dollar Strength**:
- Gold prices often move inversely to the US dollar. A strengthening dollar can put pressure on global gold prices, potentially supporting a short-selling strategy.
4. **Geopolitical and Economic Factors**:
- Safe-haven demand for gold during geopolitical tensions or economic uncertainty can drive prices higher, making short selling risky.
- Central bank policies, interest rates, and inflation data also impact gold prices.
5. **MCX-Specific Factors**:
- Domestic demand for gold in India, especially during festivals or wedding seasons, can influence MCX gold prices.
- Import duties and local market dynamics may cause MCX gold to deviate from global trends.
### Comparison with Global Gold Markets:
- **MCX vs. COMEX**:
MCX gold prices are derived from COMEX gold prices but are adjusted for the USD/INR exchange rate. If COMEX gold falls, MCX gold is likely to follow, but a weakening rupee can limit the downside in MCX.
- **Volatility**:
MCX gold can sometimes exhibit higher volatility compared to global markets due to local demand-supply dynamics and currency fluctuations.
- **Trading Hours**:
MCX trading hours differ from COMEX, leading to gaps in prices when one market opens after the other closes. This can create arbitrage opportunities but also increases risk.
### Risks of Short Selling in Gold:
- **Unpredictable Surges**: Gold is a safe-haven asset, and sudden geopolitical or economic crises can trigger sharp price rallies.
- **Carry Costs**: Holding short positions in futures contracts may involve rollover costs.
- **Leverage Risk**: MCX trading involves leverage, which can amplify both gains and losses.
### Conclusion:
Short selling in gold MCX can be profitable during bearish trends, but it requires careful analysis of both domestic and global factors. Traders should monitor global gold prices. Want to learn more connect us on 9325432783

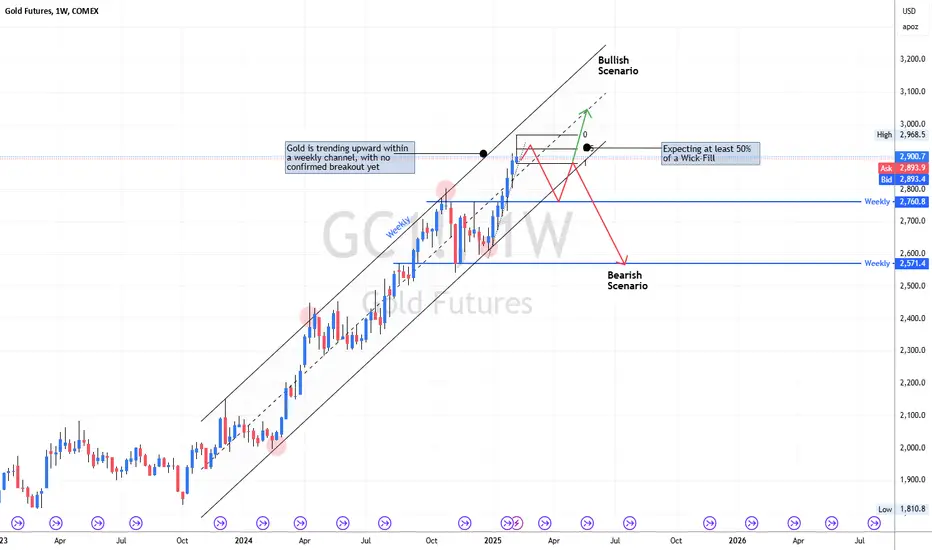
Gold Weekly Analysis – Bullish & Bearish ScenariosCurrent Market Structure:
Gold is trending upward within a well-defined weekly ascending channel and has not broken out yet.
The market is currently near the upper boundary of the channel, meaning a breakout or a potential rejection could occur.
Expected Movement This Week:
Bullish Scenario (Higher Probability If Momentum Holds):
A clean breakout above the channel resistance would signal continued bullish momentum.
The price could consolidate briefly at the breakout level before pushing higher toward $3,000+.
If a pullback happens after breaking out, we expect a retest of previous resistance (now support) before continuing upward.
Confirmation: Strong bullish candles with increasing volume.
Bearish Scenario (If Gold Fails to Break Above Resistance):
If gold fails to break out and rejects from the upper boundary, a correction is likely.
The first key downside target is around $2,760 (weekly level), aligning with previous structure.
A deeper decline could lead to $2,571, which is another weekly support zone.
Confirmation: A strong rejection wick, bearish engulfing pattern, or increased selling pressure.
⚠️ Risk Disclaimer:
Trading involves significant risk and can result in substantial losses. Past performance is not indicative of future results. This analysis is for informational purposes only and should not be considered financial advice. Always conduct your own research and consult with a professional before making any trading decisions.
long the stock will take time for buy because of it volume towards downward side.but eventually it will go high many thanks
