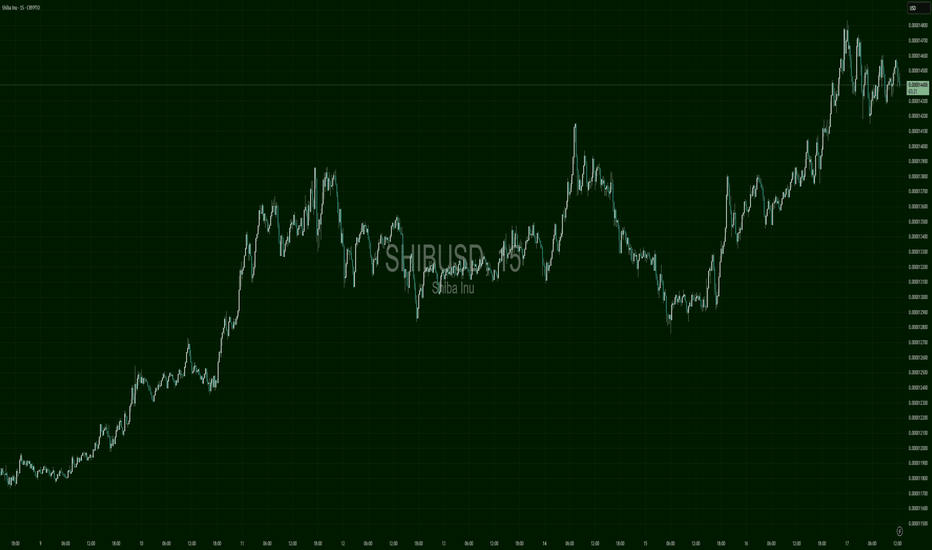
SHIB 8H – Retesting the Golden Pocket with a Familiar SetupSHIB just tapped the 0.618 Fibonacci retracement after a strong breakout leg — and the structure looks strikingly familiar.
We’ve seen this exact move before:
A rally → pullback to golden pocket → explosive extension
Now we’ve got:
✅ Price testing the same Fib zone
✅ Stoch RSI reset and curling upward
✅ A clean local structure that mirrors the last breakout
✅ Clear invalidation if we lose 0.00001131
The current leg is drawn from the early July swing low to the recent top, making this a local continuation play, not a macro reversal attempt.
🔍 Why It Matters:
This is the third time SHIB has pulled back into a high-confluence Fib zone with structure intact. If it holds here again, the next stop could be the prior high — or even the measured move extension at 0.00001850+.
Let structure lead. Let momentum confirm.
One setup. Same zone. Same question:
Will it react the same way again?
SHIBUSD trade ideas
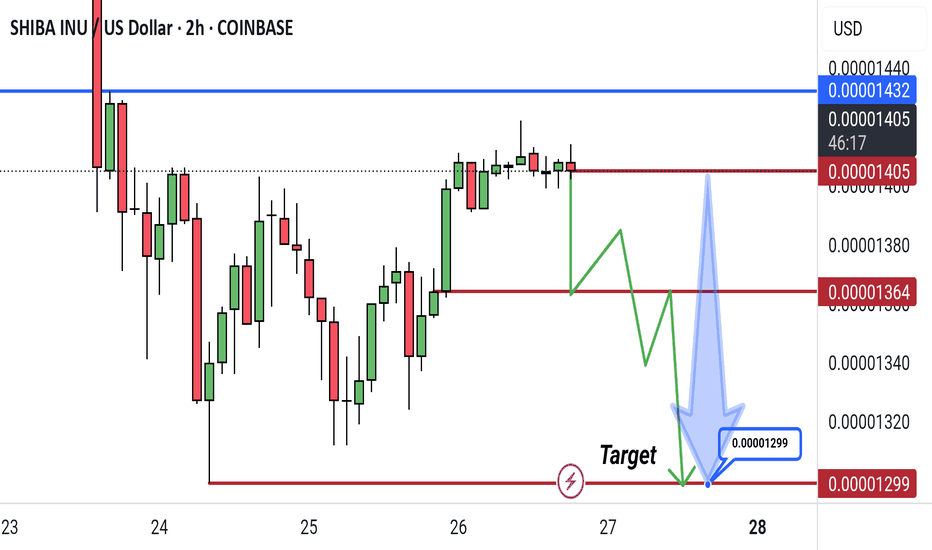
SHIBA INU Bearish Reversal Setup – Targeting 0.00001299SHIBA INU 2H Chart Analysis:
Price is consolidating near resistance at 0.00001402. A potential bearish scenario is outlined, suggesting a drop after a minor bounce, targeting 0.00001299 support. Key resistance levels are 0.00001405 and 0.00001432.
SHIB 8H – Double Bottom at Support, Breakout Structure Loading?HIB has just completed a clean double bottom off a major demand zone on the 8H timeframe, following a textbook impulse → correction → potential reversal sequence. Price structure shows clear symmetry, and the recent bounce aligns with a Stoch RSI reversal from oversold — building a strong case for bullish continuation.
With the key support at ~0.00001200 holding, the white projection shows a potential stair-step return to the upper resistance zone near 0.00001600.
🧠 Key Technicals:
– Major demand zone held strong (previous base of July breakout)
– Double bottom structure forming at support
– Stoch RSI flipped from oversold → confirms short-term momentum
– Clean risk-reward setup toward range high
If SHIB breaks above 0.00001350 with volume, it may trigger the second leg up in this recovery sequence.
Simple structure. Clear reaction. Now price just has to follow the plan.
👇 Comment if you’re in from the bottom, or waiting for confirmation.
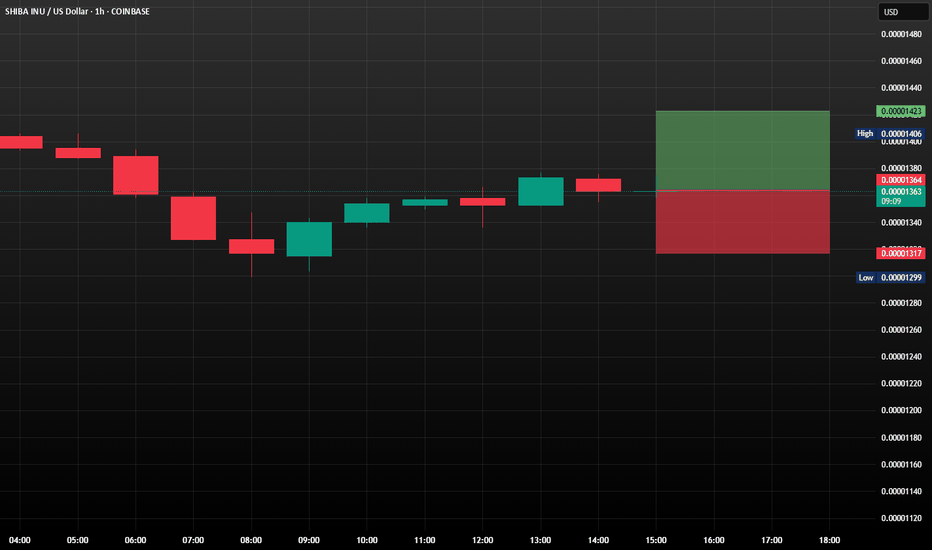
SHIB/USDT: A Fight for Recovery?SHIB/USDT is currently trading around $0.00001363, marking an approximately 11.5% drop over the past 24 hours. However, it's crucial to note that the price is successfully holding above the key support level of $0.00001373.
Recently, we've witnessed a significant increase in the activity of so-called "large holders" or "whales" concerning SHIB/USDT. Their netflow has reached a two-month high, signaling heightened interest. In the past 24 hours, addresses holding at least 0.1% of the total SHIB supply accumulated an impressive 4.66 trillion SHIB, representing an investment of a staggering $63.7 million. These major players clearly believe in the potential for a price recovery.
What's Next? Scenarios for SHIB/USDT
Bullish Scenario (Uptrend):
Should SHIB/USDT successfully bounce off the support level at $0.00001317, it would likely pave the way for further price appreciation. It could potentially reach $0.00001423. If this level solidifies as new support, it would mark a full recovery of today's losses and could initiate a new uptrend, provided that broader market conditions remain favorable. The investment by the whales would be crucial in this scenario.
Bearish Scenario (Downtrend):
However, if SHIB/USDT fails to hold above the support of $0.00001317 and falls below this level (likely due to profit-taking by other market participants), the popular "meme coin" could slip to $0.00001188. Such a development would invalidate the bullish thesis and further reduce investor confidence. The next few days will be critical for SHIB to demonstrate whether it can
maintain its current support levels.
#forex #SHIB #USDT #SwingTrade
Demand ZoneSHIB needs to break out of the downward parallel channel but right now it is below the midpoint of the channel and could be heading to the support of the channel; however the good news it has paused at a Demand Zone. The Bulls need SHIB to clear 0.00001241 and then 0.00001311(which is the midpoint of the parallel channel) SHIB needs to clear the Fibonacci Golden Zone for bullish activity.
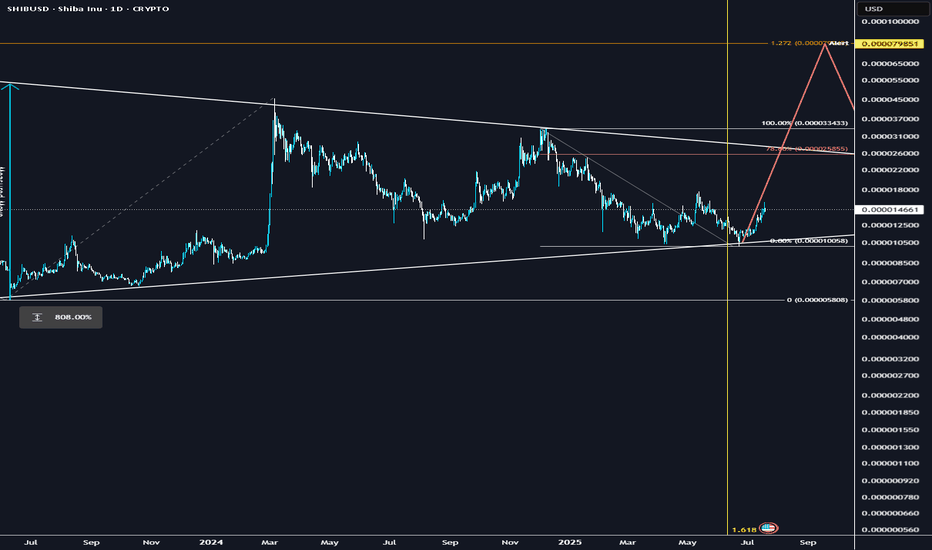
SHIB could explode soon.Multi year accumulation, crossing a significant fib-time pivot, similar set up to XRP.. could follow DOGE once it takes the lead as a catch up trade and rip..
Technical breakout: Above 200-day MA + golden cross formation
Volume surge: Social + trading volume spiking, driving demand
Ecosystem catalysts: Shibarium L2, metaverse progress, aggressive token burns cutting supply
Macro tailwinds: ETH rally + broad altcoin strength
I think it could be one of the leaders before capital rotates into the lower caps
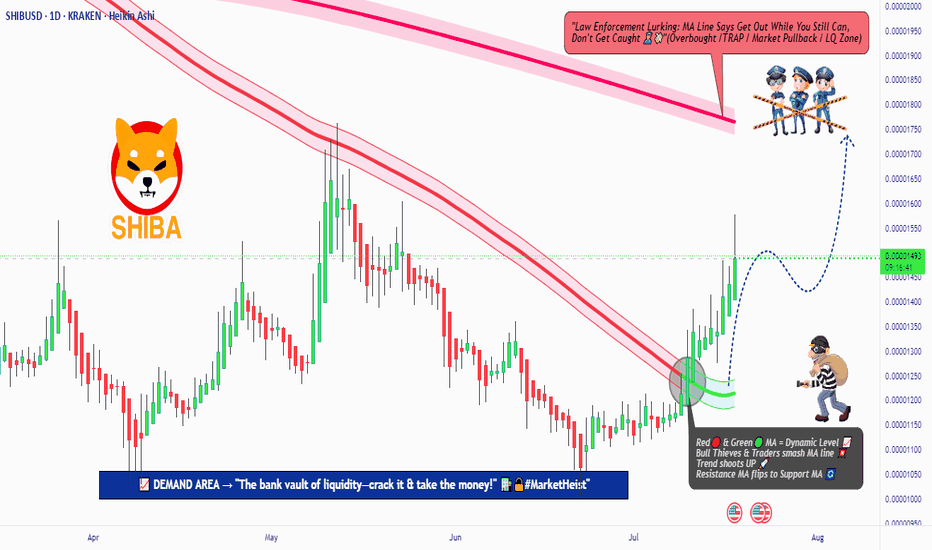
SHIBA INU Heist Plan: Rob the Market, Ride the Bull!💎🚨 "SHIBA INU Crypto Heist Plan: Rob the Market or Get Robbed!" 🚨💎
Thief Trading Style | SHIBA/USD | Bullish Analysis | DCA Heist Strategy | Swing & Scalping Masterplan
🌍 Hey World! 👋 Hola, Ola, Bonjour, Hallo, Marhaba! 🌟
To all the Market Robbers, Bulls in Disguise, and Silent Money Movers — welcome to Thief Trading’s Heist Blueprint 💼🔫 for SHIBA INU vs. USD!
📊 Chart Analysis Breakdown:
Based on my Thief Trading™ Style – a fusion of technical setups, fundamentals, and macro crime-scene evaluations – we’re executing a bold LONG setup targeting a bullish breakout. 🕵️♂️💥
This heist involves breaking past the Police Resistance Checkpoint (moving average red zone), where bearish forces and retail roadblocks stack up.
💹 Heist Entry Strategy:
📍Entry Idea: “The vault's cracked open!”
Longs can be triggered at market price – but wise robbers use precision:
⏱ Place Buy Limit Orders near 15min or 30min swing low pullbacks.
💼 DCA / Layered Entry Method is advised – the more stealthy the approach, the bigger the bag.
🛑 Risk Management:
📌Stop Loss (SL):
Set near recent swing highs/lows on the 1D candle wick zone.
🔒 Example SL: 0.00001300
Remember, SL should scale with your risk appetite, lot size, and number of entries.
🎯 Thief Target:
📍 Target: 0.00001770 or jump off early if the cops (market sellers) start closing in.
You don’t need to wait for the vault to be empty — grab what you can and exit clean.
🔍 Scalper's Shortcut:
Only long-side scalps are valid here.
💰 Big pockets = Fast Entry
💼 Small pockets = Join the Swing Gang
Use Trailing SL to guard your loot and stay agile in the escape.
🧠 Why This Heist? (Fundamentals Insight):
SHIBA/USD is heating up 🔥 due to:
Bullish sentiment in crypto
On-chain activity uptick
Retail momentum shifts
Intermarket cues lining up
📚 Dive deeper into:
📰 News Impact
📊 COT Reports
🔗 On-chain metrics
🧭 Sentiment & Intermarket Guidance
⚠️ Risk Zone Alert:
🚨 News events = Market Chaos
➡️ Avoid fresh entries near news drops
➡️ Use Trailing SLs to lock profits & manage active positions wisely
🙌 Support the Heist Movement:
🔥 Hit the BOOST button if you vibe with the Thief Trading style!
Every boost helps power the team to deliver more precision setups, market heists, and easy-to-follow strategies daily. 💸💎💪
📌 Important Disclaimers:
This is a general market outlook and not financial advice. Always analyze based on your own system and risk tolerance. Markets shift fast — stay updated and adapt.
💬 Comment below if you're on the crew. Let's rob the market together — one chart at a time.
🚀 See you in the next heist, Money Makers! Stay silent, move smart, and steal success! 🤑🐱👤🏆
SHIBUSD – Handle or Hype?SHIB had a strong trend from $0.00001150 to $0.00001480, then saw a healthy pullback into $0.00001330 before bouncing back to retest highs. A potential cup and handle formation is playing out here. Immediate support sits at $0.00001420 — bulls must defend this to confirm bullish continuation.
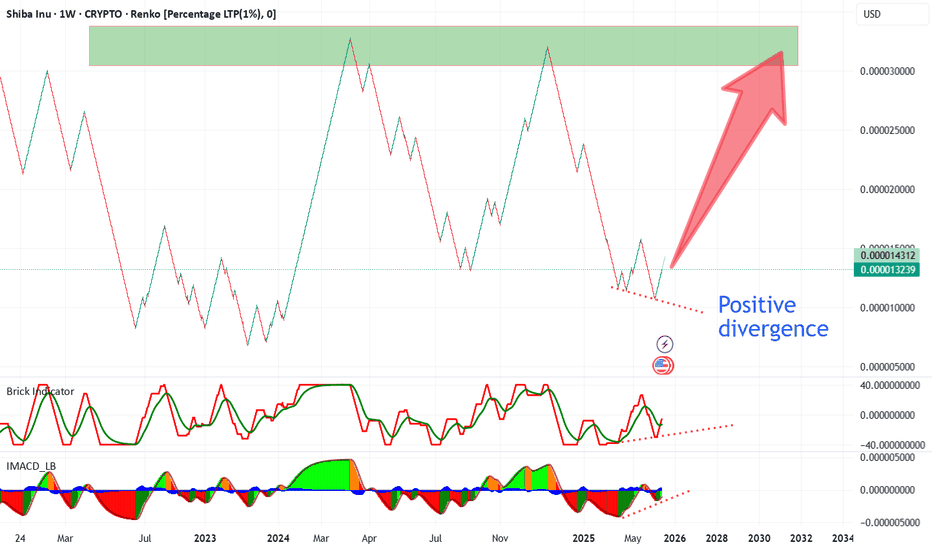
Shiba Inu (SHIBUSD) Weekly Analysis – Positive DivergencePositive divergence detected!
On the weekly SHIBUSD chart (Renko, %), we see a clear positive divergence between price action and both the Brick Indicator and MACD. While the price printed new lows, momentum indicators are forming higher lows, suggesting fading bearish pressure and a possible reversal ahead.
Key Resistance / Target:
The main resistance zone is at 0.000032 USD (highlighted in green on the chart). This level marks a strong supply area from previous cycles and serves as a potential upside target if the bullish momentum continues.
Summary:
Positive divergence on momentum indicators is confirmed.
Bearish trend is losing strength; reversal potential is increasing.
Next key target is the 0.000032 USD resistance area.
⚠️ This analysis is for informational purposes only and is not financial advice. Always DYOR before trading.
SHIB Long Entry Heist Plan – Bullish Setup in Trap Zone🦹♂️💸 SHIB INU Market: The Silent Heist Plan Is Live! 🚨💰
Thief Trading Style | Swing & Scalping Blueprint | High-Risk Zone Masterplan
🌍 Hello Global Robbers & Market Raiders! 🤑💥
Welcome to another secret mission straight from the vault of Thief Trading Style. We're eyeing the SHIB INU Crypto Market, and the time has come for a stealthy bullish strike!
🧠 The Blueprint – Operation SHIB-INU Break-In
We’re executing a bullish move towards the Yellow MA Zone, a high-risk territory filled with consolidations, trap setups, and a potential reversal. The battlefield is tight, but the rewards are sweet for those who play it smart. 🎯💸
🔑 ENTRY STRATEGY – “Vault Access Granted” 🚪📈
💥 Entry Type: Buy/swing
💡 Zone: Pullback entries near swing lows (within 15–30m timeframes)
🕵️♂️ Stealth Entry – Wait for candle signals or limit orders near key liquidity zones.
🛡️ STOP LOSS – “Secure the Exit” 🛑🔐
📌 Placed just below recent swing low at 0.00001050 (30m TF)
🎯 SL adapts to your lot size, trade size, and number of entries.
🏴☠️ TARGET – “Escape Before Alarms Go Off” 🎯💨
💰 Target: 0.00001350
⏳ Optional: Trail your SL and exit on signs of exhaustion.
💼 Scalpers’ Side Mission – “Quick Loot Runs” 🧲⚡
Scalp only on the Long side; use trailing SLs and follow the robbers’ path.
Big wallets? Enter now. Small bags? Wait and follow the swing wave. 🕶️🚀
🧠 Strategic View
Market sentiment remains bullish, but the zone is volatile.
Use macro analysis, COT data, on-chain insights, and sentimental clues for confirmation. 🧠📊
⚠️ Important Notice – Market Hazards Ahead 📉📰
🔔 Watch out for major news releases!
✔️ Avoid new trades during high-impact events.
✔️ Use trailing SLs to guard profits.
✔️ Monitor market developments regularly – stay one step ahead.
💖 Support the Mission
If you love this robbery blueprint, 💥Hit the Boost Button💥 and join the Thief Trading crew for more profitable adventures! Every click fuels our next plan. 🏆💪❤️
📢 See You in the Next Raid!
Stay tuned for more high-stakes missions and daily loot setups!
📲 Follow for the next crypto break-in.
🐱👤🚨 Thief Traders never sleep... we scan, we strike, we secure the bag.
WATCH SHIBThis could be setting up for a
nice rounded double bottom
pattern. Keep watch on SHIB
and I would strongly DCA in at
this key level. We could be
forming a very powerful W pattern
long term...So stay vigilant and
watch for the dips. Even if we went
to all time LOWS you would only be
down 48%...so suck it up and DCA
in at these levels. Trust me...you'll
thank me later when SHIB does an
800x buy end of this bull cycle. BAM!
********** HAPPY SHIB HUNTING **********
SHIB Breaks Out – Time to Ride the Wave! 🔍 Chart Analysis Summary:
🔼 Trade Direction: Long (Buy)
⏱️ Timeframe: 30-Minute
🔔 Breakout Zone: Triangle breakout just confirmed
🟡 Entry Zone: Around 0.000012805 (shown with yellow circle)
🟥 Stop Loss: Below 0.00001214
🟩 Target Zone (TP):
TP1: 0.000013620
TP2: 0.000014205
TP3: 0.000015037
📊 Risk-to-Reward Estimate:
Risk: ~11.74% (clearly shown)
Reward Potential: Up to 2x or more based on targets
Shiba INU - Bottom Buy confirmed istorical Pattern Repetition (2024 & 2025):
The chart suggests that SHIB is following a repeated pattern cycle:
Stage 1 – Falling Wedge (Completed)
Stage 2 – Cup and Handle (Completed)
Stage 3 – W Pattern (Recently Completed)
Stage 4 – Inverted Head and Shoulders (Pending Formation)
Key Highlights:
✅ Buying Zone Identified between 0.00001167 – 0.00001271 USD.
🎯 New Target: 0.00002431 USD, representing a potential 90% return from the buying zone.
⚠️ Breakout Awaited: Stage 4 pattern (Inverted Head and Shoulders) is pending confirmation, which could trigger a major upward move.
🔄 Emphasis on pattern repetition to project future price action.
Conclusion:
The chart analysis suggests that SHIBA INU is mirroring its previous bullish cycle. With three bullish stages already complete and the fourth (inverted head and shoulders) pending, a breakout could lead to a significant price rally targeting 0.00002431 USD.
"Shiba Inu (SHIBUSD) – 4H Triangle Formation and Price StructureSHIBUSD – 4H Technical Chart Analysis
Price recently broke down from a triangle pattern after consolidating near key resistance. A potential retest of the breakdown zone around 0.00001396 is possible before continuing toward the support level near 0.00001041.
Major levels:
🔹 Resistance: 0.00001396
🔹 Support/Target Zone: 0.00001041
The chart highlights structure zones, support/resistance, and triangle pattern behavior on the 4-hour timeframe.
🟡 This content is for educational and informational purposes only. It does not constitute financial advice or a trading recommendation. Always DYOR (Do Your Own Research).
Shiba break outShiba Inu has been in a sideways trend for a year or so. That is about to end.
Technical analysis shows the linear regression downward trend is coming to an end, and we are in the bottom 25% of the Fibonacci Bollinger bands, indicating trade entry here is low risk. The moving average is heading toward the 3-year pivot highlighted in thick yellow. This will be the catalyst to move the price significantly upward. Target is 0.00006
Trend line and Consolidation SHIB at this time is forming a double bottom in a parallel channel on the daily. It's also on an upward trend line and recently made Higher Highs and Higher Lows. However, it is still under the 200 EMA 0.00001602(in orange). If SHIB falls below 0.00001410 and makes a clear break of the downward trendline we might test the Demand Zone around the 0.00001260- 0.00001290 range. Please be careful of fakeouts and liquidation in either direction. Have a nice day.

