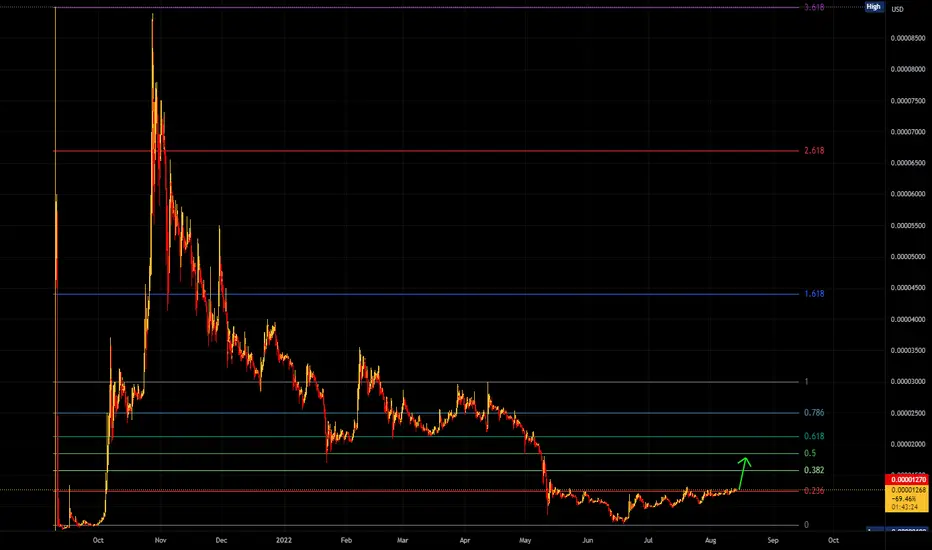
SHIB I created this Accumulaion drop using a Cup and handle pattern. I placed a resistance trend line for the breakout range to watch to retest. I see how often it retests these points to see the strength of either the breakout or the drop if the base is touched more. This trend line in yellow will give you a clear view of the Lower Highs. count the reversals from double tops triple tops so you know how hard your reversal drops can be. When we break out this cup formation we should start to run up from that point. this would require some time in accumulation. Just follow the chart see how this pattern plays out of accumulation and into the expansion phase. I still feel the run up will have a lower high from the initial drop. but will be a good momentum start if we are to have a good run up to the end of year. There is also a Shib v2 thats in the works so keeping alerts on this
SHIBUSD trade ideas


4 Hour Bullish Gartley Visible on Shiba-InuSo long as BTC Can hold out around the $20.85K area we should see Shiba Inu be able to rally off this 4 Hour Gartley


SHIBA: PART 2 OF INCREASE SOON?Shiba is on long term still interested in the possibility that it can have a part 2 increase.
There is no guarantee in markets, but as long Shiba shows that there is a change it's interesting and worth following
Shiba is known for the last 350M to invest whale. that did sell before with breakdown and since short-term buying and hold.
This is not a trading or finance update.
There is no 100% right in crypto.
SHIBA: LONG TERM HIGH TARGETSShiba has in the long term a high chance to break to new HIGH targets.
Shiba is more interesting for the long term as it can show in long term better price action and recovery to before targets.
In the chart, this area sho ws a possible return for SHIBA.

SHIBA : THE MOON INCREASE NEW 30-60%SHIBA has a history of fast movements 30%-60%
And since short-term Shiba holding by more whales, it seems this is for long-term holding, but same time we can't see what is in mind of whales.
markets looking to enter green trend.
Back to TA.
Shiba looks on the TA side well, and it seems it can show some price action coming time.
We have before an increase of 30%, this can happen again.
This is not a trading advice.
Trade safe: there is no guaranty in trading.

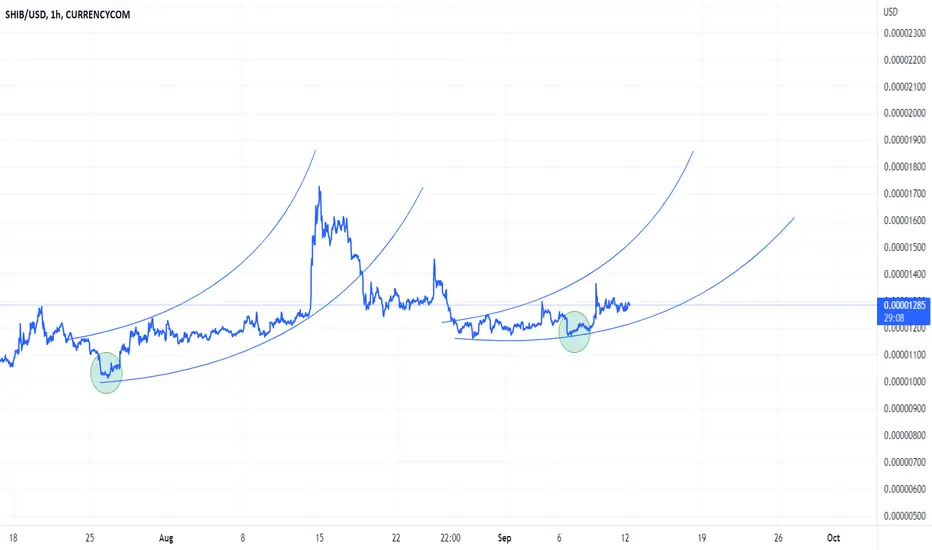
Clear $Shib triple bottom supportHello all,
It’s Prof. Void here. Shib has clearly found support in the 1200-1300 levels.

Shib.usdI considered two points of view for Shiba, but the rise from here to the ceiling and the second one is a drop from here to the floor, I know the possibility of a price drop based on the candles, good luck

Shiba Inu 15 Minute Moving Average Buy SetupShiba Inu has just pulled back after a massive run and is sitting at the 89MA and may be setting up for an additional move up later on.

SHIB C&H (D)Cup and & Handle pattern on the Daily timeframe. Currently forming a falling wedge pattern for the 'Handle' part of the cup. Looking primed for a move up. I predict more consolidation until the end of September where the 'Merge' and Shibarium are rumored to come out. Wealth transfer here we come. When this makes a massive move to the upside know that God is the one who did this and His Glory will be known. #RedSeaMoment #PraiseGod

"S**T COIN" INVESTMENTS, WHICH IS BETTER, $SHIB OR $DOGE?💩🚀This chart maps the performance of Shiba Inu vs. Dogecoin. While this type of investing is not very highly recommended at this time, I have created this to show which may be a better performer in the near future, should anyone decided to make such risky investments/trades. IMO this chart shows and imminent break of the current support level, giving $DOGE the upper-hand for a "short" while. Then $SHIB will take over as it begins to overperform against $DOGE. More than likely (IMO) this will be caused by an initial, substantial rise in $DOGE. Then FOMO over those profits gained by investors will cause others to seek similar profits, directing them towards the next "gamble", which will more than likely be $DOGE's "sibling", $SHIB. Because of $SHIB's wider margins, it will then outperform $DOGE in terms of growth. Also, this may be a strong, bullish signal that retail has now fully entered the market and overall crypto prices may begin to recuperate.

Shiba Inu SHIBUSDT - when next EMA 10❌EMA 100 cross ⁉️shibainu - When next EMA 10❌EMA 100 cross ⁉️
Last time shib gained +1,000%
Past performance is no guarantee of future performance... but next cross will occur... question of time dear Crypto Nation
Let me know your thoughts in the comments 😎
*not financial advice
do your own research before investing

ShibThe Sheba is in an important resistance, you need to break the range down to drop to the bottom 0.000057

MY MINIMALIST CHART ANALYSIS FOR SHIBA INU$SHIBA
On a Weekly Chart
LONG POSITION
08.29..22
1300H +8 SINGAPORE
Disclaimer:
The findings of the following analysis are the sole opinions of the publisher of this idea and should not be taken as a piece of investment advice.
My Published Ideas are not 100% Accurate. There are many factors at a given time that can change the forecast.
ALERT:
Entries for a BULL SWING when $BTC starts up and running.
Based on VITAL SIGNS ( RSI , STOCH , VOL., MA VOL.) RSI still needs to go down at 20-30. It has been accumulating for the past 4 months and is in a zone where it is very attractive for BUYERS.
Bitcoin is also holding strong support at the 20k zone and is shy away from being oversold at the point of the previous capitulation.
1. It is also on its way to a 0.618 FIB RETRACEMENT and we can expect a measured move towards 0.00002450, on top of a MINOR BENTO BOX in light brown for a POSSIBLE PARTIAL EXIT.
2. This may then push towards our possible first exit depending on price action at that given time around the months before the end year.
Hoping that this BENTO BOX CHART ANALYSIS will efficiently help you with your DYOR as we Enter a NEW SWING CYCLE for LONG positions, either short, mid, or long term.
INSTRUCTIONS:
HOW TO USE THIS MINIMALIST CHART a.k.a (Bento Box)
"Follow the white rabbit!"
Just Follow the TOPS and BOTTOMS of the BOXES as a GUIDE to where the MARKET will take you.
If it cannot break a TOP or BOTTOM of a BOX, It signifies a reversal.
TARGET ZONE IDENTIFICATION:
The LARGE BOXES (Tops and Bottoms) are MAJOR turning points that will occur sometime in the future. While the SMALL BOXES (Tops and Bottoms) are MINOR turning points.
These can be entries to a BUY/ SELL POSITION, EXIT/PARTIAL EXIT/TOP-UP AREAS, as well as Support and resistance levels
Also includes MAXIMUM TARGET EXIT AREA OF VALUE - CONSERVATIVE (If price action conditions are right at that given moment.)
NOTE:
1. That PRICE TARGETS for ENTRY and EXITS are DYNAMIC and can CHANGE from time to time.
2. Created on a MONTHLY, WEEKLY & DAILY Analysis of a MARKET'S CHARACTER.
3. My BENTO BOXES are designed for SWING TRADES at the LOWEST or START of a SWING CYCLE.
4. At times I will include a WAY BEYOND PARABOLIC PRICE TARGET, depending on The Character of the Market (CRYPTOS ONLY).
5. DYOR for your Fundamentals, Volume, Chart Patterns, Candlestick Math, FIB COILS ( ABC ), Price Action, FIB LEVELS, Market Dynamics, AB=CD Pattern especially institutional and retailer trading psychology.
Wishing you all The Best Trades and Thank you all for your Appreciation and Support of My Work.
Much thanks to My 3 Mentors. They are so much of a Blessing that I also wish to share my knowledge.
Vive Le Autist!

Let the Chart speak for itselfHuge triangle pattern formed since Jan 2022. We may see a rally down prior to a break out. Is 0.000008 a resemble price point??


Shib.usdShiba, I think that Shiba will either start falling from here i.e. the price of 0.00001243 or from 0.00001351 and in the first stage it will reach 0.00001117 and in the second stage if the decline is intense, it will reach 0.00000959. Good luck.

SHIBUSDFed is still hawkish and will raise rates more than expected we will see the last leg down before we can start buying for long term.

Shib.usdShiba, I think the upward trend line has been broken and the price can make a pullback around 0.00001315 and reach 0.00001121 in the first stage, and if there is a strong downward trend, it can even reach 0.00000979. Good luck.

SHIB next price target, then retracementSHIB next price target, then retracement
$SHIB going back to previous high levels, then healthy re-consolidation before moving higher up. Crypto moves slow, set limit sells and limit buys

#shiba signalWait until it breaks 1350, then set your order, it will give you a good profit i am bullish

SHIB.. getting ready to break out?!I'm not exactly the biggest fan of $SHIB, but i cant help but look at this chart and imagine the possible upside if this breaks up!
ill be keeping a close eye on this going into the start of the next week. With ETH leading the charge, and alt coins performing so well.. if this continues to push, i believe a LONG position to the .5 fib on SHIB would be fairly safe bet.