Another factor in the equationThe MACD may have a bullish cross over below the zero line, that with a strong price breakout from the short term trendline (in yellow on the chart) maybe a glimmer of hope.
SHIBUSD trade ideas

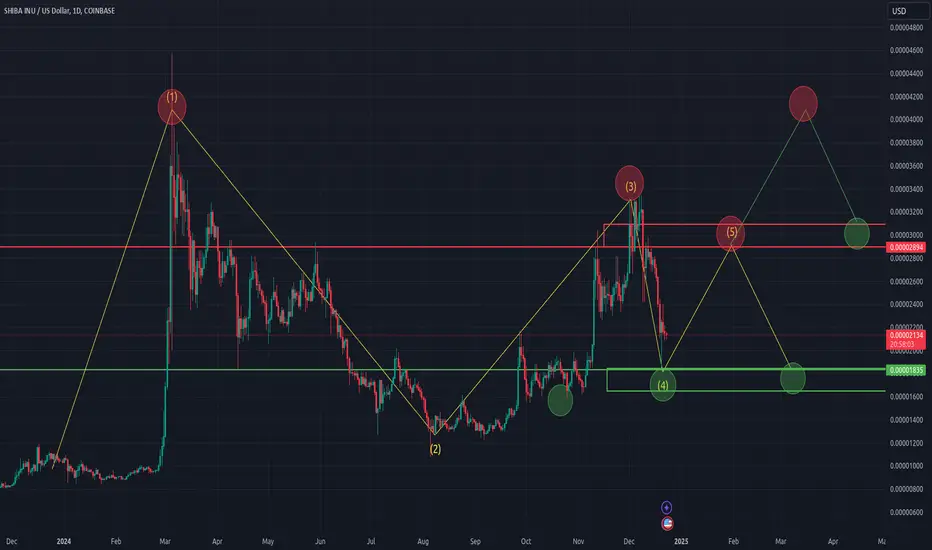
Please be carefulSHIB has broken out of it's main structure and appears to be forming a head and shoulders. Is this the power of tax harvesting, do you see recovery in sight? please kindly comment below.

Shiba Inu Analysis: Key Levels and Trends 24.12.30Hello, this is Greedy All-Day.
Today’s analysis focuses on Shiba Inu (SHIB).
Daily Chart Analysis
The daily chart shows that Shiba Inu recently broke below its short-term ascending trendline, which began in August 2024, within the blue box zone.
After the breakdown, the price formed a long lower wick and bounced back. This rebound occurred near the green box support zone, although slightly above its previous lows, indicating that the green box has strong support.
Key Observations:
Shiba Inu now appears to have entered the yellow box supply zone.
Although it is currently positioned near the top of this zone, if a strong rebound does not occur, the price is likely to continue falling toward the bottom of the yellow box.
Critical Level to Watch:
2056 Satoshi (white box)
This level has not been tested since the sharp decline earlier.
If the price fails to hold this level, there’s a high probability of another test of the green box support zone.
Should the green box support also fail, the price is expected to drop to the bottom of the yellow box zone.
For a Bullish Reversal:
The price needs to break above the red box lower boundary to confirm a potential rebound. Further explanation is provided in the next section.
Ichimoku Cloud and Moving Averages Analysis
To trigger a trend reversal, Shiba Inu must enter the red box supply zone, with the specific level being a 2480 Satoshi breakout.
Key Points for Reversal:
A break above 2480 Satoshi is critical to enter the upper portion of the red box.
This breakout would also mark an entry into the Ichimoku Cloud, currently acting as resistance.
Additionally, it would reverse the direction of the death cross in the moving averages, allowing for a potential bullish shift.
Until Shiba Inu stabilizes above 2480 Satoshi, it’s advisable to remain cautious with buy positions.
Conclusion
Shiba Inu is at a pivotal moment:
Bullish Case: A 2480 Satoshi breakout would mark a trend reversal and provide a stronger bullish signal.
Bearish Case: Failure to hold 2056 Satoshi could lead to further downside, potentially testing the green box and, if that fails, the lower boundary of the yellow box.
At this time, remaining patient and observing key levels is the safer approach. Let’s trade wisely and prepare for both scenarios. 🚀


The SqueezeGood day friends in this mercurial market on the 4 hour chart we have SHIBA consolidating and also a possible BB squeeze.
Per our friend Google "When Bollinger Bands narrow, it indicates that the market or security is experiencing less volatility and may be about to have a significant price move:
This is known as a "squeeze" and suggests that a big move is ahead"" Here on the chart it may appear that BB is narrowing, let's keep our eye on the breakout of the parallel structure, which will act as a confluence. "When Bollinger Bands narrow significantly and the price then breaks above the upper band or below the lower band, it is often interpreted as a strong signal of a potential trend change, signifying a breakout or breakdown, as this indicates a period of low volatility followed by a sudden increase in price movement, often considered a "squeeze" with the breakout signifying a significant price move either upwards or downwards depending on which band is breached; essentially, the market is poised for a large move after a period of consolidation"(Google).


Another viewSHIB fell out of a parallel channel and is consolidating in a FVG while volume appears to decrease, but more fascinating is the possible bullish crossover of the MACD(Chris Moody).
Per our friend Google ("A "MACD bullish crossover" occurs when the Moving Average Convergence Divergence (MACD) line crosses above its signal line on a chart, indicating a potential positive shift in momentum and suggesting a potential buying opportunity as the price may be starting to trend upwards; essentially, it's a bullish signal generated by the MACD indicator when the MACD line moves above the signal line."). Let's see which way this break out is going to go and how long and if there is a potential bullish MACD crossover and for possible divergences.

PossibilitiesIs it possible that SHIB is accumulating above the 200 EMA after it's correction, or is it in another distribution phase before mark down?
It is consolidating in a Fibonacci golden zone and above the 200 EMA. It is at the bottom of it's parallel structure. Long term holders need to see strong price action from the 200 EMA with some other technical confluences. Let's carefully watch SHIB.

WHAT IS QM (SIMPLY)Quasimodo trading setup or QM is an advanced reversal pattern in which its formation signals the end of a trend, and most traders use its variants to improve trading results in the forex market.
If u don't understand it, there is high possibility for stop hunting.
u may heard HEAD AND SHOULDER pattern, yes?
QM is exactly HAD (head and shoulder) and u can trade it at: FL'S _ S&D ZONES and SR lines.
it is also a Great show for money back and u can short it at all.
What invalidates it?
only Do not ENG the first support.

$SHIBAMy humble View on SHIBA INU
We can agree to disagree, but I’ve conducted my analysis based on the Daily timeframe (TF) down to the 15-minute chart for entry. These two areas (marked by blue lines) are on my watchlist. If the confluences align optimally, I plan to enter a position at these levels. My target is to exit 60–70% of my entry position near the Daily resistance level.
Good luck!

SHIBUSD Bullish AnalysisSHIB is range bound however movements tend to be fairly large with this asset after it has finished the inital pump. I show 2 possible bullish scenarios with the green lines indicating the most likely direction for the trade with the red dots indicating a take profit, not a short entry. This is because of the eratic nature of this coin price action could break out above either of the order walls both above and below current price action. These order walls are keeping the price action range bound with sideway movement the most likely scenario at this time. This coin already pumped almost 400% and has already pulled back substantially. Any take profits could lead to substantial cash in a re-entry at a lower price scenario or yield a massive amount of additional coins.
cup and holder pattern for shibashiba is making an interesting and profitable pattern that u can't miss it.
first of all shiba dumped for 70% and it makes the cup
then dumped again to create a holder. as u can see my trigger I'll enter in there.
here we have 3 kind of tp
1:fibo:u can get ur profit by fibo.
2:measure trding: u can see it.
3: max tp:it can touch the piror high. maybe like FO or ENG but with low possibility.
don't forget to tell me ur idea and boost this post.
bye {;

Second scenarioIn this scenario, a neutral triangle will be formed as the E of a higher-degree triangle. If so, we should wait for January then!

[SHIB] SHIBA INU could gain up (+112%) to (+162%)If Shiba closes the year above $0.00003340 that is the value area high from sep 2024 and a yearly level will suggest a possibility of increase up to 2021 highs. The momentum is shifting to bullish in the higher timeframes with moneyflow increasing as well, it is above anchored vwap from sep 2021 to now and above poc from sep 2024 lows to its current price. The target is between fibonacci retracement/extension levels, value area high from oct 2021 to nov 2021 and monthly level.
TARGET: $0.00005791 to $0.00007202 up to (+162%)


Bone ShibaSwap ($BONE): Gearing Up for a BreakoutBone ShibaSwap ( TSXV:BONE ) has captured the attention of the crypto community as it gears up for a potential breakout. A vital part of the Shiba Inu ecosystem, TSXV:BONE has emerged as a governance token with unique utility, a growing user base, and a solid infrastructure in the decentralized finance (DeFi) landscape. Here’s an in-depth look into TSXV:BONE , combining technical insights and fundamental analysis.
What Is Bone ShibaSwap (BONE)?
Bone ShibaSwap (BONE) serves as the governance token for the ShibaSwap decentralized exchange (DEX). It allows holders to vote on upcoming proposals, submit new initiatives, and gain access to the ecosystem’s future developments, including NFTs. The token is integral to the Shiba Inu ecosystem, which includes Shiba Inu (SHIB) and Doge Killer (LEASH), and operates on Ethereum.
The ShibaSwap exchange, launched on July 7, 2021, enables users to trade SHIB tokens for other cryptocurrencies. Within this framework, TSXV:BONE acts as a reward and governance tool. SHIB holders can provide liquidity on the platform and stake tokens to earn TSXV:BONE rewards, which are proportional to the staked amount and duration.
Utility and Governance
TSXV:BONE plays a dual role as a utility and governance token. It’s instrumental in enabling the Shiba Army to vote on proposals that shape the ecosystem’s future. With a capped supply of 250 million tokens, TSXV:BONE ensures scarcity while serving as a reward for liquidity providers and stakers.
Market Performance
TSXV:BONE ’s trading volume has seen a 10.90% increase in the last 24 hours, reaching $12,535,369. This uptick indicates heightened market activity and investor interest. It is currently ranked #450 on CoinGecko, with a market capitalization of $170,795,177.
Despite being 95.59% below its all-time high (ATH) of $15.50, recorded on July 7, 2021, TSXV:BONE has shown resilience. Its current price of $0.675 offers a potential entry point for long-term investors. The token’s all-time low of $0.035888, recorded on August 12, 2021, is a stark contrast to its current valuation, representing significant growth.
Ecosystem Integration
BONE’s integration within the Shiba Inu ecosystem as a bridge between SHIB and LEASH enhances its value proposition. The ShibaSwap platform enables users to engage in token swaps, liquidity provision, and staking, further driving the demand for $BONE.
Technical Analysis
As of writing, TSXV:BONE is up 8.24%, reflecting its cooling-off phase following a significant surge in early December. Trading at $0.675, the token is well below its ATH, making it an appealing option for investors looking to capitalize on its recovery potential.
Relative Strength Index (RSI)
The RSI suggests that TSXV:BONE is in a bearish reversal mode, hovering near support levels. This indicates that the token is consolidating after its recent rally, potentially setting the stage for a breakout.
Market Trends
The broader Ethereum ecosystem, of which TSXV:BONE is a part, has outperformed with a 12.70% increase over the past week. However, TSXV:BONE ’s price performance, up 1.20% over the same period, suggests room for growth.
Key Levels
- Support: $0.65
- Resistance: $0.75
A decisive break above the $0.75 resistance level could signal the start of a bullish trend, while a dip below $0.65 might lead to further consolidation.
Opportunities Ahead
1. Increased Adoption: As the Shiba Inu ecosystem expands, TSXV:BONE ’s utility as a governance and reward token is likely to grow.
2. Market Sentiment: The crypto market’s recent bullish sentiment could fuel TSXV:BONE ’s recovery.
3. Community Engagement: The Shiba Army’s active participation in governance could drive TSXV:BONE ’s demand.
Conclusion
Bone ShibaSwap ( TSXV:BONE ) is poised at a crucial juncture. With its robust fundamentals and promising technical setup, the token holds potential for significant upside. Investors should closely monitor market trends and key support/resistance levels to capitalize on TSXV:BONE ’s breakout prospects. As part of the thriving Shiba Inu ecosystem, TSXV:BONE continues to offer a compelling narrative for DeFi enthusiasts and long-term holders.

SHIB’s Impressive Uphill battleI personally am more of a stock trader - I always thought that if I put my analysis to work on a crypto chart, I’d find major opportunity - but, didn’t even want to get involved in any coins other than BTC and ETH. Random DOGE purchase before the first pop on word from a friend - and most recently SHIBA INU prior to its .000045 pop. I’ve returned this month after pulling up a chart and running through recent time frame action, along with the obvious crypto boom approaching with TRUMP. Decided to throw a small amount in both SHIB, DOGE, and ETH.
But specifically analyzing SHIB, I’m seeing incredibly healthy liquidity building and seeing an increase in bullish volume at created levels of demand. Each time we re-tap a demand zone, we essentially confirm it as a liquidity level that was built purposely to establish A) strong demand and B) a more sustained move up. We’re seeing this happen on the LTF and is fitting into our HTF picture as well (I’m talking known resistance from the last large price boom).
We’ve come to reattempt a break of a known HTF level of resistance now - each time adding liquidity to that zone and increasing the potential of this becoming a level of support in the future. From the HTF perspective, we are closing a HTF cup utilizing a previous liquidity level to create the healthy potential of a larger breakout. It can, however, prove to be an impenetrable resistance zone and be at a natural top of range for the time being.
However, what we’re seeing based on the volume and both rejection and support, we see an increase in bullish buying at higher and higher established demand levels and also an decrease in selling at that same HTF supply zone
At the same time, this same process happens on a LTF level and can prove either stronger supply or demand at lower and tighter levels and indicate where we have become more bullish than bearish based on where the HTF needs to go.
Anyway, bullish SHIB and I personally bought some recently at the ..000027 demand and then again where I identified in the video at that .29 demand grab.
Happy trading and weekend all :)

SHIB broke out from falling wedge 1500% potentialAfter Shib broke out from falling wedge it made 122% move but expect some retest of lower level before going much higher in Q1 Q2 2025
Good entry point could come in late december or january.

I is finishingIt seems that a symmetrical is formed as the final leg of the triangle. So let's wait for the confirmation after breaking the descending trend line.

G as a flat is finishing.Watch out, apparently, C of the flat, the final leg of the diametric will be forming until next week.

SHIB - Bullish While This Horizontal Is MaintaintedIm quite bullish on alts like shib
I want them to succeed
This horizontal if it doesn't break is a bullish reminder for this coin
Alts are going off soon

