SHIBUSDT OLD enough to break the resistance and pump soon While the spots are waking up it seems here we have kind of sleep and dead coin named BINANCE:SHIBUSDT but this turtle🐢 usually pump later than any one else in market and kill the emotions of some holders.
So be patient + wait for breakout of red trendline = Heavy pump and profit coming.
DISCLAIMER: ((trade based on your own decision))
<<press like👍 if you enjoy💚
SHIBUSDT trade ideas

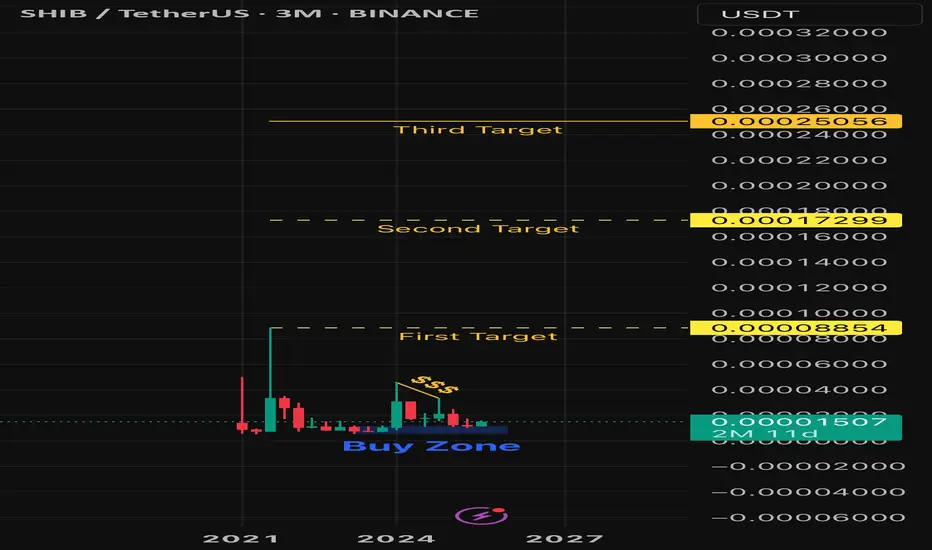
Shib’ I Knew It (targets)Shiba Inu is on its way to its previous all time high and beyond. Will price reach any of my target points this bull run? Who knows? What I do know or at least think I know, is that Shiba Inu is at a discount. Stay tuned!
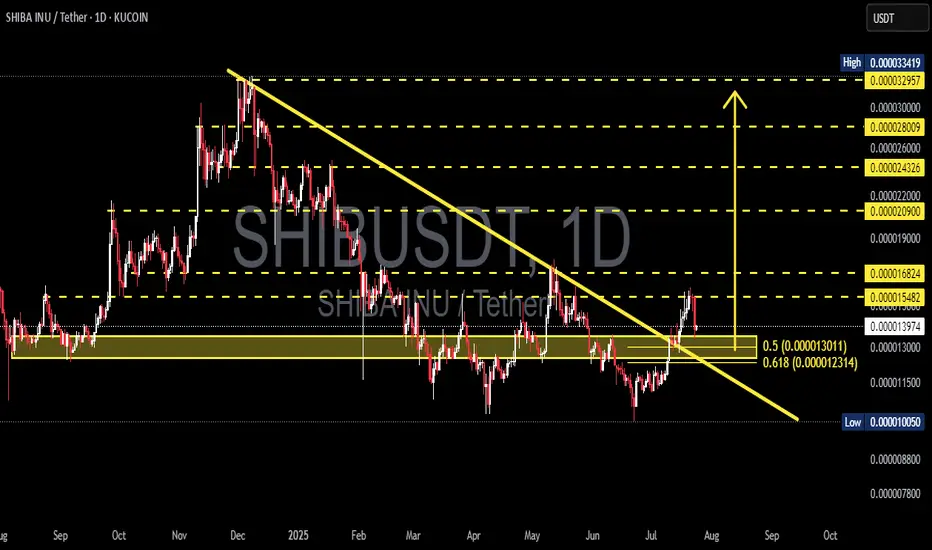
SHIBUSDT | Explosive Breakout from Long-Term Downtrend!📊 Overview:
After months of being trapped in a major downtrend, SHIBA INU (SHIBUSDT) has finally broken out of a multi-month descending trendline that has been capping price action since late 2024. But this isn’t just a minor breakout — this could mark a macro trend reversal, with bullish momentum building up fast.
---
📐 Technical Breakdown (Daily Chart – KuCoin):
🟡 Chart Pattern:
A clear Falling Wedge pattern has been forming since December 2024.
The breakout occurred mid-July 2025 with strong price action and early confirmation from volume.
Falling wedge is typically a bullish reversal pattern — and this breakout confirms that narrative.
🟨 Breakout Zone:
Price decisively broke above the descending trendline and is now consolidating just above it.
A successful retest of the breakout level strengthens the bullish case.
🟦 Key Fibonacci Support – “Golden Pocket”:
The zone between 0.000013011 (Fib 0.5) and 0.000012314 (Fib 0.618) is now acting as strong support.
Known as the “Golden Pocket”, this zone is often where high-probability reversals occur.
---
🚀 Bullish Scenario (High Probability):
As long as price stays above the Fibonacci golden pocket, SHIB is well-positioned for a continued rally. Key upside targets include:
1. 📍 Target 1: 0.000016824 → Previous key resistance
2. 📍 Target 2: 0.000022000 → February supply zone
3. 📍 Target 3: 0.000029000 → Major historical resistance
4. 🏁 Target 4 (Full Extension): 0.000033419 → Potential top of the breakout range
If momentum and market sentiment align, SHIB may be entering a new bullish cycle.
---
🔻 Bearish Scenario (Low Probability, but Manage Risk):
If price fails to hold above the golden pocket:
🔽 Support 1: 0.000011500 → Previous consolidation base
🔽 Support 2: 0.000010050 → Historical demand zone
A breakdown below 0.000010050 would invalidate the bullish structure and shift SHIB back into a prolonged accumulation phase.
---
🔍 Conclusion & Market Sentiment:
✅ The trend has flipped! This is one of the most anticipated breakouts for SHIB holders. As long as the structure holds above the golden pocket zone, the bullish outlook remains very strong.
⚠️ However, beware of potential fakeouts if volume drops or Bitcoin triggers broad market weakness.
---
📢 Trading Setup (Not Financial Advice):
For Bulls: Look for entries around 0.00001350–0.00001300
Stop-loss: Below 0.00001220
Take-profits: 0.0000168 → 0.000022 → 0.000029
For Bears: Wait for breakdown below 0.00001200 to consider short positions
---
🧠 Final Notes:
> SHIB remains a high-volatility microcap token. It's a prime pick for swing traders and momentum hunters — but risk management is key. Keep an eye on BTC for confirmation or invalidation.
#SHIBUSDT #SHIBA #SHIBBreakout #AltcoinSeason #BullishSetup #GoldenPocket #FallingWedge #CryptoSignals #TechnicalAnalysis #BreakoutPlay
Shiba Inu Whales Amass 4.66 Trillion SHIB As Price Falls 12%BINANCE:SHIBUSDT price is currently trading at $0.00001353, down 11.5% over the past 24 hours . The altcoin is holding above the support level of $0.00001368.
The large holders' netflow for BINANCE:SHIBUSDT has recently spiked, reaching a two-month high. In the last 24 hours, 4.66 trillion SHIB were accumulated by addresses holding at least 0.1% of the circulating supply. These whales, who have collectively invested $63.7 million , are betting on a price rebound.
A successful bounce off $0.00001317 would likely pave the way for further price appreciation, potentially pushing BINANCE:SHIBUSDT to $0.00001553 . Securing this level as support could mark a recovery of today’s losses and initiate a new uptrend, provided the broader market conditions remain favorable.
On the other hand, if BINANCE:SHIBUSDT falls below the support of $0.00001317 due to profit-taking, the meme coin could slip to $0.00001188 . This would invalidate the bullish thesis and further reduce investor confidence. The next few days will be crucial in determining if SHIB can maintain its current support levels .

Can Shiba Inu rally 20 percent to hit 0.000015?Hello✌
All previous targets were nailed ✅! Now, let’s dive into a full analysis of the upcoming price potential for Shiba Inu📈.
BINANCE:SHIBUSDT has decisively broken above its descending channel and key daily resistance, supported by fresh, solid volume 📈. This breakout signals strong momentum, with a projected upside of at least 20% targeting 0.000015 🚀.
✨ Need a little love!
We pour love into every post your support keeps us inspired! 💛 Don’t be shy, we’d love to hear from you on comments. Big thanks , Mad Whale 🐋

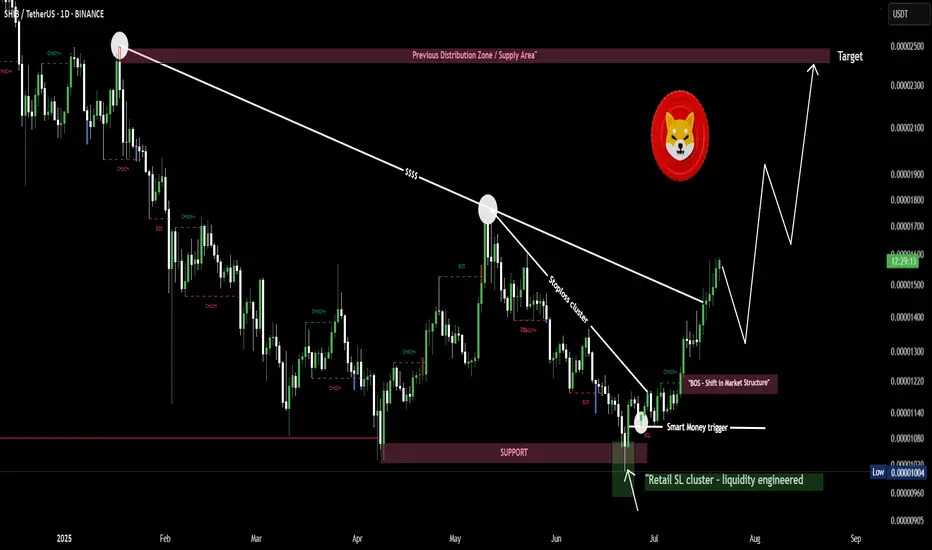
$SHIB/USDT Grabbed liquidity below key support and reversed hardSHIB just gave you a free masterclass in liquidity.
Here’s exactly what happened 👇
2/
Retail panic sold as price broke support.
That break? Engineered.
Liquidity was swept, and price instantly reversed — leaving late sellers wrecked.
3/
Smart money doesn’t chase.
They trap you first, then move the market in their direction.
SHIB is now showing momentum with clean market structure.
Next target: $0.000025🚀🚀
SHIB grabbed liquidity below key support and reversed hard
$SHIB Ready to Move?CRYPTOCAP:SHIB has printed confirmed weekly bullish divergence in RSI and is now attempting to overcome the weekly 200EMA resistance.
A High Volume Node lies just above but a close above this will signal a bullish trend ready to move the initial target of the weekly pivot point followed by the 0.0003579 High Volume Node.
Price completed its retracement to the 'alt-coin' golden pocket 0.786 Fibonacci retracement.
Bearish divergence is currently growing on the weekly RSI but will be diverted with a thrust high!
Is it MEME season? CRYPTOCAP:DOGE also looks ready to go!
Safe trading

SHIBUSDT 1D#SHIB has broken above the descending channel and the SMA100 on the daily timeframe. It is now facing the daily SMA200, and it seems likely that we may see a minor correction toward the support level around $0.00001356. In case of a successful retest, the targets are:
🎯 $0.00001635
🎯 $0.00001891
🎯 $0.00002157
🎯 $0.00002423
⚠️ Always use a tight stop-loss and apply proper risk management.

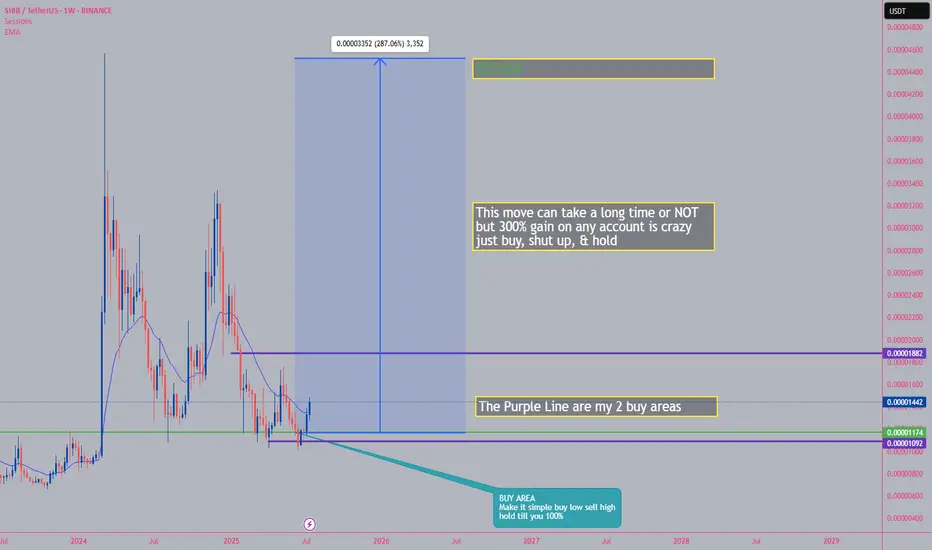
SHIBUSDT first target is +200% after years of sleepBINANCE:SHIBUSDT is not dead or sleep or it wont be any more and i think in this market soon it can see more gain and this +40% until now is just start and at least our first target which is +200% can hit soon like green arrow.
DISCLAIMER: ((trade based on your own decision))
<<press like👍 if you enjoy💚
#SHIBUSDT Weekly Outlook — Mid-Cycle Reversal or Final Retest?🐾 #SHIBUSDT Weekly Outlook — Mid-Cycle Reversal or Final Retest?
🗓 Published: May 10, 2025
📊 Timeframe: 1W | Exchange: Binance
Author: @HamadaMark
🔍 Market Structure Overview
SHIB has completed a multi-year macro compression phase and is currently retesting the mid-cycle support zone, holding above critical levels for now. The chart now reflects two scenarios merging:
A descending macro channel
A forming double bottom reversal near key historical demand
📌 Observed Patterns:
✅ Macro descending channel
✅ Higher low structure vs. 2022–2023 base
✅ Failed breakdown attempt below $0.00001073
✅ Fibonacci levels and price memory still respected
🟦 Key Support Levels:
Main Support Zone: $0.00001103 – $0.00001073
Last Defense / Panic Level: $0.00000535
📛 Breakdown here = cycle invalidation, opens risk for full reset
Lower Historic Floor: $0.00000510 (cycle base)
🎯 Bullish Reversal Targets (Fib-Based):
TP1: $0.00001761 – Previous neckline zone
TP2: $0.00002828 – Channel midpoint / Fib 0.786
TP3: $0.00004176 – Macro W-pattern measured move
TP4: $0.00005842 – Fib 1.618 (Breakout extension)
TP5: $0.00008555 – 2.618 (2021 ATH retest territory)
📈 Potential upside: +200% to +400% if structure holds
🧠 Strategy Insight
• Long-term buyers may DCA in the blue zone
• Higher probability entries on reclaim of $0.000017–$0.000020
• Full confirmation only if SHIB breaks above $0.00002828 with volume
• Panic below $0.00000535 = invalidation of long-term accumulation thesis
💡 SHIB has historically delivered explosive returns after long consolidations — the current zone mirrors past setups.
🗣 What’s Next?
If bulls hold $0.000011–$0.000015 and reclaim mid-range resistances, we enter the next cycle phase.
A W-reversal is forming — neckline breakout will flip sentiment across the market.
📢 This is SHIB's final test — hold the base, and meme season returns. Lose it, and lights go off for a while.
we ask Allah reconcile and repay

DON'T FORGET SHIB IT WILL FLY SOONI've been in this trade for about 5 Months, but patients always pay off no matter if it's 1-2 years it will pay off in the long run thanks you GehavianGoals for holding I'm just thanking myself in this message
SHIB: Keep an eye on this level! Trading Setup
If you’re considering trading SHIB, here’s a quick setup that may help you.
The idea is: Buy when the price breaks above $0.000014 and take profits at the levels shown in the chart.
Targets:
1. $0.0000153
2. $0.0000183
3. $0.000021
4. $0.0000235
-------------------------------------------
About our trades:
Our success rate is notably high, with 10 out of 11 posted trade setups achieving at least their first target upon a breakout price breach (The most on TW!). Our TradingView page serves as a testament to this claim, and we invite you to verify it!

SHIBA | Bullish Breakout ABOVE Ideal Buy ZoneBINANCE:SHIBUSDT
Shiba is know to make big increases in short periods of time... that's why we love it!
The tricky thing about SHIBA is that the pumps can be unpredictable so the best way to ensure a position is to buy as low as possible to the ideal buy zone.
In the weekly timeframe, the technical indicators are not quite bullish yet. The moving averages is still above the price, meaning the bulls have yet to take full control of the price in lower timeframes.
The same can be said for the daily, although we are seeing progress as the 200d moving averages have been reclaimed:
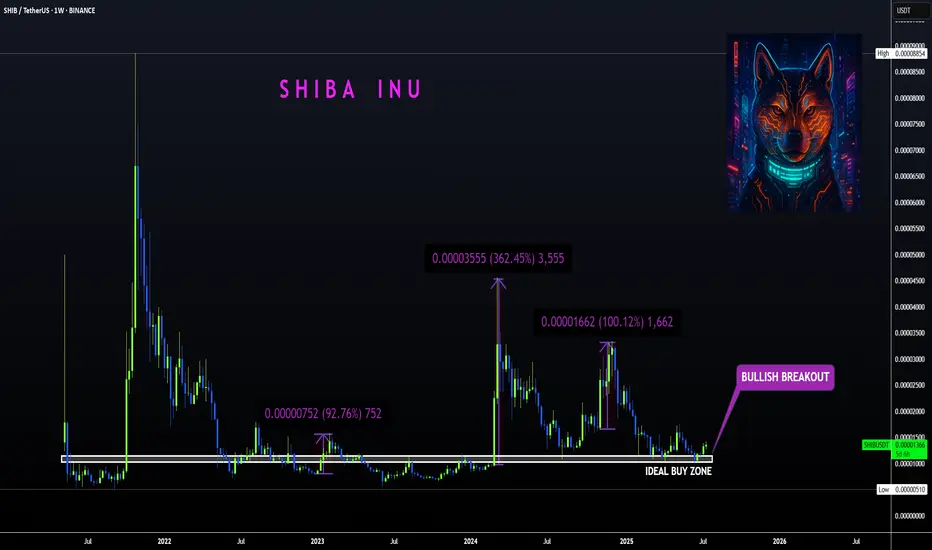
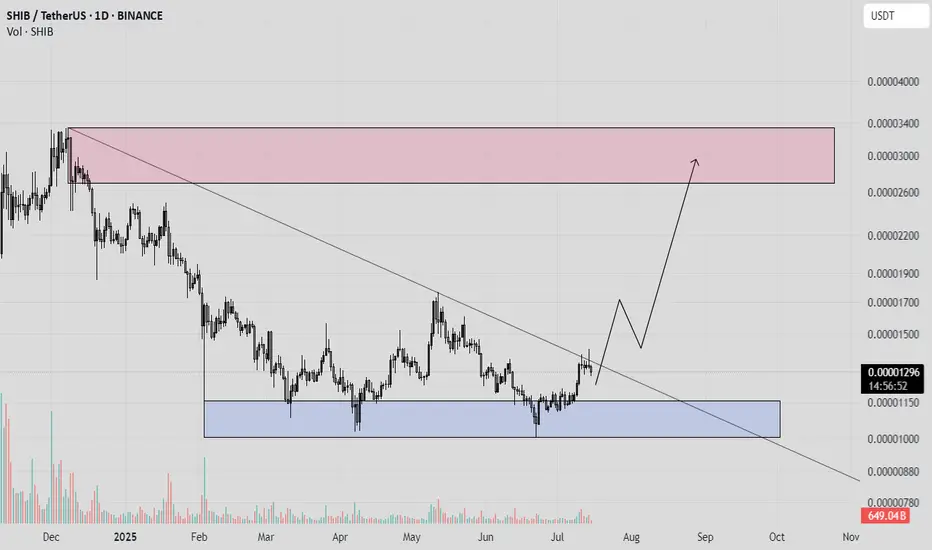
SHIBUSDT🕯 The key resistance level, identified as the best resistance for a break and pump, stands at 0.0000135, with a potential price increase to 0.00001567 if breached, serving as the next target (Pullback level). On the support side, the main level is observed at 0.0000115, and should the price fall below this, it may decline further to the lower Major Level of 0.0000100.
🔽 Resistances:
Main resistance level: 0.0000135 (potential break for pump)
Next target (Pullback level): 0.00001567
🔼 Supports:
Main support level: 0.0000115
Lower level (Major Level): 0.0000100
⚠️Contorl Risk management for trades.

Shiba inuShib usdt Daily analysis
Time frame daily
First target = 0 00001944$
Risk rewards ratio =2 👈👌
Second target = 0.00003
Risk rewards ratio >3.5 👈 👌
The red box that you can see on the screen is very important resistance area.
If Shiba breaks it strongly, second target will be reach
Shiba Inu (SHIB): Looking For Breakout | Do Not Miss It...Do not miss the breakout that we might see about to happen. We are looking for a breakout on SHIB coin where once we get that breakout from the zone of accumulation (sideways channel), we are going to look for further movement to upper target zones from there!
Swallow Academy

SHIBSHIBA INU
Shiba Inu is a meme token inspired by Dogecoin but aimed to take the concept further by emphasizing community involvement.
Everything is clear on the chart.
I wish everyone abundant profits.
Like and follow
for more.
SHIBA INU Heist Plan | Layered Buy Limits + SL Strategy🏴☠️💸**SHIBA INU Heist Blueprint: Rob the Bulls, Outsmart the Bears | Thief Trading Style Strategy (Swing/Scalp)**💸🏴☠️
🌍Hola! Hello! Marhaba! Bonjour! Ola! Hallo!🌍
💰Calling All Market Pirates, Profit Seekers, and Silent Thieves... the vault is open!💰
This is a special market mission for SHIB/USD (SHIBA INU), based on the notorious "Thief Trading Style" — a method designed to sneak in, grab profits, and vanish with style. 💼✨
🧠Backed by a spicy combo of technical, fundamental, on-chain, and sentiment analysis, this strategy is crafted for both swing and day traders ready to infiltrate volatile zones and escape with gains.
🎯The Robbery Plan:
We're targeting a high-risk, high-reward breakout with our eyes on the ATR police trap zone, where market makers often lure and trap traders. Our focus? The sweet spot where consolidation ends, fakeouts begin, and true reversals take off. ⚠️🐍
📥ENTRY (The Break-in):
"The Vault is Unlocked!"
Sneak in using buy limit orders at swing lows or support zones—opt for the 15m or 30m chart to catch pullbacks.
We're stacking orders like a professional thief using DCA (Layering Method) to reduce entry risk. 📊💼
🔎 Entry Zone: Market or limit entries near structure lows—be precise, not greedy.
🛑STOP LOSS (Escape Hatch):
Use the 2H swing low around 0.00001150 as your escape signal.
Risk management is your armor: adjust SL based on your lot size, order count, and trade exposure.
🔒Thief Tip: Never trade without your getaway plan!
📈TARGET (The Safe Zone):
🎯 Primary Target: 0.00001290
Optional: Use trailing SL and scale out profits as the robbery gets hotter.
Scalpers—only join the long side of the heist! If you're packing a big bag of capital, jump in earlier; if not, ride with the swing team. 🚁💸
📊THIEF FUNDAMENTAL FUEL:
SHIB bullish momentum is rising due to macro sentiment shifts, market rotation, whale accumulation, and on-chain volume flow.
Check related macro reports, intermarket insights, and crypto futures data before loading your bags. 🧠📈🔗
🛎️HEIST WARNINGS – Stay Safe!:
🚨 During major news releases, volatility can explode. Don’t get caught!
❌ Avoid fresh entries during news
✅ Use trailing stops to lock gains on existing positions
💖LOVE THIS PLAN? SUPPORT THE CREW:
💥Smash that Boost button💥 to keep the Thief Trading Crew alive and plotting!
We drop fresh heist plans regularly—help us spread the love, grow the crew, and keep stealing profits from the noise. 🚀
📌Disclaimer: This analysis is for educational purposes only—not financial advice. Always DYOR and adjust based on your personal risk profile.
📌Stay tuned for more heist missions. Let’s outwit the markets—one trade at a time.
🤑🐱👤💎 #ThiefTradingStyle #SHIBHeist #CryptoStrategy #MarketRobbery #SmartMoneyMoves

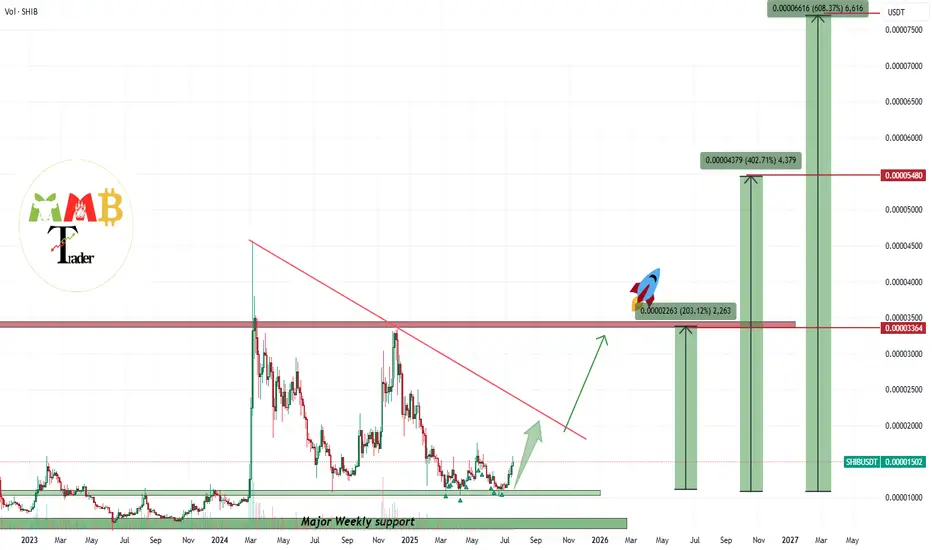
SHIBUSDT Best 3 points to save 600% gainHi as we can see on this chart Price is just starting to pump and hit our 600% Target and even then it is still far from Previous ATH.
Market is getting bullish once again and we are looking for rise and gain here too and our targets are all mentioned on the chart and major pump will start after breakout of red trendline.
DISCLAIMER: ((trade based on your own decision))
<<press like👍 if you enjoy💚

bullish simetrical pattern weekly corrective simetrical triangle done... now it should go up so fast .

SHIB NEXT TARGET#SHIB
Shiba Inu is forming a descending channel pattern on the daily timeframe🔍
The price is consolidating above the midline support and is currently testing the MA 50💁♂️
Breaking above this MA could drive the price toward targets at $0.00001500, $0.00001750, $0.00002050, and $0.00002500🎯

Shiba Inu Still Early Massive Wave yet Bullish —1,558% PPThe blue pattern on the chart is an analog of the purple pattern but bigger.
It is still early for Shiba Inu (SHIBUSDT) because the action is happening below MA200. The long-term bullish bias is only confirmed once the action moves and closes above this level.
This shouldn't be considered bearish because we have a clear higher low based on the two different consolidation patterns. The purple one produced the main low and the blue one the higher low. Multiple higher lows.
Lows—support confirmed—in August 2024, April & June this year. And that's it. This weekly candle is now full green and everything is about to turn positive crazy. Shiba Inu has been bearish since March 2024.
There was some bullish action in November 2024 but it ended as a lower high, what a bummer. All this time with no new highs, no major growth. This cycle is coming to an end. The null cycle, the boring cycle, the little-to-no-profits cycle is over... That's awesome. What does Shiba Inu has in store for us?
A new all-time high to start. Maximum growth. Euphoria, higher prices; growth. It will be awesome.
I am giving you all of the targets for Shiba Inu (SHIBUSDT). The highest one is 0.000220491. Total profits potential reach 1,558% from current price.
There are two resistance levels of interest below the previous ATH: 0.000067612 & 0.000057511.
Minimum new 2025 all-time high we will go for 0.000103188 for 676%.
You can find more numbers and targets by doing a close-up on the chart.
I hope you find this information useful.
Your support is appreciated.
Namaste.
