SHIBUSDT: Break out, retest and confirmation!!Join our community and start your crypto journey today for:
In-depth market analysis
Accurate trade setups
Early access to trending altcoins
Life-changing profit potential
Let's analyse SHIBUSDT both fundamentally and technically.
FUNDAMENTAL ANALYSIS:
Shiba Inu (SHIB) is a meme-based cryptocurrency launched in 2020, inspired by the Shiba Inu dog breed. It operates on the Ethereum blockchain and aims to build a decentralized community. Originally created as a playful experiment, it has gained popularity and features like ShibaSwap, a decentralized exchange. Despite its lighthearted roots, SHIB has attracted significant investment and speculation.
TECHNICAL ANALYSIS:
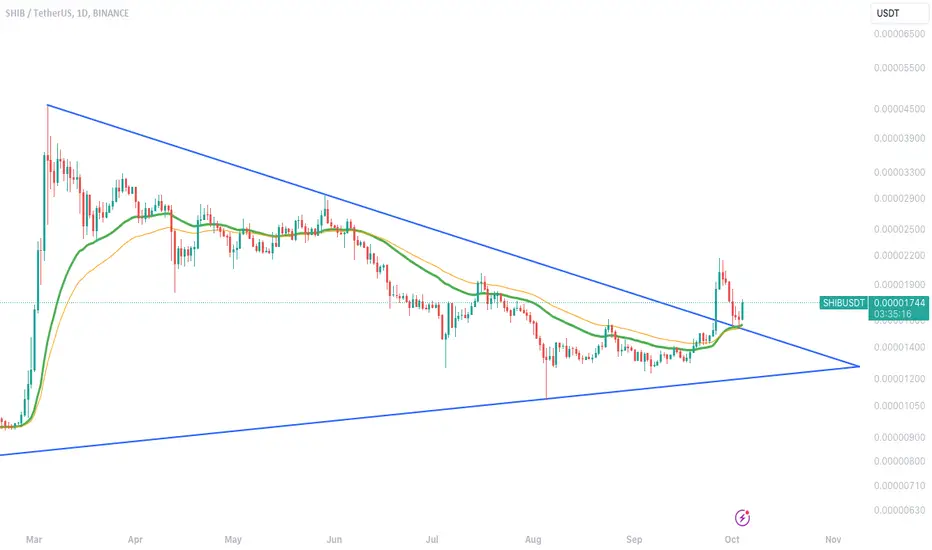
SHIBUSDT has demonstrated a bullish breakout from a descending triangle pattern, followed by a successful retest and a confirmatory candle. The price is currently supported by the 50-day Moving Average (MA).
A significant price increase is anticipated, as indicated by the substantial surge in Shiba Inu's trading volume within the last 24 hours, reaching $510.90 million. This surge suggests increased activity by Whales.
Entry Zone:
CMP to $0.00001567
Targets level:
Expecting 200% to 300% move
If you find this analysis helpful, please hit the like button to support my content! Share your thoughts in the comments and feel free to request any specific chart analysis you’d like to see.
Happy Trading!!
SHIBUSDT trade ideas
SHIBUSDT after more range +100% pump ahead As we cam see price is now near major daily supports and we are looking for heavy pump here once again like past like green arrows on chart.
first target is at least +100% pump also major supports and resistances mentioned on the chart.
DISCLAIMER: ((trade based on your own decision))
<

resistance from 2021 flipped to support in 2024 :)boost and follow for more ❤️🔥 I'm seeing a major trend from 2021 flip to support here on the latest dip, maybe a bit more consolidation down here but a end of year rally is likely and all my targets hitting early 2025 is the most likely scenario 🤔
ill post some more shib updates in the near future, see y'all soon ⚡

SHIB/USDT Trading Scenario UpdateAfter a significant increase in February and reaching a local maximum of $0.00004575, the price declined to the $0.00001080 mark, which represented a drop of over 76%. As a result of this decline, the quote nearly reached the POC volume level at $0.00001032.
Near this level, a rebound was observed, followed by an attempt at recovery. From the perspective of Fibonacci levels, the current asset price is within a favorable range for purchases (between 1 and 0.75).
In this range, medium-term purchases can be considered with a target price of $0.00002746, which corresponds to the 0.5 Fibonacci level.

Shiba Long-Term Bull-Market Accumulation Zone To Become ActiveAs we get closer and closer to 2025, the Altcoins market is preparing to enter the last accumulation phase of 2024. This will be the last chance to buy at low prices before the major 2025 bull-market.
The accumulation phase should last several months, so there will be time. The current bearish action we are seeing across the market goes in accordance with the trade-ideas we shared in early August, the "Pre 2025 Bull-Market" series. This series predicted one final drop where our favorite Altcoins enter an accumulation zone before major growth.
We talked about the buy and hold strategy and went deep into trading methods, the basics, market psychology and more. You can find these articles by going to my profile and going back to early August.
It seems this is actually happen. And if this comes to pass then we can have more certainty that also 2025 will come to pass, because everything is going as planned.
Shiba Inu (SHIBUSDT) produced a small rise, nothing surprising, just three weeks green. Some Altcoins took this time to grow super strong, others remained asleep. That's what I mean when I say that not everything will move. Everything moves but not with the same force, strength and magnitude.
Some will grow stronger than others and some will definitely remain blank in 2025. Shiba Inu will grow in 2025 so all is fine.
So the drop should last a few weeks. The recovery should last several months and in 2025 we get long-term sustained growth.
This is a general view of the chart and market. We cannot be hurt by something we know is going to happen. If we know it is going to crash in advance, we can prepare and adapt. We can only be hurt by price action if we are caught by surprise. No surprise here, we are well aware.
➖ If we have experience, we can sell and buy back lower.
➖ If we are beginners, we can simply hold because the whole process will only last a few months.
Whatever you do is up to you. My job is to alert of the event before it happens and you can use this information in the best way you can.
Thanks a lot for your continued support.
Namaste.

SHIBA. USDTIn my opinion, this point can be supported.
If Shiba decides to come back.
But it should be noted that the Shiba cryptocurrency has the potential to continue correction in the daily time frame.

SHIB PriceA falling channel breakout was spotted on the daily charts, and the memecoin retested the breakout region yesterday. The ongoing structure gives an idea about the bull rally ahead.

Shiba In (SHIB) shows bullish head and shoulders patternSHIB, the second-largest coin, plunged over 8% during Monday’s U.S. market trading hours. The sharp plunge can be attributed to Bitcoin drop below $65,000, with an intraday loss of 3%. With the meme cryptocurrency sector often volatile to new market changes, the Shiba Inu price hints at a potential retest to $x. support. Will the uptober rally sentiment trigger a major reversal?
Since last weekend, the Shiba Inu price witnessed a notable correction from $0.0000217 to $0.0000178, accounting for an 18% drop. The bearish turnaround likely coincides with the broader market pullback as Bitcoin drops below $65,000 on Monday. With sustained selling, the SHIB price could tumble another 9% before retesting suitable support at $0.000016.
The aforementioned level, coinciding with a bullish crossover of 20-and-100-day exponential moving average after 100 days, could recuperate the bullish momentum. The potential reversal will likely reveal a bullish reversal pattern called Inverted Head and Shoulder in daily charts.
The chart setup consists of three lows, where the middle low (the “head”) is the lowest, and the two outer lows (the “shoulders”) are slightly higher. If the pattern holds true, the Shiba Inu price could rebound from $0.000016 and rechallenge the neckline resistance at $0.000022.
On the contrary, if sellers drive a breakdown below the $0.000016 level, the buyers would also lose EMAs support and invalidate the bullish thesis.

Unlocking Potential: Guide to Buying SHIBUSDT on SpotIn this detailed guide, explore the intricacies of buying ShibUSDT on the spot market. We'll cover the essential strategies for timing your purchases, managing risks, and understanding market signals. As Shiba Inu continues to gain traction in the crypto community, this guide will help you navigate the volatility and make informed decisions. Whether you're looking to diversify your portfolio or ride the wave of Shiba Inu's popularity, this guide provides the tools to optimize your spot trading experience.

SHIB Is BullishFrom where we put the green arrow on the chart, it looks like a big bullish triangle is over.
By maintaining the green range, it can move towards the targets.
The targets are marked on the chart.
Closing a daily candle below the invalidation level will violate the analysis
For risk management, please don't forget stop loss and capital management
When we reach the first target, save some profit and then change the stop to entry
Comment if you have any questions
Thank You
shibahello everyone
Shiba either returns to the bottom of the channel and adds a zero, or breaks and stabilizes the channel ceiling and reaches the next target.
What do you think?

#SHIB time is coming? Looking at meme charts, shib have to be one of the best at entry, though already high mcap only time will tell if it will go above the last ath
here's a better look at dex chart

SHIB Major Trend. 09 2024Logarithm. Time frame 1 week.
Line chart , without market noise.
Secondary trend. Channel Zone.

SHIB/USDT Secondary trend. Channel. 14 months accumulation.Logarithm. Time frame 1 week for clarity of the channel range. 3 weeks ago, there was an exit of the price under the support of the accumulation channel by a large percentage. Many long positions were liquidated.
The chart shows the percentages from this reversal zone to the channel resistance, as well as the average profit percentage when exiting this accumulation channel from the average set price to the significant first resistance.
This is what the chart of this cryptocurrency looks like on a line chart without the “market noise” volatility.
Accumulation Zone. Pump/Dump and compliance with risk and money management.
Remember, this is a pamp/dump meme cryptocurrency, which even at -93% down from peak pumping and with a set zone of about 14 months (!) is at an inadequate profit. That's why follow risk management in your work.
It is more rational to work on such cryptocurrencies, not with stops (high volatility, slippage at high %, high probability of beaten out before price increase, the large value of stop is meaningless, they can beat out at -2% and -40%), and work from average buy/sell price (only spot!) with reasonable observance of money management.

SHIB ANALYSIS (update)🔮 #SHIB Analysis - Update 🚀🚀
💲 As we said earlier #SHIB performed the same. More than 40% move already done in #SHIB Now we can see a little retest from its major resistance zone and after that a bullish move would be seen
💸Current Price -- $0.00002127
📈Target Price -- $0.00002747
⁉️ What to do?
- We have marked crucial levels in the chart . We can trade according to the chart and make some profits. 🚀💸
#SHIB #Cryptocurrency #Breakout #DYOR

Shiba Inu (SHIB) price prediction amid 15% daily rallyShiba Inu (SHIB) recorded a sharp upswing on the 26th of September, posting 14.5% gains and extending its monthly recovery to 35%.
This remarkable performance eclipsed even Bitcoin (BTC), which posted 2% on the daily charts and remained quiet overall.
However, the SHIB’s upswing retested a key hurdle, which begs the question: Can bulls mount above the roadblock and push forward?
The stochastic RSI and RSI flashed bullish signals on the daily chart, underscoring a strong buying pressure for SHIB in the past few days.
However, they also indicated overbought conditions, which often signal a potential price reversal. Given the bullish market structure, the uptrend momentum could continue.
If so, late bulls could seek re-entry after breakout or retest above the resistance at $0.000001763 (marked white) or $0.000018 (April low).
The bullish target would be the 200-day Moving Average (MA) at $0.000020. The bullish target would offer 15% or 11% potential gains based on the two entry positions.
That said, a daily candlestick close below $0.000017 would invalidate the above bullish thesis. SHIB could front a pullback to $0.000015 in such a muted scenario.

SHIBUSDT (SHIBA INU) Updated till 27-09-24SHIBUSDT (SHIBA INU) Daily timeframe range. finally we can see a move here almost close to 0.00002009 resistance. it do have potential to cover more space depends on retail interest. some cash flow into mcap also can help. recent support at 0.00001570.

Alikze »» SHIB | Upward wave 3 scenario🔍 Technical analysis: The scenario of the 3rd wave of the rising super cycle
- In the analysis presented in the previous post , after an upward wave up to the area of 2.618, the previous wave itself experienced significant growth.
- Currently, in the weekly time frame, after going through a downward trend in a channel, it managed to have a complex structural correction to the green box range, which led to an exit from the channel.
- Therefore, according to the current momentum, it will have the ability to reach the target of Fibo 1.618 range and then up to its previous ceiling.
- After that, if the previous ceiling is broken, the rising wave can extend to the specified supply area.
💎 In addition, if the previous floor or green box of stabilization occurs, the bullish scenario will be invalidated.
»»»«««»»»«««»»»«««
Please support this idea with a LIKE and COMMENT if you find it useful and Click "Follow" on our profile if you'd like these trade ideas delivered straight to your email in the future.
Thanks for your continued support.
Best Regards,❤️
Alikze.
»»»«««»»»«««»»»«««
BINANCE:SHIBUSDT

Shiba Inu Long-Term Bull-Market Price Dynamics ExplainedA bullish trend, uptrend or bull-market, is defined by higher highs and higher lows.
Shiba Inu (SHIBUSDT) hit bottom in June 2023 and proceeded to produce a strong bullish wave. The recovery wave or initial bullish breakout. Phase 1 of the bull-market.
This wave peaked in early 2024, March, and produced a classic correction.
This correction ended in early August 2024. This low ended as a higher low compared to the low that was hit in June 2023. This means that we are in bullish territory.
Right now we are seeing strong bullish action and potentially the resumption of the bullish trend/move.
Now, this move can hit a lower high compared to the peak in March, then another higher low followed by higher prices... This is a long-term process and will continue to develop for more than a year. This is explained in detail in the SEIUSDT trade-idea which is shared here for your convenience.
➖ SEI | Altcoins vs Tether Map Revealed (Phase 1)
Regardless of how the short-term action develops, we are set to experience long-term growth. We are set to experience higher and higher until a major new All-Time High in 2025. This will happen during the bull-run phase of the bullish cycle, most likely late 2025 but in some cases it can happen in mid-2025. Allow for strong variations across the market.
Specifically for Shiba Inu it is likely to happen Q3-Q4 2025, that is, the new All-Time High.
Maximum speed across the entire market should be fully present after February 2025. At this point, March 2025 and onward, everybody will be aware of the bull-market. If you are reading this now, you are early and have an amazing opportunity right in front of you.
Thank you for reading.
Your support is appreciated.
Namaste.

Shiba Inu | SHIB analysisThe price of Shiba Inu is $0 .0000 116 today with a 24hour trading volume of 355 million dollar. This represents a 3% price increase in the last 24 hours and a 7% price increase in the past 7 days.
Data from the Ethereum blockchain has revealed that the recently launched Koyo token project has moved forward with a major burn of the meme inspired cryptocurrency Shiba Inu , helping its burn rate skyrocket.
According to the data, first spotted by users on Twitter, Koyo burned an astounding 1.49 billion SHIB tokens in a transaction that helped the burn rate of the meme-inspired cryptocurrency surge over 30,000% in the last 24-hour period. this isn’t the first time Koyo has burned a large amount of SHIB, as earlier this year the project moved 1.1 billion tokens to a dead wallet as well. Koyo, which exclusively debuted on the ShibaSwap DEX last month, has aided Shiba Inu in diminishing its vast supply by 8.75 billion SHIB tokens through various transactions directed to “inferno” addresses since its inception. Shytoshi Kusama, SHIB’s lead developer, recently shared his thoughts on the relationship between Shiba Inu’s price and burns in a telegram chat. According to Kusama, the price of Shiba Inu cannot be influenced solely by burns.
In response, the Shiba Inu team has been focused on developing new technologies and utilities to foster SHIB adoption. Kusama believes that only through such efforts can Shiba Inu prices experience the significant increase that everyone desires.a massive SHIB whale has recently expanded its portfolio to nearly 5 trillion tokens after adding an additional 171.68 billion SHIB for around $1.88 million through four different transactions.notably, data from IntoTheBlock has shown that a significant portion of SHIB tokens are now in the hands of long-term investors, highlighting the growing allure of the token among those with an extended investment outlook.according to the firm’s data, holders who have retained their SHIB tokens for over a year cumulatively possess 687.17 trillion CRYPTOCAP:SHIB , valued at more than $7.20 billion. These long-term investors now command nearly 70% of Shiba Inu’s circulating supply.
Meanwhile cruisers or market participants who have held their Shiba Inu tokens for one to 12 months, account for 232.54 trillion CRYPTOCAP:SHIB , equating to over $2.43 billion in value. This group represents 23.65% of the token’s total supply.
Lastly traders or those who have maintained their SHIB holdings for less than a month, control 63.55 trillion SHIB, which amounts to over HKEX:650 million and constitutes less than 6.5% of the cryptocurrency’s overall supply. Meanwhile the beta test network for Shibarium is named PUPPYNET. As per the blockchain explorer BlockScout, currently (i.e., as of 8:37 a.m. UTC on April 15, the beta version of Shibarium has successfully executed more than 3,234,886 transactions. Data from this PUPPYNET explorer indicates that the number of wallet addresses utilizing Shibarium beta has reached 5,833,825. Presently, the gas fees are 1.01 Gwei, which is virtually cost-free. now lets talk about the price
shib army are ready for 0. 000012 , 0. 000013 and 0. 0000135

SHIBUSDT Is a Major Bullish Breakout About to Happen??Yello, Paradisers! Could #SHIBUSDT be on the brink of a massive bullish breakout? Let’s break it down.
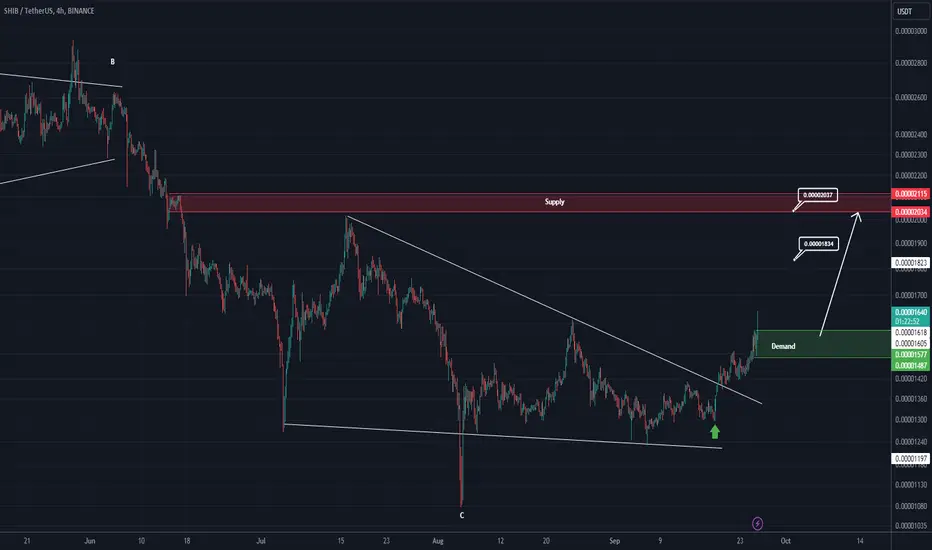
💎#SHIB is showing promising signs of bullish momentum after successfully breaking out of a reversal pattern with a strong green candle. If SHIB can push through the key resistance level around 0.000021, we could see a clear confirmation of the bullish trend in the short term, potentially hitting our target at the next strong resistance level.
💎However, if SHIB struggles to break the resistance at 0.000021, there is still an opportunity to catch it on a retest of the support zone at 0.0000143. This area presents a high-probability buying opportunity, as the price could rebound and resume its upward trajectory.
💎But beware, if SHIB fails to hold the support at 0.0000143 and breaks below, this would signal a dangerous shift. A daily candle close below the support would confirm a bearish trend, leading to a potential fall back into the demand zone. At that point, the bullish scenario would be invalidated, and we’d be looking at a possible longer-term downtrend.
Remember, Paradisers, disciplined and patient trading is the key to long-term success.
MyCryptoParadise
iFeel the success🌴

SHIB on the Move up! Shib just cleared a significant resistance level, and the chart shows a clear uptrend. Moving averages are crossing, suggesting more upward pressure in the short term.

SHIB - +43% upside with 1:3.5 RR Nice breakout here.
Risky because BTC is showing some weakness at 64k but it should easily push higher and has plenty of room to revert to mean.
