SHIB/USDTIts good for spot!
A memecoin that all of you know it!
2 step is logical for buying according to DCA !
stoploss will be activated if daily close seen under the last step...
SHIBUSDT trade ideas

Alikze »» SHIB | Bullish Flag🔍 Technical analysis: Bullish flag in corrective zigzag wave 4
According to the analysis presented in the previous post, wave 3 or rising C in the area of 2.618 Fibo of the previous wave itself was completed.
💎 But now in the 1D time frame a bullish flag is formed in the form of wave 4 zigzag.
After exiting the congestion and descending channel in the supply range, it has faced selling pressure.
💎 Therefore, it can be offered after the pullback to the broken structure in the liquidity range by successfully collecting liquidity to break the zone.
💎 In addition, if the candle closes to the sub-zone in the daily time, the bullish scenario will be invalid and should be re-examined and updated.
»»»«««»»»«««»»»«««
Please support this idea with a LIKE and COMMENT if you find it useful and Click "Follow" on our profile if you'd like these trade ideas delivered straight to your email in the future.
Thanks for your continued support.
Best Regards,❤️
Alikze.
»»»«««»»»«««»»»«««

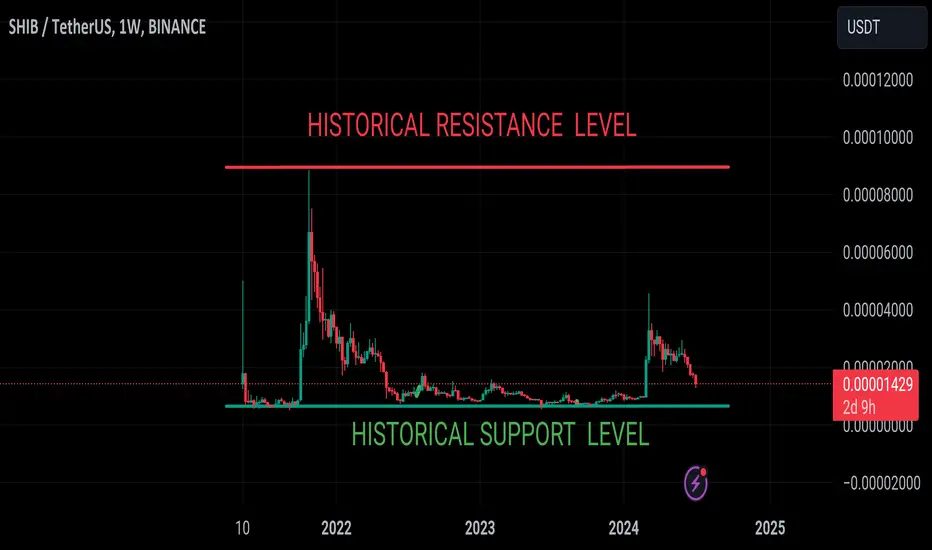
SHIBA INU NEAR THE HISTORICAL SUPPORT Trading Idea for SHIB/USDT (1-week Chart)
The SHIB/USDT price on the 1-week chart is currently near its historical support level around 0.00001000 USDT, after a significant downtrend from its previous highs. This suggests a potential for either a strong rebound or further decline if the support fails.
SHIBUSDT.1DUpon analyzing the daily chart for SHIB/USDT, I have identified several critical elements that provide insight into the current market condition and potential future price movements.
Technical Analysis Observations:
Support and Resistance Levels (S1, R1, R2):
Support Level 1 (S1): At approximately $0.00001057, this level has been a significant support zone. It marks a crucial floor that, if breached, could signal further declines.
Resistance Level 1 (R1): Positioned at $0.00002019, this is the immediate resistance level. A break above this could indicate the start of a bullish correction.
Resistance Level 2 (R2): Located at $0.00003000, this higher resistance level would be a more extended bullish target.
Trend Indicators:
The descending trendline marked by R1 and R2 highlights the overall bearish trend. A break above this trendline would be a strong indicator of a potential trend reversal.
The recent price action shows the price testing lower support levels, indicating persistent selling pressure.
RSI (Relative Strength Index):
The RSI is currently at 39.62, suggesting that while the asset is not in the oversold territory, it is approaching levels where a reversal could be expected if buyers step in.
MACD (Moving Average Convergence Divergence):
The MACD lines are below the signal line, and the histogram is negative, indicating ongoing bearish momentum. However, the MACD lines are flattening, which could suggest a potential reduction in bearish momentum and an upcoming crossover.
Conclusion:
The SHIB/USDT pair is at a critical juncture, testing significant support at $0.00001057. The RSI nearing oversold levels and the flattening MACD suggest the possibility of a short-term rebound. However, the prevailing bearish trend underlined by the descending trendline and MACD requires caution.
For trading strategies, one could wait for a confirmation of reversal signals, such as a bullish RSI divergence or a MACD crossover. A break above the immediate resistance at $0.00002019 would provide a stronger confirmation for a bullish reversal, targeting $0.00003000. Conversely, a break below the support at $0.00001057 would indicate further downside, necessitating close monitoring for new support levels.
Implementing risk management strategies, such as setting stop-loss orders just below the support levels and taking profits near resistance levels, is crucial in managing potential risks and optimizing gains in such a volatile market. Monitoring external market factors and news that could influence price action is also essential.

Shiba | One Final Drop Before Bullish Party (SMU & SSLU-Waves)Shiba Inu did great earlier this year... The full wave, from June 2023 through March 2024, amounted to more 720% total growth...
How are you feeling today?
I hope you are having a nice week.
Please, take a few minutes of your precious time to read this chart with me.
If you enjoy the content, consider hitting follow to show your support.
...Amazing. The reason why Shiba Inu is doing poorly now is because it did great in the past. A correction always follows a bullish wave.
👉 Here is what the chart is currently saying: SHIBUSDT can produce another drop before the bullish party starts. This drop can lead to a bounce that would then lead to an SMU-Wave followed by another drop. This second drop can be either a lower low compared to the one that will show up now or a higher low; this would be the final drop before a sustained period of maximum growth; a SSLU-Wave (Surprise-Super-Long-Bullish Wave).
While here I am only showing the beginning of the SSLU-Wave, this market phase can, and is very likely to, lead to a new all-time high.
➖ How high can it go?
We looked at the 2025 ATH potential many times before.
You can find these trade ideas by searching for SHIBUSDT within my profile.
We will revisit the 2025 ATH potential with fresh data later this year or in early 2025.
Thanks a lot for your continued support.
Thank you for reading.
Namaste.

SHIBAINU - Starting a new Bullish Move ? (READ THE CAPTION)By examining the #ShibaInu chart on the weekly timeframe (logarithmic), we observe that after an attractive growth, this cryptocurrency has again undergone a correction. We should soon expect the end of this correction and the beginning of the next bullish wave. Keep an eye on these prices: 0.00001542, 0.00001385, and 0.00001248. The new wave will likely start its next move after correcting to 1542. (This analysis will be updated)
Please support me with your likes and comments to motivate me to share more analysis with you and share your opinion about the possible trend of this chart with me !
Best Regards , Arman Shaban

Potential Bullish Reversal for SHIB Shiba InuIf you haven`t bought SHIB before the breakout:
Nor sold the top:
Now upon analyzing the chart pattern of SHIB Shiba Inu, it appears that a falling wedge formation is currently in play. This pattern is characterized by converging trendlines sloping downward, with a series of lower highs and lower lows. In technical analysis, a falling wedge is typically interpreted as a bullish reversal pattern.
The falling wedge on SHIB suggests that despite recent declines, there is potential for a bullish breakout. As prices continue to oscillate between narrowing support and resistance levels within the wedge, there is anticipation among traders and investors for a potential upward movement. This pattern often signals a gradual weakening of selling pressure and a potential shift towards buyers gaining control.


SHIBUSDT Technical Analysis in Daily Timeframe.Hello everyone, I’m Cryptorphic.
For the past seven years, I’ve been sharing insightful charts and analysis.
Follow me for:
~ Unbiased analyses on trending altcoins.
~ Identifying altcoins with 10x-50x potential.
~ Futures trade setups.
~ Daily updates on Bitcoin and Ethereum.
~ High time frame (HTF) market bottom and top calls.
~ Short-term market movements.
~ Charts supported by critical fundamentals.
Now, let’s dive into this chart analysis:
SHIB/USDT is currently experiencing bearish momentum within a descending parallel channel. Key support lies around the historical support level and the channel's lower boundary.
The RSI indicates that the asset is oversold, suggesting a possible reversal or a corrective bounce in the near term.
Key Elements
~ Trend Channel: Descending channel with lower highs and lower lows, indicating bearish momentum.
~ Support: Initial support around the $0.000017000 area, tested multiple times, and lower support at $0.000013000.
~ Moving Average: Hovering around the 200-day moving average is crucial for potential resistance. A breakout above this resistance will likely indicate a rally toward $0.0000234.
~ Bullish Divergence: RSI is crucial at 31.12 in oversold territory, with potential bullish divergence suggesting a possible trend reversal.
Best entry for spot holding on SHIB: $0.000015 to $0.000013.
Mid-term Targets: $0.0000262 to $0.000043.
DYOR. NFA.
Please hit the like button to support my content and share your thoughts in the comment section. Feel free to request any chart analysis you’d like to see!
Thank you!
#PEACE

SHIBA next move simulation for 3-6 mounths .....Now at floor of Downtrend Channel and a flag pattern
for next move can rise about 400% from 0.0000175 to 0.0000800 - 0.000085

SHIB broke above the trendlineSHIB broke above the trendline, then retracted back to re-test the trendline and this time it bounced off of the trendline, rejecting the downward trend continuation and going into possible reversal. More to come on this in the upcoming days. Let me know if you'd like me to analyze any other stock.

SHIBUSDT.1DThe SHIB/USDT pair, as shown on the daily chart, trades at $0.00001655, demonstrating a significant bearish trend with a recent decline in value by approximately 5.59%. The trading environment has been largely bearish over the past months, following a failed breakout above earlier resistance levels.
Key Support and Resistance Levels:
Resistance 1 (R1): $0.00002155 - This level marks a recent high that SHIB failed to surpass, forming a clear resistance zone.
Support 1 (S1): $0.00001413 - This is a critical support level where previous lows have converged, potentially serving as a stabilization point if bearish momentum continues.
Technical Indicators:
MACD: The Moving Average Convergence Divergence (MACD) is currently below the signal line and has moved into negative territory, indicating increasing bearish momentum.
RSI: The Relative Strength Index (RSI) is at 31.71, nearing the oversold territory, which may suggest that SHIB is under substantial selling pressure but could also indicate a potential reversal if it moves further into oversold conditions.
Analysis Conclusion:
The current technical setup suggests that SHIB is experiencing strong bearish pressure, with the potential for further downside if it breaks below the support level at $0.00001413. The proximity of RSI to the oversold region might slow down the selling momentum, possibly leading to a short-term bounce or consolidation. However, unless SHIB can reclaim higher levels above the current resistance at $0.00002155, the overall market sentiment remains bearish.
Investors should watch for any movement that breaks out of the current trading range as a signal for potential trend reversals or continuations. Given the negative momentum indicated by the MACD and the critical support levels outlined, the strategy should be cautious, prioritizing risk management and staying alert for any signs of a change in market dynamics.

SHIB/USDT Analysis: Key Levels to BUY (READ CAPTION)By analyzing the #Shiba chart on the weekly (logarithmic) time frame, we can see that after a significant rally, this cryptocurrency has undergone a correction. We should soon expect the end of this correction and the start of the next upward wave. Keep an eye on these levels: 0.00001542, 0.00001385, and 0.00001248! Additionally, the price might fill its previous FVG before starting a strong upward move. This analysis will be updated!
Please support me with your likes and comments to motivate me to share more analysis with you and share your opinion about the possible trend of this chart with me !
Best Regards , Arman Shaban

Rolley -ShibaDear traders, Hello.
I hope you have a good day.
I think it is the best time to buy Shiba in the range of 20-21. and TPs are 28, 31 and 36

Shib Usdt long from entryShib/USdt buyinh here 0.00001350 DCA 0.0000012.50
Sl 0.0000098
Tp 0.000001900
TP 0.000002500
TP 0.000002900
DYOR

SHIBUSDT Is Approaching The Down TrendHey Traders, in today's trading session we are monitoring SHIBUSDT for a selling opportunity around 0.00001870 zone, SHIBUSDT is trading in a downtrend and currently is in a correction phase in which it is approaching the trend at 0.00001870 support and resistance area.
Trade safe, Joe.

⚡️SHIB: Symmetrical Triangle BreakoutShiba Inu coin, often referred to as SHIB, is a cryptocurrency token inspired by the Shiba Inu dog breed, similar to Dogecoin. It was created in August 2020 by an anonymous person or group known as "Ryoshi" and was initially launched as an experiment in decentralized community building.
SHIB gained popularity mainly due to its association with Dogecoin and its meme-centric culture. It operates on the Ethereum blockchain and, like other cryptocurrencies, allows for decentralized transactions and trading.
While SHIB started as a playful project, it gained significant attention and saw dramatic price fluctuations, attracting both traders and enthusiasts. However, it's essential to note that investing in cryptocurrencies carries risks, including volatility and regulatory uncertainties. As with any investment, it's crucial to do thorough research and consider your risk tolerance before investing in SHIB or any other cryptocurrency. BINANCE:SHIBUSDT

SHIB - This Indicator says SELLSHIB has just flashed a dangerous "SELL" alert.
This indicator is highly accurate in higher timeframes, especially the weekly. Look at all the "SELL" signals and how far the price drops after:
From a trendline perspective, SHIB HAS to stay ABOVE the current support line (Fibonacci line 0.236). If it falls under, SHIBA will be at risk of falling to the dotted line, which is BEARISH.
In case you missed it, my take on Bitcoin for the SHORT TERM:
________________________
BINANCE:SHIBUSDT

SHIBSHIB sweep the swing low to moving upside. Shib chart showing some upside movements.
So SHIB moving upside possible. SHIB reach 0.00001920 usdt to moving downside possible.

it's the time to start the BULLRUN for SHIBA INUBINANCE:SHIBUSDT finished the wave 4 of Elliott 5 waves & now we are at the start of wave 5 & targets on the chart.
Let's start the BULLRUN for SHIBA INU

SHIBUSDT.1DIn this technical analysis of the SHIB/USDT daily chart, we explore the recent price movements and use key technical indicators to forecast potential future trends.
Key Observations:
Current Price and Recent Movement:
SHIB/USDT is trading at a price of $0.00001854, showing a moderate increase of 2.49% today. This suggests a possible change in market sentiment or response to external stimuli.
Support and Resistance Levels:
R1 (Resistance Level 1): $0.00001825 - It's noteworthy that the current price has surpassed this level, indicating a potential new support if the price sustains or advances further.
R2 (Resistance Level 2): Marked on the chart but not numerically identified, this would be the next target for bullish momentum.
S1 (Support Level 1): Marked around a previous low (exact value not visible), serving as the primary support area to watch if a reversal occurs.
Technical Indicators:
MACD (Moving Average Convergence Divergence): Currently below the zero line but the histogram suggests decreasing negative momentum, indicating a possible bullish reversal in the making.
RSI (Relative Strength Index): At 31.26, it's nearing the oversold territory, which might attract buying interest as traders perceive it as undervalued.
Analysis and Conclusion:
The current trading pattern in SHIB/USDT reflects a slight bullish recovery, indicated by the price crossing above R1. If the market sustains this rally, R2 could be the next logical target. The improving MACD, moving from deeper negative territories towards the baseline, supports this bullish outlook as it often precedes a change in trend.
However, the RSI near the oversold boundary suggests that while immediate selling pressure might be subsiding, caution is still warranted. A retest of the new support level at R1 (previously R1 resistance) could confirm its reliability for maintaining the upward momentum.

Up, cause its last support areaeveryone must understand technical analysis, its bottom of heavier support, btc is with every crypto charts and its same.

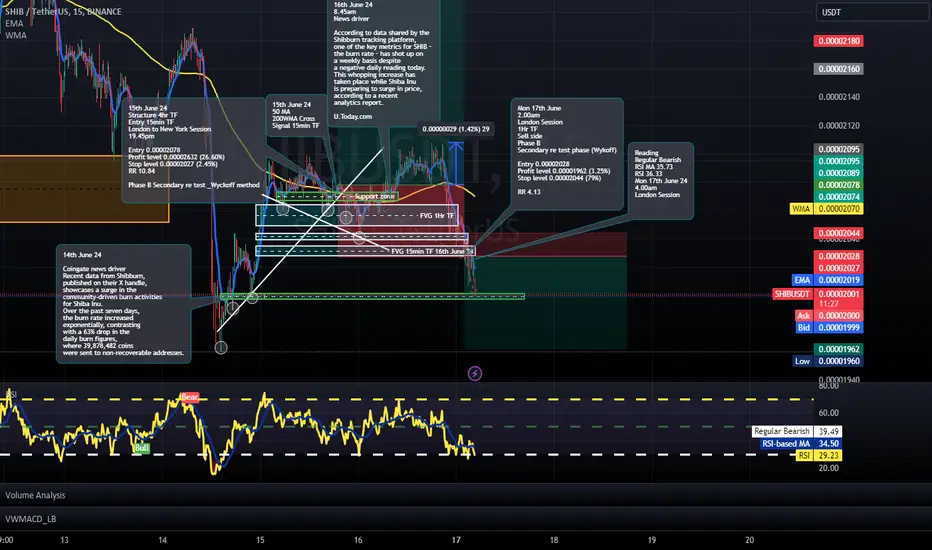
Short trade Mon 17th June
2.00am
London Session
1Hr TF
Sell side
Phase B
Secondary re test phase (Wykoff)
Entry 0.00002028
Profit level 0.00001962 (3.25%)
Stop level 0.00002044 (79%)
RR 4.13