#shibusdtAnalysis of the price action of #shibusdt (#smart_money):
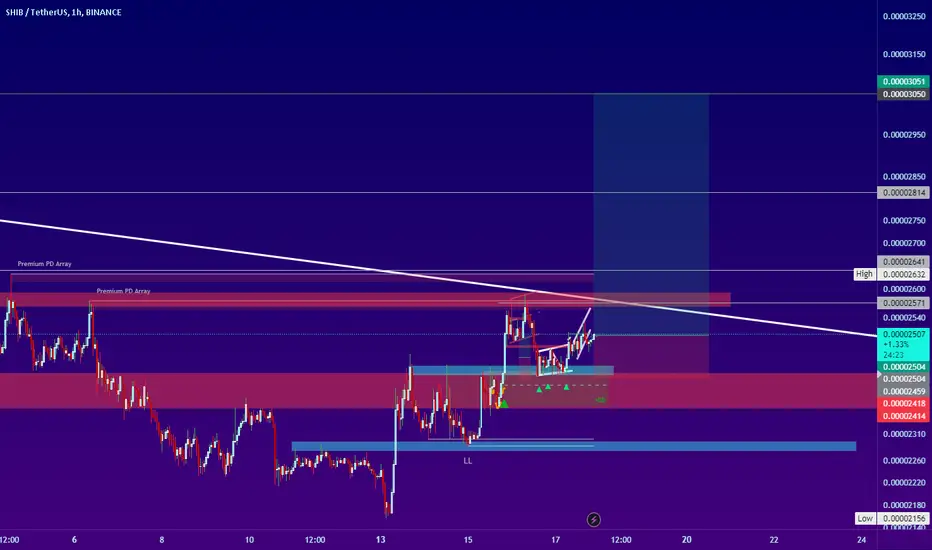
The support (green) and resistance (red) zones of the #shibusdt react when they are reached. As you pass through each area, the role of that area changes. You can trade between these zones based on your personal strategy.
SHIBUSDT trade ideas

Adam and ShibAdam and Eve pattern forming during accumulation phase of Shib
Curious to see what others think about this.
This is the closest I have seen to this formation in any of the alts on the long list.

SHIBA INU (SHIB) I think in the next few weeks we will see SHIB follow the trend of other meme coins like FLOKI, PEPE. I started DCA when SHIB broke the downtrend.
Let's see if it will follow the same movement as the rest of the meme coins. It has not moved like the others yet, but will it follow?
Please note, I am not a professional trader; I am just learning.

Lingrid | SHIBUSDT buying OPPORTUNUTY at Support LEVELThe price perfectly fulfilled my previous idea. In my opinion, the alt season has already begun, but we haven't seen it yet on the price charts. Many altcoins, including meme coins, are currently in an accumulation phase. BINANCE:SHIBUSDT chart, in particular, is clearly in a consolidation zone following its recent bullish move. I believe that the price action is being squeezed, and a breakout of this consolidation zone could lead to another price surge. On the daily timeframe, the price is trading within a range, but we can see higher lows indicating buying pressure. If the market stays above the support level, there is a likelihood that the price will move upward. However, if the price breaks and closes below the upward channel, we would anticipate buying at lower prices. My goal is resistance zone 0.00002666
Traders, if you liked this idea or if you have your own opinion about it, write in the comments. I will be glad 👩💻


SHIB preparing to Unleash 🚀Shib after breaking out of Falling wedge maintained support in the red line below and it's looking extremely bullish, targets above can't be denied in this coming memecoin and Altseason

scalp buy setup for SHIBUSDTBuy Scalping for SHIBUSDT in Short term
attention: this Analysis is not financial Advice

SHIBUSDT LONGShiba went very well during this period and I expect it to go up like this and continue the upward trend
look at the chart, in the past we had a good price support in this range
If I see a change, I will update the analysis.
Let's see what happens

SHIBUSDT 25 May 2024 Hello my dear friends !
Shiba is trading at a great place for Investing !
The odds of rising in price are massive , so , you invest and make some money !
Keep it in mind , I just Buy shiba for spot , Not Future !
Stay safe and have fun with your life !

Bullish flag pattern"🚀 Bullish flag alert on #ShibaInuCoin (SHIB)! Looks like the bulls are gearing up for a big move! 📈🐾 #SHIBArmy #Crypto"
"📈 Spotting a bullish flag on #SHIB! Could this be the start of another epic rally? 🚀💎 #ShibaInu #Bullish"
"🔥 Hot chart pattern: Bullish flag forming on #ShibaInuCoin (SHIB)! Keep your eyes on this one! 🌟📈 #SHIB #CryptoNews"
"🔍 Chart watch: Bullish flag spotted on #SHIB! Are we about to see a breakout? 📈🚀 #ShibaInu #Bullish"
"🌟 Exciting times ahead for #ShibaInuCoin! Bullish flag pattern suggests a strong upward movement could be on the horizon! 📈🐕 #SHIBArmy"
"🚀 Get ready, #SHIBArmy! A bullish flag pattern is forming on #ShibaInuCoin. Let’s see where this rocket takes us! 📈🌕
"📊 Technical analysis update: Bullish flag on #SHIB! Potential for gains looks promising! 🚀💼 #ShibaInu #CryptoTrading"
"🐕 Shiba Inu Coin showing a bullish flag pattern! Time to gear up for potential gains! 📈🚀 #SHIB #Bullish"
"💹 Bullish flag pattern detected on #SHIB! Could this be the signal for the next big move? 🌟📈 #ShibaInuCoin #Crypto"
"🔥 The charts are heating up! Bullish flag on #ShibaInuCoin (SHIB) signals exciting times ahead! 🚀📈 #SHIBArmy #CryptoHype"

SHIB/USDTSHIB is showing some interesting signs on the chart. We've seen a potential breakout from a previous resistance level, and the price is currently retesting that level as support. Additionally, the 100-day moving average (100MA) is acting as potential support
Enter : 0.00002.45 - 0.00002.5
Stop-Loss: $0.00002225 (place a stop-loss order below the support level to limit potential losses)
Keep an eye on SHIBl! SHIBA Inu has seen a nice retracement, but now it may be time to it watch closely! If you're looking to trade SHIB at the moment, here's a quick setup that you might find helpful!
The idea is: Buy when the price breaks above 0.0000249$ and take profits at the levels shown in the chart.
Targets:
1. 0.0000255$
2. 0.000027$
3. 0.000028$
4. 0.0000293
-------------------------------------------
About our trades:
Our success rate is notably high, with 10 out of 11 posted trade setups achieving at least their first target upon a breakout price breach (The most on TW!). Our TradingView page serves as a testament to this claim, and we invite you to verify it!

Long signal for SHIB/USDTThis technical analysis is based on the daily chart of BINANCE:SHIBUSDT on the Binance exchange. In this analysis, a price channel is drawn, and support and resistance levels are evaluated.
Price Channel Analysis:
The price is currently within a price channel ranging from to USDT. The suggested entry point is around USDT.
Entry and Exit Points:
Entry: USDT
Take Profit: USDT
Stop Loss: USDT
Conclusion:
This analysis suggests that by adhering to the specified take profit and stop loss levels, a successful trade can be achieved. The Reward/Risk Ratio for this trade is approximately 2.72, indicating a favorable risk-to-reward scenario. To manage risk effectively, it is recommended to strictly follow the stop loss level.

SHIBUSDT: Two Possible Areas for Swing Buy. Dear Traders,
We have two possible buying opportunites on SHIBUSDT price is currently accumulating and if price do not decide to manipulate then we can see strong price rebound from current price region. However, if price manipulate then we can see it going down to our second entry there we have imbalance zone which will filled and can see strong bullish rebound.
**Like and comment our ideas which will support us to bring you more educational ideas and our views on all financial instruments**
Team SetupsFX_

SHIBUSDT bull flaghello traders
The price is forming a bull flag which is a bullish pattern.
Enter the long once the breakout occurs.
2 targets are shown on the chart.
It looks promising but as long as the price gets rejected by the downsloping resistance, the patience is requred.

SHIBUSDT CONTINUE BUY!!!!!!!!!SHIBUSDT filled my last entry point analysis and price has moved over 60% from my entry now price is moving in a trend to the upside at 0.000028 now am expecting a strong bullish corrections from this current price point but if there should be a breakdown in price then it should sweep liquidity at 0.00002310 before uptrend continues again.....
JOIN AND ENJOY
Tell us what you think..........?

SHIBUSDT#SHIB CRYPTOCAP:SHIB has broken the downtrend, sustained above the resistance, and completed the retest. This gives us a bullish signal. We can position ourselves accordingly.

Lingrid | SHIBUSDT more BULLISH Moves are IncomingThe price perfectly fulfilled my previous idea. BINANCE:SHIBUSDT went up and hit the target level. The market surged upwards, breaking through the range zone and closing above it. This move has resulted in a series of updated higher lows, with the highs becoming increasingly similar, indicating a growing buying pressure. As the price continues to move upward, it's heading towards the resistance zone that originated from the swap level. I'm anticipating a potential retest of the key zone around 0.000030, as well as the upper border of the channel and trendline. My target is the resistance at 0.000027.
Traders, if you liked this idea or if you have your own opinion about it, write in the comments. I will be glad 👩💻

SHIB/USDT: Potential Breakout and Retest - Trade Idea!!Hey everyone! If you find this content valuable, please consider giving it a thumbs up and following for more analysis.
SHIB is showing some interesting signs on the chart. We've seen a potential breakout from a previous resistance level, and the price is currently retesting that level as support. Additionally, the 100-day moving average (100MA) is acting as potential support.
This could be a buying opportunity for those interested in SHIB. However, it's important to manage your risk. Here's a possible trade setup:
Entry: Current market price (CMP) with potential for adding more on a dip down to $0.000024 (be sure to use a stop-limit order for this)
Target: 80-100% potential profit (be sure to set realistic take-profit orders)
Stop-Loss: $0.00002225 (place a stop-loss order below the support level to limit potential losses)
Remember, this is just an idea, and the market can be unpredictable. Always conduct your own research before making any trading decisions. What are your thoughts on this SHIB setup? Share your analysis in the comments below!

shiba inu has a crazy nice setupthe price is pinned but its amazingly bullish... lets hope we can make some money!

I Cannot SHORT This !!!Hi.
BINANCE:SHIBUSDT is following a Descending Triangle pattern and it has recently pumped from a horizontal support level.
The 200 moving average signals a bullish trend
A clear breakout from the triangle pattern is required to confirm a bullish move.
Stay awesome my friends.
_ _ _ _ _ _ _ _ _ _ _ _ _ _ _ _ _ _ _ _ _ _ _ _ _ _ _ _ _ _ _ _ _
✅Thank you, and for more ideas, hit ❤️Like❤️ and 🌟Follow🌟!
⚠️Things can change...
The markets are always changing and even with all these signals, the market changes tend to be strong and fast!!

SHIBUSDT 3D LONG📈Hi all. Timeframe 3D. SHIBUSDT has formed a triangle in 2 years and is in strong support. I am considering entering spot now and/or going long during a breakout/retest of the trend line. Marked goals and levels on the chart.

Shibainu... 🎯 Target Shiba can grow by 300%.
After exiting the triangle, wait for Shiba's pump to reach the drawn area.
