SHIB: Watch this level! SHIBA Inu has seen a nice retracement, but now it may be time to it watch closely! If you're looking to trade SHIB at the moment, here's a quick setup that you might find helpful!
The idea is: Buy when the price breaks above 0.0000255$ and take profits at the levels shown in the chart.
Targets:
1. 0.0000267$
2. 0.000029$
3. 0.0000315$
-------------------------------------------
About our trades:
Our success rate is notably high, with 10 out of 11 posted trade setups achieving at least their first target upon a breakout price breach (The most on TW!). Our TradingView page serves as a testament to this claim, and we invite you to verify it!
SHIBUSDT trade ideas

Are we going down again?By my count this is a b wave and shib needs another wave down to complete the wxyxz correction. Tell me im wrong. Not financial advice. Do your own research.

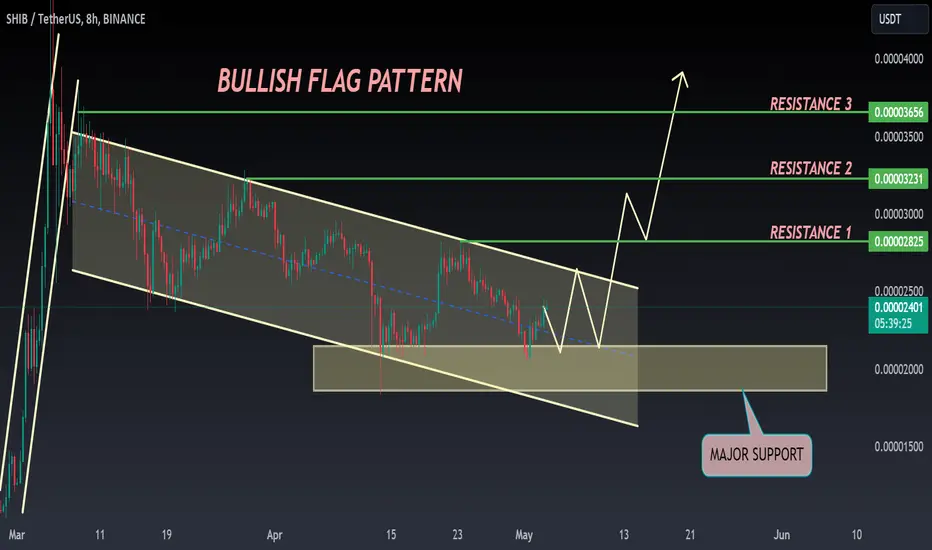
SHIB ANALYSIS🔮 #SHIB Analysis
🌟₹SHIB is consolidating in a Bullish Flag Pattern in 8hr timeframe. Incase of successful breakout in #SHIB we can expect solid bullish wave expecting 50-60% bullish wave 💲
🔖 Current Price: $0.00002396
⏳ Target Price: $0.00003656
⁉️ What to do?
- We have marked crucial levels in the chart . We can trade according to the chart and make some profits. 🚀💸
#SHIB #Cryptocurrency #Breakout #DYOR
Shibainu ... Technical analyst Shiba,, After correction in support of Ichimiko and moving averages...
I showed the first goal in the chart

SHIBUSDTWe can attempt to short SHIBUSDT from specified level if it break last HL , also there is bearish divergence indicate that it move downward.
SL , TP mention in chart.

SHIB's Critical DipThis price point is closely approaching a critical support level at 2098, situated at the bottom of a previous gap, indicating a significant area where the asset might find a footing if the downtrend continues.
The current price is nearing the lower Bollinger Band, suggesting that SHIB is potentially entering an oversold territory. This could be a precursor to either a continuation of the bearish trend or a reversal if the asset is deemed too undervalued.
Volume: The trading volume is exceptionally high at 1.078 trillion SHIB, indicating significant market activity. Such high volume associated with a downtrend typically confirms strong selling pressure.
The price is below the SMA of 2207, signaling bearish momentum. Prices below the SMA generally indicate that the asset is currently in a downturn relative to recent price history.
The %K (10.2) and %D (11.6) values are below 20, which often suggests the asset is oversold and might either see a short rebound or continue to drop if the selling pressure doesn't ease.
At 26, the RSI further confirms that SHIB is oversold. This indicator often signals that the selling may be overextended, and a reversal could be imminent, depending on market conditions.
The MACD line below the signal line with a negative histogram value reinforces the strong bearish momentum observed in the market.
The chart indicates a robust resistance to upward movement, suggesting that any potential recovery may need significant volume and buyer interest to break past established resistance levels, particularly around 2552. With the market indicators pointing towards an oversold condition, investors should watch for potential stabilization or a minor price recovery. However, the overarching sentiment remains bearish, and caution is advised. This technical posture might offer a strategic point for traders to consider entry for a short position if expecting further decline, or to prepare for a possible buying opportunity should the indicators suggest a strong reversal is likely.

Trade Setup For SHIB / USDT - 15 min TF! If you're looking to trade SHIB at the moment, here's a quick setup that you might find helpful!
The idea is: Buy when the price breaks above 0.0000034$ and take profits at the levels shown in the chart.
Targets:
1. 0.00000345$
2. 0.00000355$
3. 0.00000362$
-------------------------------------------
About our trades:
Our success rate is notably high, with 10 out of 11 posted trade setups achieving at least their first target upon a breakout price breach (The most on TW!). Our TradingView page serves as a testament to this claim, and we invite you to verify it!

Time to keep an eye on SHIB!! SHIBA Inu has seen a nice retracement, but now it may be time to watch closely! If you're looking to trade SHIB at the moment, here's a quick setup that you might find helpful!
The idea is: Buy when the price breaks above 0.0000275$ and take profits at the levels shown in the chart.
Targets:
1. 0.0000284$
2. 0.0000303$
3. 0.0000313$
4. 0.000033$
-------------------------------------------
About our trades:
Our success rate is notably high, with 10 out of 11 posted trade setups achieving at least their first target upon a breakout price breach (The most on TW!). Our TradingView page serves as a testament to this claim, and we invite you to verify it!

SHIB/USDT WEEKLY CHART UPDATE !!Hello friends, welcome to this SHIB/USDT update from Crypto Sanders.
Chart Analysis Everyone, what are your thoughts on the charts? Please share your comments regarding the SHIB/USDT Weekly Update.
Shiba Inu (SHIB) finished the week with a notable rise of 14%, emerging as the top performer on our list. This significant improvement is noteworthy, especially given the recent decline in new local levels.
The key support lies at $0.000025, where buyers have so far successfully maintained a hedge against further selling pressure. Resistance is $0.000037.
Going forward, the optimal scenario for this meme coin includes consolidating the above key support and potentially starting a new rally in May.
I have tried to bring the best possible results in this chart.
If you like it, hit the like button and share your charts in the comments section.
Thank you.


Shibusdt H1Hello
We see the Shiba price chart that the price has been able to cross the swap zone, and now we have determined an entry point in the retracement in the specified area.


📈 Shiba Inu Coin: On the Rise Again! 🚀
Title: 📈 Shiba Inu Coin: On the Rise Again! 🚀
📉 Analysis:
Shiba Inu Coin (SHIB) has been showing promising signs as it bounces off its support at 0.00002643. This bounce indicates renewed investor interest and buying pressure in the cryptocurrency.
📈 With the momentum building, SHIB appears poised to target the 0.000036 mark in the near term. This represents a significant upside potential for traders and investors alike.
💼 However, it's essential to consider the broader market trends and factors influencing SHIB's price movement. Market sentiment, regulatory developments, and overall cryptocurrency market conditions can all impact its trajectory.
🔍 Traders should keep a close eye on key resistance levels and monitor any developments that could affect SHIB's performance in the short to medium term.
🚀 Overall, with its recent bounce off support, Shiba Inu Coin is showing resilience and potential for further upward movement towards the 0.000036 target.

Will This Scenario Repeat itself?I still don't understand the value added for Shiba Inu neither it's differentiation strategy from other crpto, yet people invest in it in hopes to make some profits. I don't invest with such mindset lacking future vision and mission, however this trend analysis stood me.
This is not a financial advice. It's only my own idea.

shiba usdt tarde at your own riskshiba /usd have creat the coch in 1 min with bos so ia ma going to take long postion up to 15 min up bo zone
NOTE- please trade at your own risk no dinincal advice GOOD LUCK

Bearish trend continues. Is it part of a bigger picture?Something makes me wonder whether this will turn into a wxyxz correction given the impulse wave failed to breakout of the down trend and we are on a 5 wave form down. Bottom target for next pivot is at 0.00002260 OB. We need good volume to break the pattern but should see rebound and up trend back to 0.00002700 range. My only worry is this is likely a B wave which will end in another 5 waves down. BTC has been holding relatively strong. No big dumps will help maintain strength in alts and memes. Its a difficult market to read.

SHIB/USDT COURT SHORTHello everyone, for me the SHIBA will continue to fall to liquidate the lows, and then continue its rise, we are still in an uptrend.

SHIB - DUMP Incoming 📉📉Hi Traders, Investors and Speculators of Charts📈
Shiba was unable to breakout above the recently formed pennant pattern in the weekly timeframe. Usually pennants are bullish but if the pattern fails a huge downside can be expected, indicating weakness and dominant sellers.
The next likely support is only at the moving averages, with both the 50d and 100d roughly at the same place (price tags on the right hand side). If the markets do not turn around in the immediate future, SHIB could drop as much as 40%, since it drops much harder than BTC and ETH during liquidity rotations.
Considering that this is the weekly timeframe, it may take some time for the price to reach the moving averages trendlines.
_______________________
📢Follow us here on TradingView for daily updates📢
👍Hit like & Follow 👍
CryptoCheck
BINANCE:SHIBUSDT

Bearish shib/usdtAs i see in the chart in ICT strategy we had an ob and FVG in 4H that as you see in the chart FVG touched and Bearish candles started and will continue to the points that i marked in the chart

$SHIB #ShibaInu Trading IdeaSHIB/USD (ShibaInu) has increased by 224.19% in total since I gave you this call. Now, it's forming a potential bull flag and gearing up for another rally. There's a good chance we'll see another surge after a breakout. Keep an eye on this channel!

Lingrid | SHIBUSDT long RANGE zoneThe price perfectly fulfilled my previous idea. The market went up and hit the target level. BINANCE:SHIBUSDT formed a range zone, then broke through it downside. Overall, the price updated higher highs and higher lows on the 1H timeframe. The price is pulling back to support levels, which is the swap zone. I think the market might move upward if it pulls back to the swap level and rejects it. I expect the price to retest the middle of the range zone and then go up. My target is resistance at 0.00002700
Traders, if you liked this idea or if you have your own opinion about it, write in the comments. I will be glad 👩💻

Shib retrace healthy correctionRetrace to the trend line at 0.00002400 which is acting as support. If this breaks will probably drop to the main historic trend line at 0.00002160.
All depends on BTC. Do your own research, not financial advice.

SHIB's New Growth?The price of SHIB, after reaching a defined resistance area and experiencing a price correction, is now beginning to grow again. This growth has been accompanied by a break in the downtrend line, and if the price can stabilize in the four-hour timeframe and form a strong bullish pattern, there is a possibility of resuming the uptrend. Conversely, if strong bearish patterns form, the price is expected to decrease again.
