SHIB, yes it's a meme coin, but so is/Doge right? Fool me once, shame on you, fool me twice, shame on me
This has the exact same history, and IMO, same trajectory as Doge. Maybe it doesn't have Elon pumping it as his love coin which can never hurt, but assuming a new bull run is here, and especially if the rumors about Grayscale ETF are true...Or imagine payment for X or the telegram or whatever the app is! Boom! Rich dad poor dad is no Elon, but he's something right?
Last run, SHIB already had a very similar pattern (in percentage) to Doge. In fact, they both had about a 1000% initial bull run pump. Doge's second was 8000+ percent (give or take some depending on exchanges and when you bought).
Thus, current price multiplied by 8000% percent = I get to buy a boat. I mean invest in my kid's future.
Sometimes we (meaning mostly myself) have a tendency to make trading too complicated when it shouldn't be. History repeats itself, so why not this time? Especially with a "rival" meme coin that has nearly identical trading patterns and various other news, circumstances, patterns, etc.
Frankly, I learned much during and after the last bull run. Particularly that there is very little downside to risking a little cash on something with this much hype that is still this cheap.
I made about 9K on Doge last bull run (bought at .0015 or something) and sold around 3.5 cents. Mostly sold then too because robinhood froze me out and I freaked out and sold since I needed the cash. Don't get me started...Anyway, had I kept it for another 4-5 months = $1.7 milly.
Not angry, not happy obviously, but not angry. Lots of lessons learned and I was a very young trader that was just excited to make 9K and pay some bills off. 9K off a meme coin, who would've guessed? Well this time, I be guessing and not again. Time to moon MFers
PS: Doge going to 3$ plus too. Maybe 5-8$ if X adopts it.
Do your own research, not financial advise. Etc. yadayadayada
SHIBUSDT trade ideas

The bears are a tasty snack for the bulls to eat!It seems there are no bearish signals left for SHIBA to hinder a potential upward trend at this juncture. Taking a risk, I've decided to invest in 200 million SHIBA COINS. The sky appears to be the limit; once it surpasses certain minor resistance levels, SHIBA could soar to unprecedented heights. I'm intrigued to see how this unfolds in a year from now.

Shibusdt 1D (Lovely shy shitcoin waiting for a tweet☺️)Hello friends, I hope you are doing well. You can see the Shib currency chart in the time frame of one day, it is in a long-term downward channel, which must be moved upwards as soon as possible to change the trend, because it has left the growth of the market during this period.

Shiba Inu Will Grow After One Final Drop... See Here!Shiba Inu will grow in 2024.
Shiba Inu is likely to grow in 2025 as well but the chart/market is asking for one final drop; the end of the correction, before massive growth can take place.
This is ok.
This is fine.
This is normal... The market moves in waves.
We have a Head & Shoulders pattern and red candles after a lower high; all pointing down.
Maybe 1-2 months max and then strong growth.
There is the possibility of a new accumulation phase at support before the next jump.
I will be here for updates.
Thanks for your continued support.
Namaste.

SHIB (Shiba Inu) Technical Analysis & Trade Idea (video)Further to my previous post I thought I would do a video to explain my thought process behind the trade idea.
SHIBA INU has been experiencing significant selling pressure, compromising its previous bullish trend and indicating a potential reversal. The 50% Fibonacci retracement level presents a logical entry point for a short position. As the market seeks liquidity, price action could target previous swing lows. Consider initiating a short position on #SHIB at the 50% Fibonacci retracement level with targets at previous swing lows, employing a strict stop-loss above the recent swing high.
Important Disclaimer: This analysis serves as a technical perspective and should not be treated as direct financial advice. Conduct your own thorough due diligence and implement sound risk management strategies before executing any trades.

SHIB (Shiba Inu) Technical Analysis & Short Trade SetupSHIBA INU has been experiencing significant selling pressure, compromising its previous bullish trend and indicating a potential reversal. The 50% Fibonacci retracement level presents a logical entry point for a short position. As the market seeks liquidity, price action could target previous swing lows. Consider initiating a short position on #SHIB at the 50% Fibonacci retracement level with targets at previous swing lows, employing a strict stop-loss above the recent swing high.
Important Disclaimer: This analysis serves as a technical perspective and should not be treated as direct financial advice. Conduct your own thorough due diligence and implement sound risk management strategies before executing any trades.

SHIBUSDT.1DBased on the market data provided, the SHIB/USDT pair is currently trading at 97.0. The Relative Strength Index (RSI) over a 4-hour, 1-day, and 7-day period are 58.81, 60.11, and 55.90 respectively. These figures suggest that the pair is neither overbought nor oversold in the short, medium, and long-term.
The Moving Average Convergence Divergence (MACD) for the 4-hour, 1-day, and 7-day periods are 2.0, 12.0, and 23.0 respectively. This indicates a bullish trend in the short, medium, and long-term as the MACD is above zero.
The Bollinger Bands for the 4-hour, 1-day, and 7-day periods are 10.0, 100.0, and 1108.0 respectively. This suggests that there is a significant level of volatility in the market, especially in the long-term.
The support levels for the 4-hour, 1-day, and 7-day periods are 94.0, 93.0, and 89.0 (Support1), 90.0, 87.0, and 79.0 (Support2), and 87.0, 84.0, and 75.0 (Support3) respectively. This suggests that there is strong buying pressure at these levels.
The resistance levels for the 4-hour, 1-day, and 7-day periods are 10.0, 1051.0, and 111.0 (Resistance1), 1051.0, 111.0, and 1194.0 (Resistance2), and 111.0, 1126.0, and 1260.0 (Resistance3) respectively. This indicates that there is strong selling pressure at these levels.
Considering the above analysis, the SHIB/USDT pair is in a bullish trend across all time frames. However, it's also important to note the high volatility and strong resistance levels, which could lead to significant price fluctuations. Please note that cryptocurrency investments carry a high level of risk and you should only invest what you can afford to lose.

Shib USDT Long Trade.#SHIB
Shiba Inu moving within a triangle pattern inside a descending channel💁♂️
We have a chance to revisit all-time highs from 2021 after a breakout from descending resistance📈

$SHIB #ShibaInu Trading IdeaSHIB ShibaInu formed an interesting setup for us. On a higher timeframe, we can see a descending channel with a triangle pattern with a probability of a breakout to the upside. The distance to the next massive supply (rejection) zone is 107% and the distance to the ATH levels of 2021 is 801%. Enjoy your Sunday fam & DYOR!

#Btc #Eth #Bnb #Sol #Doge #Shiba #ShibainuShiba
Green= Target
Orange= Resistant
Red= St
Disclaimer
This text is just a personal opinion and should not be used as a basis for decision.

SHIB / 4H / TECHNICAL ANALYSIS BINANCE:SHIBUSDT Hello traders, I have identified the target of the harmonic formation on the chart. Wishing everyone success!
Like and comment if you find value in our analysis.
Feel free to post your ideas and questions at the comments section.
Good luck

Nice Breakout1. Supertrend positiv
2. positiv accumulation
3. positiv squeeze
Targets marked with dotted lines in chart

Shib Halving Stage ActionAccording to my Chart Viewing ability SHIB is about to Reach 1 Cent or 1 Dollar during the Bull run because of high capitalization and Gaining Volume. Hoping to See New high's in crypto market by the end of 2025

#SHIB → Waiting for the corner pattern to breakIt has a corrective structure in daily and H4 time frames. In a support strip with a corner pattern, it can have two movement paths. If the blue bar is formed by one or more confirmation candles, it can break the dynamic resistance trigger and have a temporary rise to the specified supply area. Otherwise, with the failure from the bottom and confirmation below the blue band, there will be a possibility of continuing the correction to the previous floor.
-----------------
Please support this idea with a LIKE and COMMENT if you find it useful and Click "Follow" on our profile if you'd like these trade ideas delivered straight to your email in the future.
Thanks for your continued support.
Sincerely.

SHIB BREAKING OUTSHIB is breaking through descending resistance. Should be headed back to the range EQ.

SHIBA: It Should Rise MoreSHIBA: It Should Rise More
SHIBA price broke out of a bullish pattern and now looks poised to go higher.
As the market will take profits from BTC and ETH maybe these altcoins with solid patterns
are the next to move.
From our previous analysis the price has reacted very well in the reversal zone increasing the chances of this bullish movement.
You may find more details in the chart!
Thank you and Good Luck!
❤️PS: Please support with a like or comment if you find this analysis useful for your trading day❤️

we need to see last drop we need to see last drop for shiba and it break level 0.000005$ after breaking that level it will be the last chance to buy for next bull run

SHIB.USDTIt seems that a hidden bullish divergence has been seen on the daily time frame in the indicator R.S.I
If it is confirmed and breaks out of the trend line, it will see its historical price.

Shibainu, technical analysis The trend line is broken, it can reach the psychological number of 1000

Shibainu... analyst I really don't know why they don't let Shiba go up, it's really boring, while it's in support and it's technically in the right place.

SHIB Shiba Inu Price TargetIf you haven`t sold the Bearish Pennant:
Nor bought the dip on SHIB:
With the stock market reaching record highs, there is growing optimism that the positive momentum could spill over into the crypto market.
Historically, we've seen a correlation between bullish sentiments in traditional markets and increased interest and investment in cryptocurrencies.
As traditional investors seek diversification and alternative assets, the crypto market, with its potential for high returns, could benefit from this wave of enthusiasm.
This alignment with the prevailing positive trends in the stock market might act as a catalyst, fostering a bullish outlook for the crypto market in the coming days.
My Price Target for SHIB Shiba Inu is the next resistance, $0.00001050.

SHIBUSDT 1DFalling wedge breakout has already done on 1-day chart. #SHIB is trying to breakout the MA100 on daily chart. Targets are the same as before.

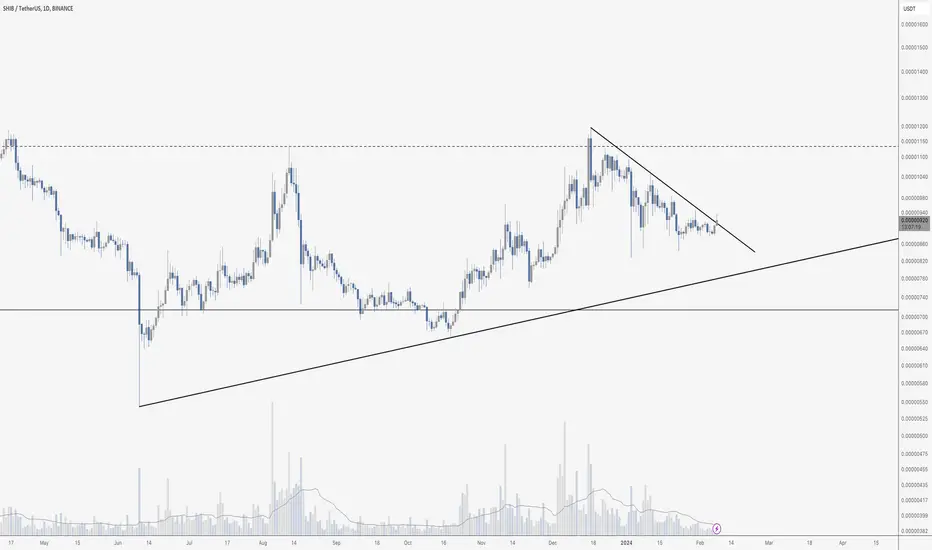
SHIB BREAKING OUT?I know, memecoin. But the chart is the chart, and I had a great trade from the range lows in the 700s up to around 1100 at the range EQ. As I have shared before, price dropped from there and has formed a descending resistance, which is now being tested. My alarm went off, which means it is time to pay attention.
This breakout would look a lot better on convincing volume with more candle spread by the end of the day. If we do get a candle close above descending resistance, the target is once again around 1150 at the EQ. We can discuss higher if we get there.