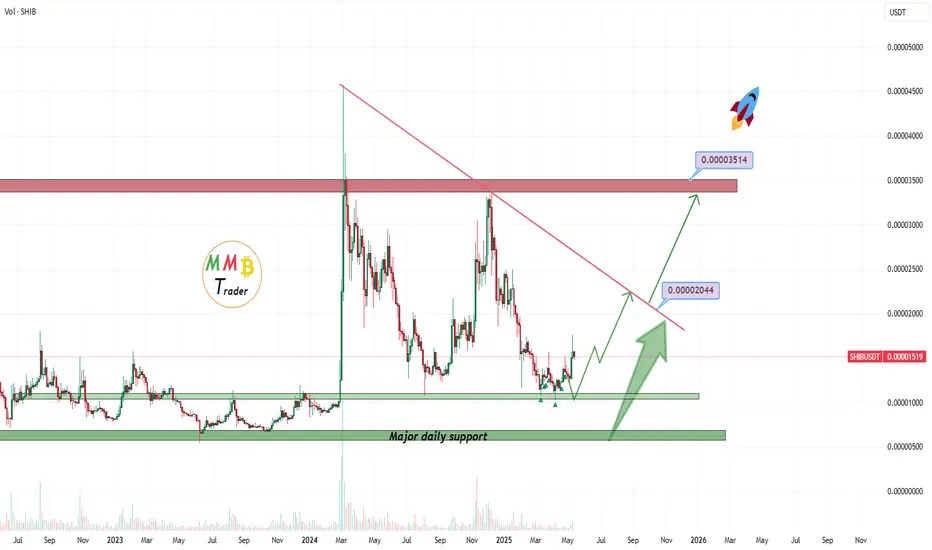
SHIBUSDT The pump is even not started yet(Get ready for more!!)As we can see price is still near major daily support zone also our first target is red trendline resistance and the real bull candles with high volume and good amount of pump will appear after that resistance break and we are waiting for this bull scenario.
DISCLAIMER: ((trade based on your own decision))
<<press like👍 if you enjoy💚
SHIBUSDT trade ideas
SHIBA play Long in trend corridorSuch as we have bullish market now start to play in trend corridor SHIBA/USDT. Based on two factors I see - market and pattern up and down in that coin. Im use Binance Futures for that very little % from my capital with 15x leverage. 0.01726 buy --- SL 0.01706 --- TP 0.01755

SHIBUSDT 2D AnalysisSHIB ~ 2D Analysis
#SHIB Buy on retest of this buy zone with short term target of at least 15%+ from here.

SHIB is formingHead & shouder patternBuy at support area; expect can pump hard after finish the pattern.

Shiba Inu / Long Term Shiba Inu – Long Term
The chart says it all: stop-loss, targets — no explanation needed.


Lingrid | SHIBUSDT long OPPORTUNITY from the SUPPORTBINANCE:SHIBUSDT is currently trading inside a downward wedge pattern, typically a bullish formation. After reaching the resistance zone around 0.00001567 and forming a lower high, the price retraced sharply. It is now approaching a critical support area near 0.00001186, aligned with the wedge base and previous reaction zones. Bullish traders are watching for a breakout to the upside, while bearish pressure remains within the channel.
📉Key Levels to Watch
Support zone: 0.00001186 (wedge base and historic demand)
Breakout target: 0.00001390 (near-term rally cap)
Invalidation level: below 0.00001028
⚠️ Risks
A failure to hold above the wedge support at 0.00001186 could trigger a drop toward the March lows at 0.00001028.
Bearish momentum remains strong, and multiple lower highs signal seller dominance unless invalidated.
False breakouts within wedge patterns are common—confirmation is needed before reacting.
Traders, if you liked this idea or if you have your own opinion about it, write in the comments. I will be glad 👩💻

SHIB Ready to Explode? Don't Sleep on the Dog!📈🚀 SHIB Ready to Explode? Don't Sleep on the Dog! 🐶🔥
BINANCE:SHIBUSDT – Daily Chart Analysis
Looks like the Shiba army is quietly reloading... 👀
After weeks of sideways chop, SHIB is forming a bullish cup & handle pattern — just below a key breakout level at 0.000030. Volume's compressing, RSI’s curling up, and the meme energy is building 💥
📊 Technical Setup:
Cup & Handle forming ✅
RSI breakout zone ✅
Bullish divergence on MACD ✅
Historical resistance = potential launchpad 🚀
Targets?

Shiba Inu Eyes 20% Surge, Targeting 0.000016 Breakout SoonHello and greetings to all the crypto enthusiasts, ✌
All previous targets were nailed ✅! Now, let’s dive into a full analysis of the upcoming price potential for Shiba Inu 🔍📈.
Shiba Inu has recently seen an extraordinary surge in trading volume, suggesting imminent large-scale activity likely driven by whales. The asset is currently trading within a parallel channel, indicating a period of consolidation. In the short term, I anticipate a potential price increase of at least 20%, targeting the key level of 0.000016.📚🙌
🧨 Our team's main opinion is: 🧨
Shiba Inu's massive recent volume hints at big whale moves ahead, and with price in a parallel channel, I’m eyeing a 20% jump toward 0.000016 soon.📚🎇
Give me some energy !!
✨We invest hours crafting valuable ideas, and your support means everything—feel free to ask questions in the comments! 😊💬
Cheers, Mad Whale. 🐋

Global plan for Shiba InuIn this video I considered the global possible price movement, also made possible scenarios for the current week
At the moment the price is trying to grow, but it looks like a local bounce before the downward correction continues
Write a comment with your coins & hit the like button and I will make an analysis for you
The author's opinion may differ from yours,
Consider your risks.
Wish you successful trades! MURA

SHIB/USDT Confirmation for Buy Trend ContinuationOn the 4-hour timeframe, we are in a buy trend, and the price has approached the buy GWS, where we are monitoring for a possible continuation of the buy trend. We need to wait for the price to react at the buy GWS and form a confirmation for the continuation of the buy trend. By waiting for confirmation from the market, we aim to avoid a potential false breakout.

SHIBUSDT Is Flashing Major Bearish Warnings – Are You Ready??Yello Paradisers, Have you been keeping an eye on SHIBUSDT? If not, now is the time. The market is showing clear signs of weakness that could lead to a significant bearish move, and many traders may not be prepared for what’s coming.
💎SHIBUSDT is currently looking bearish after forming a clear bearish Change of Character (CHoCH) on the higher timeframe. Adding to this, the price action on the lower timeframe is showing an internal Change of Character (I-CHoCH) originating from a 4-hour bearish Order Block (OB). This setup substantially increases the probability of a continuation to the downside.
💎What we are focusing on now is the potential pullback. If SHIBUSDT pulls back to fill the Fair Value Gap (FVG) or develops a bearish pattern from the Order Block, it would provide a strong short opportunity with an excellent risk-reward profile.
💎However, it is crucial to remain cautious: if the price breaks out and closes a candle above the identified Order Block, it would completely invalidate the bearish idea, and we would need to step aside from any short positions.
Remember, Paradisers, sustainable trading success comes from patience and disciplined execution. There is no need to rush. Waiting for confirmation will always keep you on the winning side. Be smart, wait for the right setup, and always trade like a professional. This is the only way you will make it far in your crypto trading journey.
MyCryptoParadise
iFeel the success🌴

SHIBA INU NEXT BULLISH MOVEWe all have memory of shiba Inu...for the newbie do your research, SHIB coin is worth investing
the first bull run occur from Mon 27 Sept 2021 to Mon 25 Oct 2021
you will notice big candles to show you how strong the buyers are
from Mon 01 Nov 2021 to Mon 19 Feb 2024
you will see a bear run but watch the candlesticks they are not big candles and they are wicks, showing you that the bearish move are just manipulation in the market because buyers are present
The dotted lines are market next drag of liquidities, that is where market will be pushing to next(Market love the wicks!!!)
The Trend killer are what traders call order block but I call it Trend killer because understanding it is the key success to my trading skill aside general Price Action and others
When market came close to the Trend killer it tested it but didn't not break it, the rule of the Trend killer is you will wait for it to break it and take trade from the retracement of the broken zone make sure no Trend Killer is formed on the retracement else you will wait to see how it will fight that one...you have to do your homework
So that's the reason why first and second circle failed to break that zone
So the zone in which my entry was, is a structure broken Mon 18 Dec 2023 so
I decided to take the trade because of the daily bullish candle(9-Apr-2025) that engulf the daily bearish candle(8-Apr-2025) followed by a retracement on a Trend killer (10-Apr-2025)
PS: Trade it on Spot Trade

It is good price to add some shibBoth fractals and patterns show me that shiba is bullish. But we need to wait for the white area to confirm.

SHIBUSDT pump from major daily supports startedAs we mentioned a lot:
the gain started this time from our support and now it can easily continue to at least red trendline resistance which is first target.
DISCLAIMER: ((trade based on your own decision))
<<press like👍 if you enjoy💚

CautionSHIB is at a key level and previously formed a small body bearish candle with a long upper wick. Stochastic RSI is very over bought, and RSI is getting closer to overbought levels. Price needs to overcome and close above the 0.00001420 price range to continue positive price action. Please see chart for key levels and remember the EMA's can sometimes act as support and resistance.

Shiba Inu 1,479% Bullish Wave Starts Now (2025 Bull Cycle)Shiba Inu is now starting a new rise similar to early 2024, February, but much stronger much stronger.
Good afternoon my fellow Cryptocurrency trader, here we have a long-term chart.
The structure of the chart is quite revealing and leaves no room for doubts. SHIBUSDT is bullish now.
There was a correction after the March 2024 high ending in higher low. This then proceeded to produce a lower high and then a new lower low. The action is now bullish as it recovered above the August 2024 low.
Three weeks closing green now, trading green as this one is yet to close. This week is the confirmation as closure happens above long-term support. Touch and go. The action moved below on a wick just to recover, this is a strong bullish signal and when the week ends at 0.000012500 or higher full bullish confirmation is in. The 2025 bull market starts.
Early 2024 was the initial bullish breakout and this breakout produced massive growth, it was great but nothing compared to what is coming next. The next wave will be many times bigger because 2024 was still part of the transition year while 2025 is the bull market. 2026, after the peak and new All-Time Highs, a bear market will develop.
The bear market is followed by a new period of sideways, transition and then a new bull market. The market moves cycles and these are repeated over and over like night and day. 4-years based on the Bitcoin halving. It can extend but most likely it will continue to be the same.
The targets can be seen on the chart. Maximum growth, strong comes ahead.
» A nice target sits at 0.000139 for 894% and new ATH potential up to 1,479% at 0.000220. We will have to wait and see, it is too early but the market is turning green now and will continue to trade green. It can happen that it go higher rather than lower based on the chart. It can happen that rather than overestimating the potential of this pair, we are underestimating it, this too would be good, the more it grows the better it gets.
Namaste.

SHIB/usdt.dShiba might just give us this repetitive fractal once again! Time will tell. We are at a heavy resistance zone at the moment, so a break of 0.000014 might give us the move to a level were we might go into consolidation again. Bulls normally goes away in May... Lets see. Either way, SHIB is at a great buy!

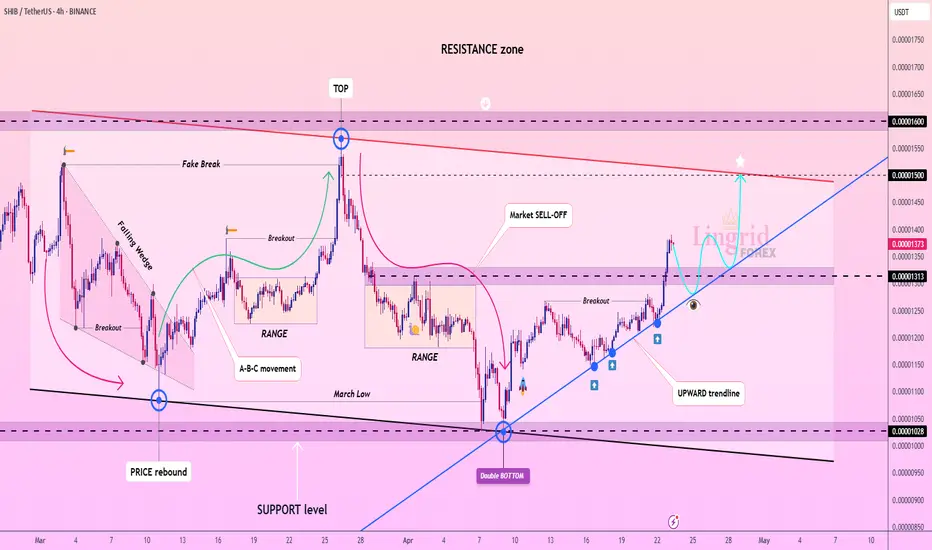
Lingrid | SHIBUSDT price REBOUND after DOUBLE Bottom FormationBINANCE:SHIBUSDT market has bounced off the support level following a double bottom formation. Price action essentially created a false breakout below the previous month's low before reversing higher. Recently, it completed an ABC move, which typically precedes a pullback phase. The 0.00001250 support level has demonstrated significant importance to the market, having been tested multiple times with price rebounding from this zone on numerous occasions. Since the price has successfully broken and closed above this critical level, I expect the market to retrace toward the support zone and upward trendline before continuing its upward movement, provided it maintains position above these key zone. My goal is resistance zone around 0.00001500
Traders, if you liked this idea or if you have your own opinion about it, write in the comments. I will be glad 👩💻
SHIBUSDT strong and Heavy pump phase aheadin the previous bull run we had small gain on price for SHIBUSDT instead of previous pump which we had at 2021 and that one was around 1000% pump and this one was only +350%:
soon i think another bull run and bull market can start and this time i am looking for +200% pump like the green arrow on chart and even more rise only if the red zone on chart break to the upside.
DISCLAIMER: ((trade based on your own decision))
<<press like👍 if you enjoy💚

Shib I knew it!"Shib I new it!" is what i will be saying in the future but don't take my word for it, do your own research. In my opinion, Shiba Inu to a new all time high. When? Who knows?

ALTCOINS | ALT Season | Buy Zones PART 2💥 SUI / BINANCE:SUIUSDT
SUI ideal buying points, weighing heavier towards the lower zone:
💥 SHIBA / BINANCE:SHIBUSDT
SHIB ideal buying zone is approaching, but ideally the lower zone is the better buy:
💥 DOT / BINANCE:DOTUSDT
Dot worries me for the reason that it has retraced nearly all the way to 2021 prices. Therefore I'll keep trades small, with modest TP zones.
BUY zone for a swing, not accumulation:
💥 PEPE / BINANCE:PEPEUSDT
PEPE buy zone seems far away, but considering how hard alts can drop in only a few days, I'd be ready with the orders, hanging heavier towards the lower zone:
💥 BINANCE / BINANCE:BNBUSDT
BINANCE shows promising swings. Ideal BUY zones include:
For the next cycle, in other words long term target, I'd watch the 1.618 at least:
This would make it an accumulation buy.
________________

SHIBUSDT near 0.000010$ support zone wait for pumpAs we said before from here to -20% lower is strong and major daily support zone and is buy area for sure because price also had huge amount of dump so short-term rise or range even can make a good bull candles to the upside like green arrows.
DISCLAIMER: ((trade based on your own decision))
<<press like👍 if you enjoy💚
