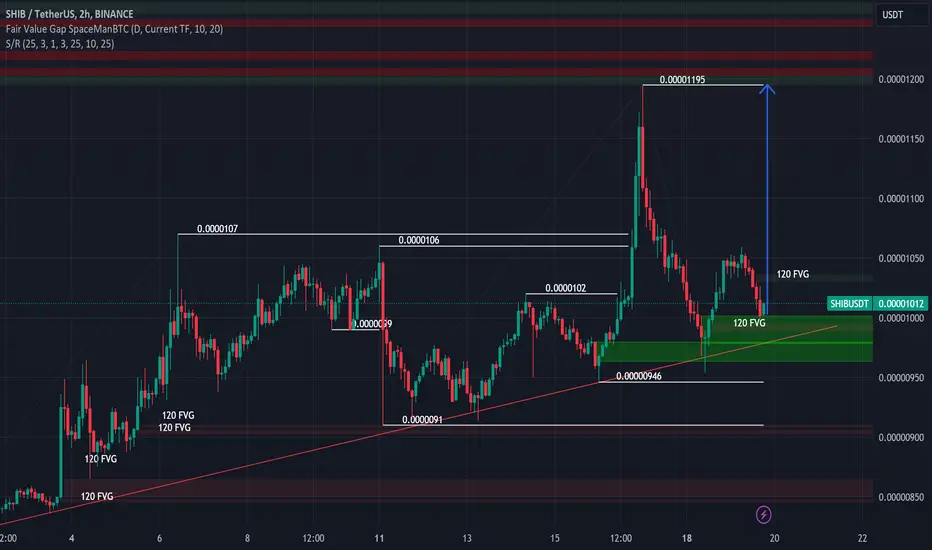
AGAIN BUY SHIBA NOW!!!!!!!!!!SHIBUSDT completed my last analysis predictions now price of shiba just got a bounce from my FVG ZONE am expecting shiba to make its way up to 0.00001195 again above that will remain stable till 0.0000132 is completed
JOIN AND ENJOY
Tell us what you think
SHIBUSDT trade ideas
Shiba Inu: The Meme Coin That's So Bad It's GoodI'm not going to lie, I'm not sure what Shibusdt is. It sounds like a combination of Shiba Inu and Squid Game, which is already pretty funny. But I'm also not sure if it's a good investment. I mean, it's a meme coin, and those are notoriously volatile. But hey, if you're looking for a laugh and a chance to make some money, then Shibusdt might be the coin for you. Just don't say I didn't warn you.

shibusdtbuy :0.0000087
sl: 0.00000798
tp: 0.0000135
you can buy shib 0.00000872 and this is good area for spot and hold

Shiba Inu... Tecnicall and Market psychologyFortunately, Shiba has not yet broken its upward trend line, although the profits it gave us were took , and some did not sell, but there is no need to worry, please don't be just a seller
.I see Shiba rising until the weekend,, it was a correction of the work of the whales, not a technical analysis. This is where a question arises in the mind that how 22% growth suddenly became a loss in this way, I really don't know, but this is the conspiracy of the whales who can create such a queue with a lot of money. Please don't be a seller, the whales 🐋 note is fixing this situation so that they're can buy at lower prices and sell at higher prices, I hope you will make a great profit by the end of the week.

Shib making higher highs Shib continues to impress me. I know the market looks like a blood bath right now, but I absolutely believe Shib is in a bull cycle. It is making higher highs, and it continues in the ascending wedge. Good time to score some cheapies during this drop IMO!

#SHIB/USDT LONG#SHIB
The price has been moving in a descending triangle pattern since April 2022
In a way that respects the occurrence of the triangle on the frame of 3 D
And empty the downtrend was broken strongly
Moving Average 100 is being broken
Price Now 0.00000893
First Goal 0.00001076
Second Goal 0.0001448
We have oversold on MACD
And a strong upward trend

SHIB ANALYSIS🔮 #SHIB Analysis - Breakout 🚀🚀
💲💲 There is a breakout of falling wedge pattern in #SHIB in weekly time frame. $1150 is a crucial resistance level and if #SHIB holds this level then we will see the price range of $1500 in next target. 🚀🚀
💸Current Price -- $0.00001061
📈Target Price -- $0.00001800
⁉️ What to do?
- We have marked crucial levels in the chart . We can trade according to the chart and make some profits. 🚀💸
🏷Remember, the crypto market is dynamic in nature and changes rapidly, so always use stop loss and take proper knowledge before investments.
#SHIB #Cryptocurrency #Breakout #DYOR

SHIN/USDTI expect shiv to reach this target in the next few weeks to months it’s looking very strong in a reversal pattern.

SHIB breakout SHIB have been in a downward chan el for almost 610 days and once we closed this weekly above the channel it will be very bullish.

Shib W on the 1W time frame! This sure does look good to me! It doesn't get much better than a giant w on the one week time frame....

I expect 15x in Shib.I expect 15x in Shib. Be careful as there may be a hard going up and a hard downhill.
#shib #shiba will come the values

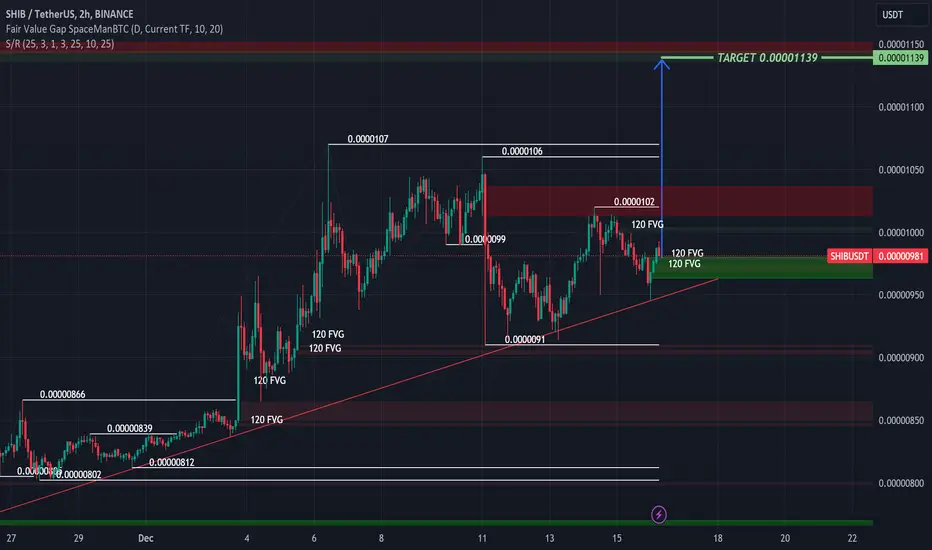
BUY SHIBA NOW!!!!!!!!!Shib just grab the sell-side liquidity tap into my fair value gap am expecting the price of shib to a new high this time to 0.00001139
Above 0.00001139 will maintain stability up to 0.0000142
JOIN AND ENJOY!!!!!!!!
Time for more actionThat is a best and intellegant time for shib to show their trend line for growing up , too cool it stay at this price !!!!

SHIBA SHIBAfter 3 attempts to break the trend line, now if the price crosses the yellow lines, the purchase can be made with a profit target of 80-100%.

SHIB Prepares Breakout Rally For 40% HIKE!Preparation for Double-Bottom Breakout: SHIB price shows signs of gearing up for a double-bottom breakout rally.
Long-Tail Candle at 50-Week EMA: A long-tail candle on the SHIB chart indicates strong buyer interest, bouncing from the 50-week EMA.
Potential Rally to $0.00001438: A successful breakout could propel SHIB to a new rally, potentially reaching $0.00001438.
Bullish Rebound in the Market: SHIB is rebounding along with the broader crypto market, gaining momentum from Bitcoin's positive trend.
5.85% Jump in 48 Hours: SHIB has experienced a 5.85% increase within the last two days, indicating a resurgence in buying interest.
Challenging Overhead Neckline: SHIB is currently challenging the neckline of its double-bottom pattern at $0.00001025.
Trading Above Psychological Mark: SHIB is trading slightly above the crucial psychological level, supported by strong momentum.
Technical Indicator - MACD: The MACD suggests a positive trend, indicating a potential continuation of the uptrend.
Breakout Potential: The market's recovery hints at a possible smooth bullish progression for SHIB, with a key focus on sustaining above $0.000010.
Next Resistance Levels: Post-breakout, the next resistance levels for SHIB are identified at $0.0000125 and $0.000015.
Risk of Decline to $0.000008360: If SHIB fails to maintain its momentum, there's a risk of it dropping to $0.000008360.

Shibainu ... Break the trend line !!!Hello dear traders... Shiba seems to have broken its weekly trend line, I hope it was not a fake failure, in this case, after all this correction time, Shiba is doomed to rise. Good luck .
