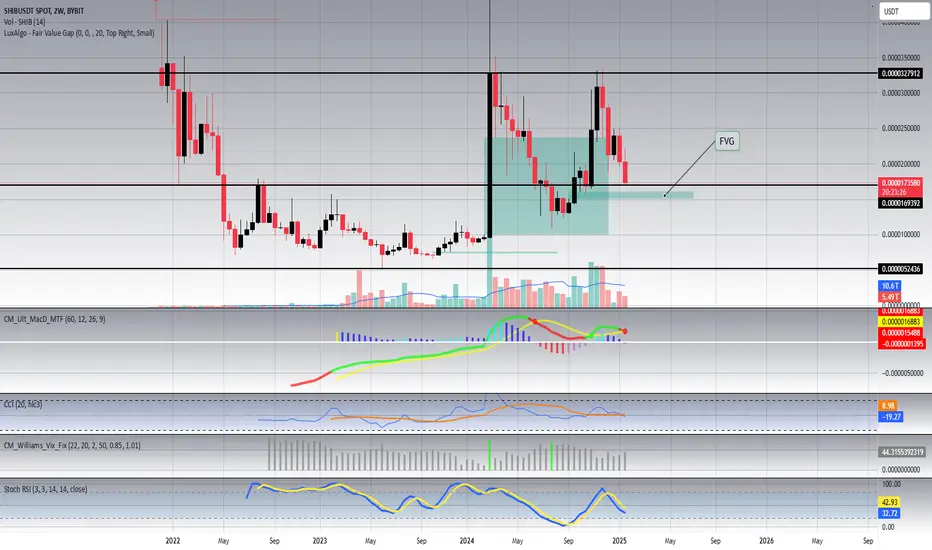
SHIBUSDT Price Action - Liquidity & Order Block AnalysisPremium Zone Rejection:
Price is approaching a FVG (Fair Value Gap), which could act as a resistance zone.
If rejection occurs, smart money may be engineering liquidity to take out lower levels.
Liquidity Levels to Watch:
Feb 3 High (0.000016980): A significant level where liquidity is resting. A potential raid could occur if price breaks structure to the upside.
Feb 2 Low (0.000013080): A key downside liquidity pool where price may seek orders.
Feb 3 Low (0.000011590): The ultimate downside draw on liquidity if price continues distributing lower.
Possible Scenarios:
Bullish Case: A clean break and hold above 0.000015764 could lead to a liquidity grab towards the Feb 3 High.
Bearish Case: Failure to reclaim the fair value gap could send SHIB lower to test 0.000013080, possibly even targeting the Feb 3 Low.
SHIBUSDT trade ideas

Long trade
15min TF overview
Buyside trade
Mon 3rd Feb 25
NY Session AM
1. 45 pm
Entry 0.000015682
Profit level 0.000018691 (19.19%)
Stop level 0.000015628 (0.34%)
RR 55.72
Reason: Observing the full structure of SHIB and incorporating the Wyckoff narrative—specifically Phase A (Selling Climax) and Phase B (Secondary Retest)—was pivotal in mapping directional bias for the buyside trade.

SHIBUSDT Long Trade Setup📊 Price Action & Trend Analysis
Analyzing market trends using price action, key support/resistance levels, and candlestick patterns to identify high-probability trade setups.
Always follow the trend and manage risk wisely!
Price Action Analysis Interprets Market Movements Using Patterns And Trends On Price Charts.
👉👉👉Follow us for Live Market Views/Trades/Analysis/News Updates.

Long trade
4hr TF overview
Buyside trade 1
Sun 2nd Feb 25
LND to NY Session AM
11.00 am
Entry 0.000015469
Profit level 0.000017276 (11.68%)
Stop level 0.000015273 (1.27%)
RR 9.22
Reason: overnight drop (12.82%)
Whykoff narrative: I assumed we reached the Selling climax..?
Indicative of a buyside trade.
Observed 4Hr TF

Bearish Activity SHIB on the 2 Week Chart is very bearish. Last candle was a bearish momentum candle and this candle forming is in the red. What also complicates matters, is the bearish MACD(Chris Moody) crossover that recently happen last candle. If the key level 0.00001693 and the fair value gap underneath don't stop the pain, SHIB can possibly go much lower. Please be careful and do your own research.
Short trade
1Hr TF
Overview
Sellside trade
Sat 1st Feb 25
NY Session AM
11.00 am
Entry 0.000018188
Profit level 0.000017820 (3.08%)
Stop level 0.000018357 (0.93%)
RR 2.18
Reason: Observation of supply dominance on the 1Hr TF
Target liquidity lows

SHIBA update#SHIBA can make another down wave because it made a triangle with 5 waves
there is a down wave before the triangle which is wave A
the whole triangle is wave B
now we are waiting for wave C
its the last correction before making new highs
check out our last analysis on shiba in higher time frames

SHIBA update#SHIBA has a positive pattern NOW !
the market made an ABC correction pattern with a triangle pattern as its wave B if you check out my last analysis on this coin i told you that if the demand zone be touched bullish duration will be strated !

Long trade
15min TF entry
Buyside entry
NY Session PM
4.00 pm
15min TF
Based on the inverted Pin bar
Observation of current price action
PD Array Zones of Influence above 0.5
BOS Brk
Thu 30th jan25
Entry 0.000018713
Profit level 0.000019223 (2.73%)
Stop level 0.000018607 (0.57%)
RR 4.81

Long trade
1Hr TF Entry
Sellside Trade
Pair SHIBUSDT
1min TF
Thu 30th Jan 29
11.00 pm
LND to NY Session PM
Entry 0.000018733
Profit level 0.000019319 (3.13%)
Stop level 0.000018630 (0.55%)
RR 5.69
Buyside trade: Buyside entry is based on the narrative of supply and demand and because of the current observation and momentum of buyside pressure observed with SHIB since the 28th of January 2025.

Short trade
1min TF
Sellside Trade
Pair SHIBUSDT
1min TF
Thu 30th Jan 29
8.30 am
LND to NY Session AM
Entry 0.000018688
Profit level 0.000018576 (0.60%)
Stop level 0.000018725 (0.20%)
RR 3.03
Target equal lows (1min TF observation)
Reason: Price buyside momentum reached exhaustion and pivotal 4Hr supply zone indicative of a sellside trade

Long trade
1Hr TF Entry
Tue 28th Jan 25
NY to Toyko Session PM
5.30 pm
Buyside trade idea
Entry 15min TF
Entry 0.000017939
Profit level 0.000018705 (4.87%)
Stop level 0.000017779 (0.89%)
RR 4.79
Reason: It appears SHiB reached a pivotal demand level with buyside momentum trending to the upside.


SHIB: Big reversal could be around the corner!An inverted head and shoulders pattern is becoming more apparent, signaling a bullish reversal. A significant price reversal may be imminent! If you're looking to trade SHIB at the moment, here's a quick setup that you might find helpful!
The idea is: Buy when the price breaks above $0.000025 and take profits at the levels shown in the chart.
Targets:
1. $0.000028
2. $0.000032
3. $0.000038
4. $0.000045
-------------------------------------------
About our trades:
Our success rate is notably high, with 10 out of 11 posted trade setups achieving at least their first target upon a breakout price breach (The most on TW!). Our TradingView page serves as a testament to this claim, and we invite you to verify it!

Long trade
15min TF overview
Buyside trade
NY to Tokyo Session PM
Mon 27th Jan 25
6.45 pm
Structure Day
Entry 0.000018925
Profit level 0.000019926 (5.29%)
Stop level 0.000018725 (1.06%)
RR 5
The buy-side trade idea is based on the narrative of the supply-and-demand structure on the Day TF.
1Hr TF overview
Entry 15min

Let's discuss and give our opinionsLet's discuss and give our opinions to have the best plan for trading decisions and making good profits from the market. Above is my personal perspective, I will buy at the current price and above all this is investment advice.

Trade Plan for Shiba/USDT Spot Trade 👇🏽👇🏽 Arabic Below | الترجمة بالاسفل 👇🏽👇🏽
Alright, fam! Here’s the breakdown of my risk strategy for this Shiba/USDT play:
📊 The Plan:
• I’m putting 4% of my portfolio on the line for this trade. Risk is calculated and controlled! 🎯
• With a stop loss set at 26%, I’m allowed to allocate 15% of my portfolio to this position. 🛡️
• The goal? Lock in 149% gains if things swing our way! 📈✨
💡 The Math:
If this trade hits, my portfolio will grow by a solid 22.35% from this single move. 💸💪
Let’s see how this plays out — calculated risks, disciplined execution, and the potential for a big win. 🚀🐕💰
Let me know your thoughts, and as always, trade safe out there! 🧠🔑
#Crypto #ShibaInu #RiskManagement #SpotTrading
يا شباب، دي الخطة للصفقة دي، إن شاء الله تجينا منها ارباح مبروكة👇
📊 الخطة:
• مستعد أخاطر بـ 4% بس من المحفظة، مخاطرة محسوبة ما مشكلة! 🎯
• وقف الخسارة عند 26%، يعني بقدر أحط 15% من المحفظة في الصفقة دي. 🛡️
• الهدف؟ لو مشت الحكاية زي ما متوقع، حنطلع بـ 149% أرباح! 📈🔥
💡 الحساب:
لو الصفقة ضربت الهدف، المحفظة بتزيد بـ 22.35% من صفقة واحدة بس. 💸💪
دي مخاطرة مدروسة، والخطة واضحة، لكن أهم حاجة ما تنسى تعمل حسابك كويس! نخش ونشوف الحكاية حتجيب شنو. 🚀🐕💰
وروني رأيكم، وبرضو لو عندكم خطط تانية، مشاركتها واجبة 😂!
#كريبتو #شيبا_اينو #مخاطرة_محسوبة #تداول_سبوت #إدارةـمخاطر

SHIBUSDT BUY With MCIf the market cap of Shiba can reach its range of 40 billion dollars again, a price of 0.000075 could be our target of +300%.
Considering that Doge is a meme coin and has managed to return to its historical market cap ceiling, and also that prominent individuals have intensified the meme coin market with their entry into the meme coin sector, we can expect that the market cap of the coin ranked 2 among meme coins will also return to its historical market cap ceiling.
But in general, prioritize risk management and capital management
Good luck and be profitable 💲🔥

Short trade
SHIBUSDT
Sellside trade
Sun 19th Jan 3.15 pm
NY Session PM
Entry 0.000021842
Profit level 0.000019028 (12.96%)
Stop level 0.000021989 (0.58%)
RR 22.31
Reason: Sellside momentum since 19th Jan,
The , markets seem driven by an influx of Trump inclusion

SHIBA/USDT Potential Reversal or Trend ContinuationThe price is in a downtrend where it has reached a strong zone and made a rebound. Now, the price could move in the direction of buying without returning to our zone. However, if the price approaches our zone again, it improves the entry point for our trade. On the other hand, if the price breaks through our support, we can expect the continuation of the selling trend with appropriate market confirmation.

SHIBUSDT 6DSHIB ~ 6D
#SHIB Double top hard occurs in this coin meme. If the re -testing of this support block occurs, this is a very good opportunity to start buying again. Target 20%+

Bullish Confirmation: SHIBA INU's Short-Term Trade OpportunitiesClear Bullish Confirmation: SHIBA INU's Short-Term Trade Opportunities
SHIBA INU has recently broken out from a strong bullish pattern.
A strong support zone has been identified near 0.00001973.
This area has been tested for two consecutive days this month, increasing the likelihood that this zone may stop the price decline.
Given that we are analyzing a 60-minute chart, the price should take a new direction soon.
Let's see how SHIBA INU unfolds after this clear bullish confirmation for a short-term trade.
You may find more details in the chart!
Thank you and Good Luck!
❤️PS: Please support with a like or comment if you find this analysis useful for your trading day❤️

$SHIBA raised 200%?technical analysis using SNR Original Chart Pattern. will shiba turn up to 200%? trade at ur own risk
