SHIB CautionSHIB after a strong upward movement is forming a long wick candle at a key level and a value zone on the weekly chart. Please Watch out for signs of reversal on Sunday, weekly candle finish printing tomorrow. Be very careful
SHIBUST trade ideas

Bullish for Shiba In my last analysis i mark this zone and now the price trigger the zone and going up as we want and this level is very good level for support for 2x to 3x profits.

SHIBUSDT Price Breaks Flag Pattern!SHIBUSDT has broken out of a bullish flag pattern on the 1H chart and is trading above the 100 and 200 EMAs. The price surged by 60% after breaking through the resistance zone and has been forming a bullish flag pattern over the last 5 days. Today, the price broke through the flag's resistance, and after a minor pullback, a significant bullish move is expected.

SHIBA Targets +50%Hello, friends! 🚀
Today, I'm reviewing the SHIBA cryptocurrency and want to share my latest forecasts with you! 📊 This coin is attracting a lot of attention, and I see great potential in it. Below is my entry strategy and key levels.
🔝 Entry setup with a risk/reward of 1/5 🔝
📊 My Strategy:
🟢 Buy Zone: $0.000022 - $0.000023
📈 Targets (Take Profit):
TP1: $0.000025
TP2: $0.000028
TP3: $0.000032
🛑 Stop-Loss: $0.000021
Don’t forget about risk management! Cryptocurrency is a highly volatile market, so make sure to do your own analysis before making decisions.

SasanSeifi| Will the Uptrend Continue? Key Levels to Watch!
👇previous analyses
Hey there, ✌ Based on previous analyses, the price encountered significant demand around the 0.000013 range. With a strong momentum breakout through the supply zone and surpassing the 200-period moving average, the price successfully reached the second scenario target of 0.000020, showing an impressive growth of approximately 50%. However, without confirming a stable position above the 0.000020 level, the price retraced as outlined in the projected scenario.
It was noted that the price reacted to the EMA, highlighting the 0.000015 level as a crucial support zone. If this support holds and confirmation is achieved in lower timeframes, the price could once again rise towards the 0.000020 range and even higher targets.
As observed, the price was met with renewed demand after maintaining the specified support zone and surged toward the 0.000023 – 0.000025 target range and the 0.000030 level, achieving an additional 83% growth.
👇NEW analyses
Currently, after this rally from the 0.000030 level, a negative reaction has caused a pullback toward the 0.000022 area. The outlook leans bullish. The scenario to consider is that, with the 0.000021 level holding and confirmations in lower timeframes, the completion of the pullback could lead the price to a long-term target at 0.000032 and a liquidity zone around 0.000038. Maintaining the critical levels of 0.000021 – 0.000020 is essential.
💢 Please remember that this is just my personal viewpoint and should not be taken as investment advice. I’d love to hear your thoughts and share opinions!
Happy trading!✌😎
Sure, if you have any more questions or need further clarification, feel free to ask. I'm here to help!✌

SHIBA INU more gainHello and greetings to all the crypto enthusiasts, ✌
In several of my previous analyses, I have accurately identified and hit all of the gain targets. In this analysis, I aim to provide you with a comprehensive overview of the future price potential for SHIBA INU, 📚💣
As observed, a significant influx of trading volume has entered the market for this asset. Moreover, this asset is backed by one of the largest media platforms and communities in the global cryptocurrency space, enhancing its influence and market visibility. 📚🎇
Despite the current momentum, there is a possibility of the price declining further to the next lower Fibonacci support level.📚✌
However, following this potential dip, we anticipate a renewed upward movement, leading to a recovery and subsequent price increase. 🎇💡
🧨 Our team's main opinion is Significant trading volume has entered this asset, supported by one of the largest crypto media communities. The price may dip to a lower Fibonacci level before likely rebounding. 🧨
Thank you for your attention. If you have any questions or comments, I’m here to respond to you. 🐋💡

SHIB Bulls: Hold My Leash!
SHIBUSDT is showing promising bullish signals. The price is currently trading above the EMA Ribbon, which remains in a bullish posture, supporting the upward momentum. The market recently experienced a bullish break of structure, confirming the ongoing trend.
The current resistance at 2945 is proving to be a challenge, with the price showing signs of rejection. However, this could present an ideal opportunity for a pullback, offering potential entry points. The Fibonacci retracement levels highlight the zone between 2000 and 1825 (61.8%) as a key area to watch. This region also aligns with a previous resistance level that now acts as support, enhancing its significance as a strong accumulation zone.
The TSI indicator further reinforces this bullish outlook, sitting comfortably above the zero line with room to grow. If the price finds support and rebounds from the mentioned levels, the next major target lies at 4567, marking a significant upside potential.
Adding to the bullish case, the Signal Builder has recently flashed a buy signal, aligning with the above factors and further boosting the probability of a sustained upward move.
Conclusion: Watch for potential retracements to the 2000–1825 zone for optimal entry. If the bullish momentum continues, a breakout above 2945 could pave the way for a rally toward 4567.
👨🏻💻💭 What’s your take on SHIB’s next move? 🚀
_________________________________________________________________
The information and publications within the 3Commas TradingView account are not meant to be and do not constitute financial, investment, trading, or other types of advice or recommendations supplied or endorsed by 3Commas and any of the parties acting on behalf of 3Commas, including its employees, contractors, ambassadors, etc.

SHIBUSDT heavy pump just started We are looking for more pump here even to targets like 0.000045$ and more and soon we can expect this pump happen and hit our next targes which are red zones on chart.
also major supports are mentioned on the chart because we may have short-term fall first.
DISCLAIMER: ((trade based on your own decision))
<

Bullish for Shiba inuAs my weekly analysis is happening for good strong buying is in and now the support level for shib @0.000025 is very good for buy so don't miss it


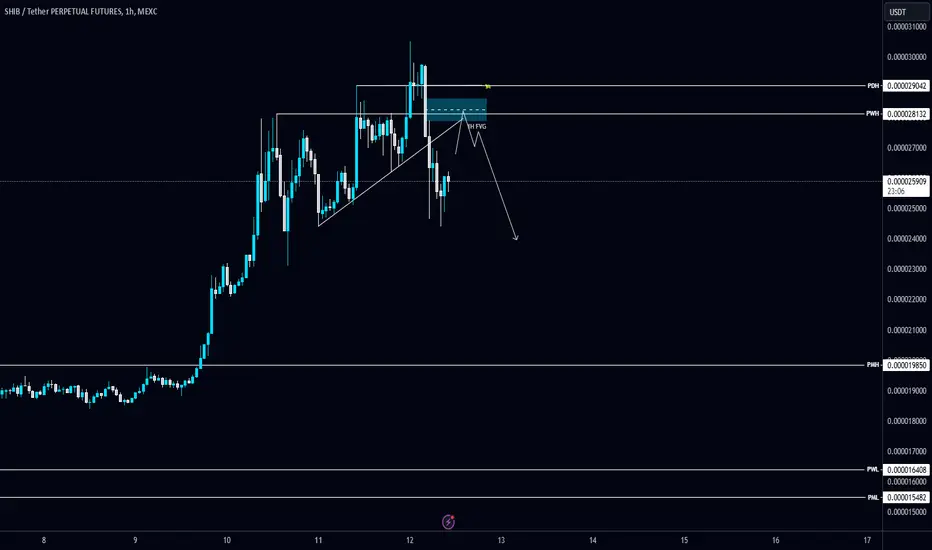
#SHIB/USDT break the Diagonal Trendline in 1-Hour TF!#SHIB/USDT break the Diagonal Trendline in 1-Hour TF!
Wait for 1H FVG to be tapped to shorten it. CRYPTOCAP:SHIB local resistance level is PWH $0.00002813. #SHIBUSDT is holding PMH $0.00001985 support level.
SHIB USDT updateThe analysis is in daily time form, so it takes a little time.
Based on the base that was formed below, I sent my analysis, which fortunately was flawless
I checked it more closely today, not much has changed, but I sorted it out and with more precise targets
Friends, there is no doubt that Shiba is bullish, but it is necessary for this trend to close above 30 candles with a strong body and turn this range from 27 to 29.5 into a strong support.
So, in my opinion, it is still too early to say that his promotion is certain
Wait for it to come above this range, close the candle and then safe entry for those who are still waiting for the opportunity to buy.
Shiba's support:
0.00002628
0.00002450
0.00002313
Shiba resistors:
0.00002958
0.00003300
0.00003915
Shiba targets:
near:
0.00004699
0.00006942
Round:
0.000105
0.0001412
0.0001644

SHIB: Keep an eye on this level! If you're looking to trade SHIB at the moment, here's a quick setup that you might find helpful!
The idea is: Buy when the price breaks above 0.0000283$ and take profits at the levels shown in the chart.
Targets:
1. 0.000029$
2. 0.0000307$
3. 0.0000327$
-------------------------------------------
About our trades:
Our success rate is notably high, with 10 out of 11 posted trade setups achieving at least their first target upon a breakout price breach (The most on TW!). Our TradingView page serves as a testament to this claim, and we invite you to verify it!

SHIBA INUAlready the downtrend started in March
0.000020 Resistance breakout can led to the 0.000040

in the wave 4... to the moon!The upward trend will continue. We are in the fourth wave, and it seems that this upward trend is going to lead us to very high goals. The market only experiences a short correction in one upward trend.

Analyzing the Impacts of Shiba Inu's Ambitious US Hub Plan
Shiba Inu's Bold Vision for a US Blockchain Hub
Shiba Inu, the popular meme coin, has recently made headlines with its ambitious plan to establish a strategic blockchain innovation hub in the United States. This bold move, proposed by lead developer Shytoshi Kusama, has sent ripples through the crypto community, leading to a significant 23% surge in the price of SHIB.
A Silicon Valley for Crypto
Kusama's vision is to create a "Silicon Valley for crypto" within the US, fostering innovation, job creation, and economic growth. The proposed hub aims to attract top talent, startups, and investors to the United States, solidifying its position as a global leader in blockchain technology.
The proposed hub, dubbed S.H.I.B., is estimated to cost several billion dollars over a 5-10 year period. However, Kusama believes the long-term benefits far outweigh the initial investment. The hub is expected to generate significant economic activity, create thousands of jobs, and attract numerous blockchain projects to the United States.
Key Components of the S.H.I.B. Plan
• Infrastructure Development: The hub will invest in state-of-the-art infrastructure, including high-speed internet, data centers, and research facilities.
• Economic Incentives: The plan includes tax breaks, grants, and other incentives to attract businesses and talent to the hub.
• Talent Development: The hub will focus on education and training programs to develop a skilled workforce in blockchain technology.
• Regulatory Framework: The hub will work closely with regulators to create a clear and supportive regulatory environment for blockchain businesses.
• Sustainable Practices: The hub will prioritize sustainability, incorporating green energy solutions and eco-friendly practices.
The Impact on SHIB
The announcement of the S.H.I.B. plan has had a significant impact on the price of SHIB. The cryptocurrency has experienced a 23% surge in value, reflecting investor enthusiasm for the project. This surge highlights the potential of the Shiba Inu ecosystem and its ability to drive innovation and growth in the blockchain industry.
The Broader Implications
Shiba Inu's ambitious plan is not only significant for the cryptocurrency but also for the United States as a whole. By attracting top talent and fostering innovation, the hub could help the US maintain its competitive edge in the global technology race.
Moreover, the S.H.I.B. initiative could have a positive impact on the broader cryptocurrency industry. By creating a supportive ecosystem for blockchain businesses, the hub could accelerate the development of new technologies and applications.
Conclusion
Shiba Inu's proposal for a strategic blockchain innovation hub in the United States is a bold and ambitious endeavor. If successful, the hub could transform the US into a global leader in blockchain technology, creating significant economic and social benefits. The 23% surge in SHIB price reflects the market's optimism for the project and its potential to drive future growth.


SHIB to moon following TRUMPType: Crypto
Ticker: SHIBUSD
Execution metrics:
* Entry: $0.00002581
* TP: $0.00008746
* SL: $0.00001483
Support:
* Technical Justification: Leaving demand. Closing higher. Engulfing.
* Fundamental Justification: Bullish office for crypto following elections, BTC ATH
Disclaimer: We are not a brokerage or investment firm. We do not offer financial advice or investment advice and/or signals. This is not certified financial education. We offer access to the daily thought process of an individual and his experiences.

SHIBUSDT heavy pump ahead As we said before we are seeing high potential possibility of pump and rise here and soon that can start and it is already started but soon high volume with rise will lead market here and hit our targets mentioned on the chart.
DISCLAIMER: ((trade based on your own decision))
<

SHIBUSDT wait for huge pump soon price above 0.00003$As we said before we are looking for high potential pump here like the green arrows on chart.
also major daily supports and resistances are all mentioned on the chart too.
DISCLAIMER: ((trade based on your own decision))
<

SHIBA Comeback New Highs soon! Shiba Inu, the meme coin that took the world by storm, is showing signs of re-igniting its fiery spirit. After a period of consolidation, the Shiba Inu community is buzzing with renewed optimism, fueled by its expanding ecosystem and growing adoption. With the launch of Shibarium, its Layer-2 scaling solution, and the rising interest in meme coins, Shiba Inu is poised to break out of its current price range and potentially reach new heights in 2025. The future of Shiba Inu is looking brighter than ever, and with its dedicated community and innovative developments, it's ready to unleash its full potential.

SHIB/USDTPLEASE TRADE AT YOUR OWN RISK reason 15 min ob respect with 4 hour zone and for upper lqd zone tare at your own risk

SHIBUSDT A piece of trash with rising potencialThis piece of garbage has the potential upto the target i've shown
and i say potential i'm not saying it's getting there
Jesus Christ how do u people buy these things !!!
i rather buy goat's poo and sleep on it than this piece of dog vommit
