SHIB priceFor the past few trading sessions, it remained in the closed range and faced rejection from its 50 day EMA mark.
SHIBUST trade ideas

SHIB ANALYSIS🔮 #SHIB Analysis 💰💰
🌟🚀 As we can see that there is a breakdown of descending triangle in #SHIB. There is a support level at $0.00001902, it will first retest its support level then after that we would see a reversal from support level . 🚀🚀
#SHIB #Cryptocurrency #DYOR

Long trade
Pair: SHIBUSDT
15th June 24
Structure 4hr TF
Entry 15min TF
London to New York Session
19.45pm
Entry 0.00002078
Profit level 0.00002632 (26.60%)
Stop level 0.00002027 (2.45%)
RR 10.84
Mapping entry..?
Phase B Secondary re test _Wyckoff method

Long trade
Friday 3rd May 24
19.00pm
Tokyo Session
Entry 0.00002483
Profit level 0.00002819 (13.53%)
Stop level0.00002346 (5.25%)

SHIBUSDT Trading Signal: BuyDear Traders,
We have identified a trading opportunity for the currency pair SHIBUSDT. Below are the specifics for executing this trade:
Direction: Buy
Enter Price: 2.077E-05
Take Profit: 2.118E-05
Stop Loss: 2.017E-05
Rationale:
This signal is generated using the EASY Quantum Ai strategy, which utilizes advanced algorithms to analyze market trends and price movements. Here are the key factors influencing this signal:
1. Market Momentum: Our data analysis indicates an upward momentum in SHIBUSDT, driven by recent positive sentiment and increased trading volume.
2. Historical Support Levels: The enter price of 2.077E-05 aligns with a historical support level, which suggests a good entry point for a potential upward movement.
3. Resistance Projections: The take profit level at 2.118E-05 has been identified as a short-term resistance point. Breaking this level could signal a continuation of the bullish trend.
4. Risk Management: The stop loss at 2.017E-05 is strategically placed to minimize potential losses, ensuring a controlled risk environment.
We advise monitoring the trade closely and adjusting as market conditions evolve. Ensure you have your risk management strategies in place when executing the trade.
Stay informed and trade wisely!
Sincerely,
Your Trading Strategy Team

SHIB Daily LongIt seems that CRYPTOCAP:SHIB can correct up to the specified range. The market has taken a corrective downward trend in recent days and there is no good reason for the market to become bullish. What it seems is that this time and price break is necessary for the market to continue its upward trend.

SHIB: buy📊Analysis by AhmadArz:
🔍Entry: 1875
🛑Stop Loss: 1728
🎯Take Profit: 2009 - 2137 - 2334
🔗"Uncover new opportunities in the world of cryptocurrencies with AhmadArz.
💡Join us on TradingView and expand your investment knowledge with our five years of experience in financial markets."
🚀Please boost and💬 comment to share your thoughts with us!

$SHI / USDT bullish wave coming soon. Be ready!CRYPTOCAP:SHIB is in a bullish pennant flag that is about to break out to the upside. It is a beautiful flag with a huge pole, perfectly executed.
The Fibonacci retracement is giving us the target price (TP) with 100% potential.
Just follow the chart; it is pretty obvious. The Stochastic RSI is about to pump on the daily chart.
Everything is aligned for a bullish wave.
DYOR (Do Your Own Research), as anything can happen. This is my personal opinion, not investment advice.

SHIBUSDT 1D#SHIB is currently sitting in its support zone, suggesting a potential bounce from this level. If it loses this support, the next level to watch is $0.00001830, which aligns with the daily MA200. Should a breakout occur, the target levels are:
$0.00002757
$0.00003184
$0.00003712
$0.00004567

SHIBUSDT Trading Signal: Buy AlertDear Traders,
We have identified a promising opportunity in the SHIBUSDT currency pair using our proprietary EASY Quantum Ai strategy. Below are the specifics of the trade signal:
Direction: Buy
Enter Price: 2.369E-05
Take Profit: 2.564E-05
Stop Loss: 2.16E-05
Rationale for the Signal: Our EASY Quantum Ai strategy has flagged this buy opportunity based on several key market indicators:
1. Market Momentum: Recent analysis shows a surge in buying interest in SHIBUSDT. Momentum indicators suggest a strong upward trend is forming, making it an ideal time to enter a long position.
2. Support and Resistance Levels: The current market price has found solid support around the 2.369E-05 level, reducing downside risk. Furthermore, our projections indicate that the price has room to move upward toward our take profit target of 2.564E-05.
3. Volume Trends: Observations indicate increasing trading volumes, which typically precede substantial price movements. High volumes can signify strong investor confidence and potential for price acceleration.
4. Quantitative Analysis: Our quantum-based models predict a high probability of SHIBUSDT reaching our TP levels while maintaining a manageable risk with our predefined SL.
By following this signal, you can capitalize on the current market dynamics and potentially achieve significant gains. Please ensure you set your orders as per the specified entry, take profit, and stop loss levels.
Stay tuned for more updates and trade responsibly.
Best regards,
Your Trading Team
Shiba is currently well-positioned for growthIn the daily chart of Shiba, positive divergence is visible across multiple indicators. This suggests that Shiba is in an excellent position to experience significant growth from this area. Positive divergence occurs when the price makes lower lows, but indicators like RSI and MACD make higher lows, signaling weakening bearish momentum and a potential upward reversal.
Shiba is currently well-positioned for growth. If Bitcoin and the broader market conditions remain stable, Shiba could see considerable growth from this range.

When Shiba will explode? between 0.000025-0000.26Personal idea: based on the Shiba movements and daily chart, in my opinion closing daily above 0.000026, likely will give Shiba opportunity to explode with factor of 3x -4x to get around 0.000075 or higher in this running cycle. Good 🙂 luck 👍

Shiba Inu (SHIB): where to next? | 10.06Shiba Inu has failed to hold the 100 EMA support level and has opened below it during this trading session. The fact that the price of the meme token is moving below this moving average raises substantial concerns and may be a negative signal for investors. The next support level for the asset is not far away but is located below a crucial resistance level.
The Shiba Inu chart shows a bearish trend as it tries to stabilize above the 100 EMA. If selling pressure gets more intense, the price may approach the next major support at $0.000019, as indicated by the break below this support level.
For SHIB this area will be crucial because it has the potential to either provide a base for a rebound or, in the event that it is breached, to cause further declines. There are bearish signals being displayed by technical indicators such as the RSI. The fact that the RSI is currently in close proximity to the oversold area suggests that the selling pressure might continue.
Nevertheless, if buyers intervene to take advantage of the lower prices, the oversold situation also creates the chance of a brief rebound. The volume profile indicates a decline in trading activity in comparison to earlier sessions. In a downtrend, lower volume usually signals waning buying interest, which may make it difficult for SHIB to stage a significant comeback anytime soon.
A more pessimistic outlook for the meme token is further supported by the declining volume, which suggests that investors are distancing themselves from the token. A rebound may be imminent if SHIB is able to maintain this level and show signs of strength, suggesting that the worst of the selling may have passed.
WHITEBIT:SHIBUSDT

Shibusdtlet's go just buy and do not afraid,
StopLoss => a bearish candle closed in Daily TF below the BPR box

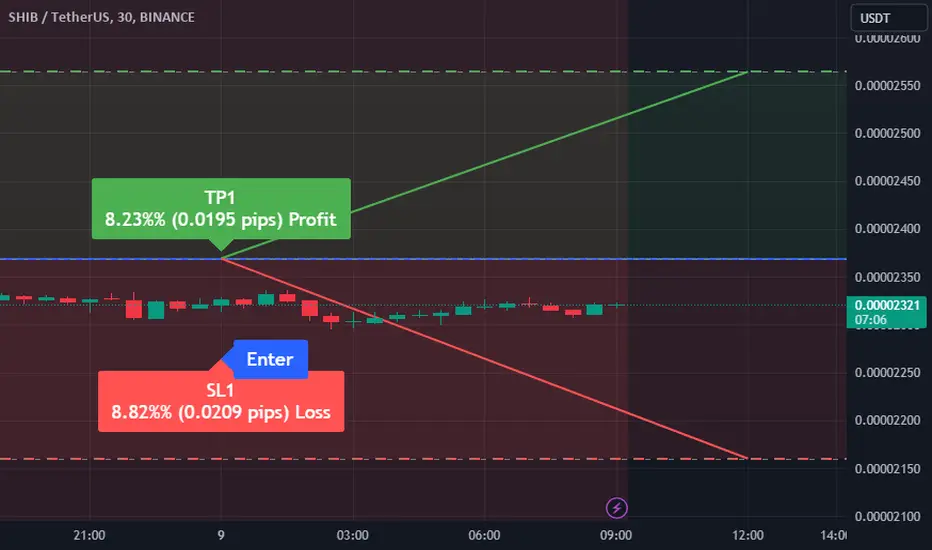
SHIBUSDT Sell Signal AlertDear Traders,
Based on the latest analysis, we have identified a potential SELL opportunity for the SHIBUSDT currency pair. This forecast is made using the EASY Quantum Ai strategy, which leverages advanced algorithms and historical data for precise market predictions.
Direction: Sell
Enter Price: 2.291E-05
Take Profit: 2.253E-05
Stop Loss: 2.346E-05
Reasoning:
1. Overbought Conditions: SHIBUSDT appears to be in an overbought condition, as suggested by our momentum indicators. This often signals a potential downward correction.
2. Resistance Level: The enter price of 2.291E-05 aligns with a significant resistance level that SHIBUSDT has struggled to break in recent trading sessions.
3. Volume Analysis: Recent volume trends indicate a decrease in buying pressure, supporting the possibility of a sell-off.
This alert is generated to help you make informed decisions and maximize profit potential while managing risks effectively. As always, ensure to adjust your trading strategy to reflect your personal risk tolerance and investment goals.
Happy Trading,
EASY Quantum Ai Team

SHIBUSDT Trading Signal: BuyDirection: Buy
Enter Price: 2.349E-05
Take Profit: 2.379E-05
Stop Loss: 2.307E-05
We have identified a promising buying opportunity for the SHIBUSDT pair.
Why Buy?
The SHIBUSDT pair is currently showing strong bullish signals, according to our EASY Quantum Ai strategy. Our analysis considers multiple factors, including:
1. Trend Analysis: The recent trend for SHIBUSDT has shown consistent upward movement, indicating a strong buying momentum.
2. Volume Analysis: There has been a significant increase in trading volume, which often precedes price movements.
3. Technical Indicators: Key technical indicators such as RSI and MACD are supporting the bullish trend, with RSI not yet in the overbought zone, suggesting there is still room for growth.
Risk Management:
Always ensure proper risk management by adhering to the recommended Take Profit and Stop Loss levels. This approach minimizes potential losses while maximizing potential gains.
Stay tuned for more updates, and trade wisely!
Note: This signal is generated using the EASY Quantum Ai strategy.

SHIB ANALYSIS (4hr)🚀#SHIB Analysis : Pattern Formation
🔮As we can see in the chart of #SHIB that there is a formation Head And Shoulder Pattern and it's a bearish pattern. If the candle retests the neckline then we would see a little dump in #SHIB📊
🔰Current Price: $0.00002340
🎯 Target Price: $0.00002060
⚡️What to do ?
👀Keep an eye on #SHIB price action. We can trade according to the chart and make some profits⚡️⚡️
#SHIB #Breakdown #Cryptocurrency #TechnicalAnalysis #DYOR

bulls take control after 800 days of pain 🔥boost and follow for more 🚀 in the last few weeks shiba has finally broken its bearish downtrend, its time for the bulls to take the wheel... sorry bears 😉
maybe a bit of sideways/consolidation before the next move, but looking for a rally .000054-.000067-.000088 in the medium/short term. 🎯🔥

$SHIB TO THE MOON ?👨🏻💻 CRYPTOCAP:SHIB
#SHIB had a quick dip below the support line to trigger stop losses, but is now showing a strong upward movement👀
We'll have to wait and see if the price can break through the descending resistance, as the next move will be decided by a break of the triangle pattern📈
- - - - - - - - - - - - - - - - - - - - - -
Follow #CryptoEase and Share it With Your Crypto Mate 😉
BINANCE:SHIBUSDT

Bull Go Shib will pump today because of the blackrock and spaceX interest in crypto market this week, they will invest in it because of the stability of 70K test of BTC and now its predicted that BTC will pass to 80K and 100K this year.

SHIBUSDT Scenario to earn 5x price growth / (Memecoin Basket)BINANCE:SHIBUSDT
COINBASE:SHIBUSD
Hello Traders
SHIB is one of my suggestions for the altcoin market (Memecoin Basket).
Highly potential for the alt rally season.
The best strategy for altcoins is to allocate a certain percentage of assets (for example, 10% of the total portfolio) to buy potential altcoins.🎲
As the alt-season rally approach, the demand for meme coins will increase continuously.

SHIB: buy in best level📊Analysis by AhmadArz:
🔍Entry: 2425
🛑Stop Loss: 2244
🎯Take Profit: 2606 - 2808
🔗"Uncover new opportunities in the world of cryptocurrencies with AhmadArz.
💡Join us on TradingView and expand your investment knowledge with our five years of experience in financial markets."
🚀Please boost and💬 comment to share your thoughts with us!

our prediction happened late now its timewith the recent BTC 70k meet back now its time for shib to lose another zero from 0.000025 to 0.000045 then to lose a zero at a blink and for sure market will always see zigzags. for early traders and daily traders it will be a big chance of income.
