Will #SHIB Continue Pumping or a Bull Trap is Waiting for Bulls?Yello, Paradisers! Will #SHIBUSDT continue flying, or are we about to witness a brutal rejection straight into the demand abyss? Let’s break it down.
💎#SHIB has recently broken out of a Descending Broadening Wedge Formation on the 4H chart, a pattern that historically signals potential bullish reversals. This breakout was strong, but the price has now hit a critical Supply Zone between 0.00001530 – 0.00001650, and has already shown signs of rejection from this area.
💎The structure shows #SHIBUSD facing Strong Resistance just below 0.00001711—a level that acts as Bearish Setup Invalidation. If the price closes decisively above this zone, bears will lose control, and we could see a sharp squeeze up toward 0.00001900.
💎However, the more probable scenario for now is a retest and rejection from the supply zone, followed by a deeper pullback. Based on volume profile and historical price behavior, the Support Zone around 0.00001181 is a key level to watch for a possible bounce. If this level is lost, SHIB could fall to sweep the swing low (SH) at 0.00001081 to complete a liquidity grab before resuming any bullish trend.
💎RSI is currently near overbought territory, suggesting SHIB may be due for a short-term correction or consolidation. This lines up with the visual expectation of a potential ABC correction back into support, where Wave A has started and Wave B might complete soon.
Patience and precision are key in these conditions wait for strong confirmation before making your moves.
MyCryptoParadise
iFeel the success🌴
SHIBUST trade ideas

FallAs the market enters a downtrend, certain cryptocurrencies are likely to experience significant declines.

SHIBUSDT 6DSHIB ~ 6D Analysis
#SHIB Buy gradually from here with a short -term target of at least 20%+.

Shiba Inu Nears Major Support - Breakdown or Bounce?The $0.000005 - $0.000008 range has been a key support zone for Shiba Inu over the years. With a double-top "M" pattern in play since March 2024, and current market price at $0.00001231, CRYPTOCAP:SHIB is approaching this critical area once again.
What do you think - will price test the zone, or is a pump incoming from here?
Drop your thoughts!
Kindly support this idea with a LIKE👍 if you find it useful🥳
Happy Trading💰🥳🤗

SHIB/USDT Price is approaching a strong support zone around🔍 1. Price Trend
SHIB is currently trading inside a descending channel, capped by a major downward trendline (black line).
Price is approaching a strong support zone around 0.00001150 – 0.00001200, aligning with the 0.786 Fibonacci level (0.00001503) — a common area for bullish reversals.
📊 2. Technical Indicators
✅ RSI (Relative Strength Index)
RSI is at 34.17, close to the oversold zone (30).
Slight bullish divergence between RSI and price suggests a potential upcoming bounce.
✅ MACD
MACD line is starting to cross above the signal line from below → bullish crossover.
Momentum is still weak, but this is often an early sign of trend reversal.
✅ WTO (Wave Trend Oscillator)
WTO is curving upwards, and green histogram bars are forming.
This signals early buy pressure and potential for an upside move.
✅ Cluster Algo
The main line is turning up from the lower band.
The appearance of green dots under the oscillator suggests early accumulation and a possible trend reversal.
☁️ Ichimoku Cloud
Price is trading below the Kumo cloud, meaning the overall trend is bearish.
However, the cloud is thin ahead → potential breakout zone if buyers step in.
🔢 Fibonacci Retracement (from top to bottom)
Key resistance levels:
0.786: 0.00001503 (close to current price, possible bounce)
0.618: 0.00002153 (major resistance)
0.5: 0.00002609 (midpoint target)
These levels act as potential resistance targets if price begins to recover.
🧠 Summary Table
Factor Signal
Price Trend Bearish (within downtrend channel)
RSI Near oversold, bullish divergence
MACD Bullish crossover, early momentum
WTO Upward signal, green bars forming
Cluster Algo Green signals appearing, bullish lean
Ichimoku Still bearish but near breakout area
Fibonacci Near 0.786 support – reversal potential
🎯 Suggested Scenarios:
Short-term: Possible technical bounce toward 0.000015 – 0.000017 range.
Mid-term: If SHIB breaks the descending channel, targets may extend to 0.0000215 (Fibo 0.618) and 0.000026 (Fibo 0.5).
Long-term: A proper reversal needs confirmation via breakout above the Ichimoku cloud and trendline resistance.

SHIBA World (Update)Hi every one , maybe we change fibo level :) The Robinhood page for SHIB displays the price next to a 'Buy Shiba Inu (SHIB)' widget. It also prompts users to sign up to buy SHIB. The site states: "Sign up for a Robinhood Crypto Account to buy or sell Shiba Inu commission-free."

SHIBUSDT Buy Signal We see Head and Shoulders pattern on SHIB H4 chart. Daily chart is also bullish. after few losses this position can make great comeback. Risk reward 1/5

SHIBUSDT near last and major monthly support zonesAs we can see price is near last major supports like 0.000006$ and we are looking for heavy and huge gain from this support to the upside and possible targets which are mentioned on the chart with red zones now.
DISCLAIMER: ((trade based on your own decision))
<<press like👍 if you enjoy💚

SHIB/USDT starting bullish
✅ 1. Current Price Zone
Current price: 0.00001390 USDT
Price is near the 0.786 Fibonacci retracement level (0.00001503) – a strong historical support zone.
📉 2. RSI (Relative Strength Index)
RSI (14): 39.18 – slightly oversold but not yet deeply oversold.
RSI is starting to curve upward, suggesting a potential short-term rebound if it crosses above the moving average line (currently at 42.90).
📊 3. MACD (Moving Average Convergence Divergence)
Histogram bars are shrinking, indicating selling momentum is weakening.
The MACD and Signal lines are getting closer to a potential bullish crossover in the coming weeks.
📈 4. Key Fibonacci Retracement Levels (from recent high):
0.5 Fib: 0.00002609 – medium-term resistance.
0.618 Fib: 0.00002153 – common take-profit zone.
0.786 Fib: 0.00001503 – current support level.
🚀 5. Fibonacci Extension Targets (if breakout occurs):
1.272 Extension: 0.00005975
1.618 Extension: 0.00007298
🔄 6. Candle Pattern
The current Heikin Ashi candle is green with a long lower wick, suggesting possible exhaustion of the downtrend and early signs of reversal.
🧭 Summary & Outlook
✅ SHIB is testing a strong support level and showing early signs of a potential bounce.
🔄 No clear breakout yet, but RSI and MACD are starting to shift bullish.
📉 If price breaks below 0.00001503 → next key support could be around 0.00001000.
📈 If support holds → upside targets are 0.00002153 → 0.00002609 in the short term.

ShibaInu SHIB price analysisNow the price of CRYPTOCAP:SHIB is at the top of the Buy zone.
But do we want to buy this asset in our portfolio: more likely no than yes.
Well, who already has #ShibaInu purchased, then he can only wait for a miracle in the form of at least x2 growth by the summer of 2025, to the range of $0.000029-0.000030
Or maybe OKX:SHIBUSDT price will repeat the "feat" of its older brother CRYPTOCAP:DOGE ? 👇
The patterns of price behavior on the global chart are quite similar, what do you think ?

#SHIB/USDT#SHIB
The price is moving within a descending channel on the 1-hour frame, adhering well to it, and is on its way to breaking it strongly upwards and retesting it.
We are seeing a bounce from the lower boundary of the descending channel, this support at 0.00001100.
We have a downtrend on the RSI indicator that is about to break and retest, supporting the upward trend.
We are looking for stability above the 100 moving average.
Entry price: 0.00001224
First target: 0.00001284
Second target: 0.00001344
Third target: 0.00001417

Shib Long to Supply ZoneI am expecting SHIB to head back to Supply Zone as price is coiling up and is looking to retest that zone.
Multiple Assets have already flashed a move that the supply area is where the market wants to head to. This is a classic market rotation of liquidity move in which we call a precursor.

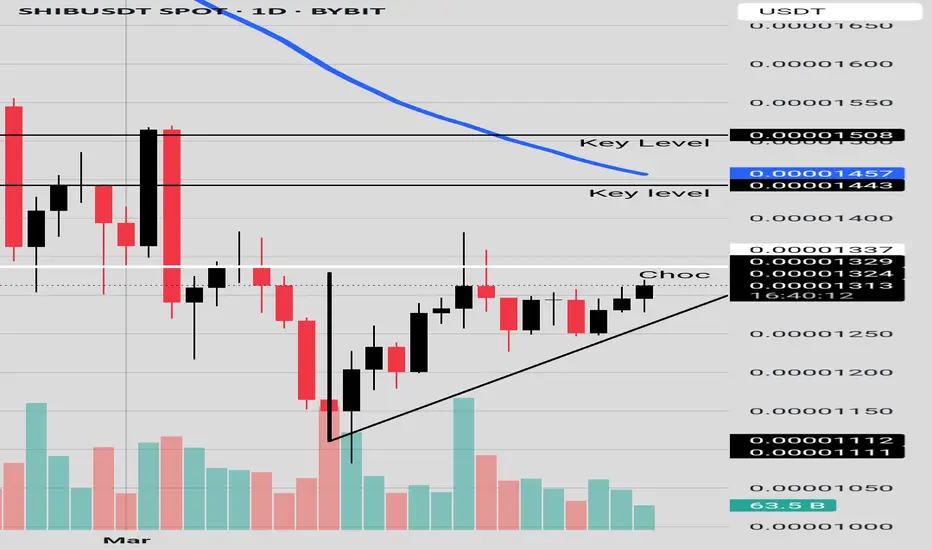
Ascending TriangleGood day Team:
Shib is in an ascending triangle and needs a strong breakout from 0.00001337 to start a short term upward trendshift, even then it is still under the 200EMA and 50 EMA so long term trend will still be bearish until those levels are broken. Be careful and watch for the breakout of the triangle.
#SHIBUSDT It is repeating the previous corrective wave exactly.
We see a solid green support zone that could provide good support.
So we are watching for an entry into this zone.

SHIBUSDT ShortSHIB consolidation on H4 chart. Now price at the resistance level and starts downtrend to retest support level.

SHIBUSDT another +250% is cooking As we can see it seems that orange zone support break to the downside and pump can start from green zone which major monthly support for SHIBUSDT but also we should consider huge amount of fall happened and this orange zone may be broken fake and soon even before touching green zone price can pump above it and retest one more time and huge pump start even sooner.
DISCLAIMER: ((trade based on your own decision))
<<press like👍 if you enjoy💚

SHIBUSDT near major daily support pump ahead soonAs we said before and we can see on chart major daily support here is 0.000005$ to 0.000010$ and we are looking for heavy pump for SHIBUSDT ASAP like the green arrows mentioned on the chart also remember we may have 1-2 months range zone first and then start of gain.
DISCLAIMER: ((trade based on your own decision))
<<press like👍 if you enjoy💚

Shib Analysis on Daily Time FrameThe chart you shared is a daily time frame analysis of SHIB/USDT on Binance. Here are some key observations:
1. Price Action:
The price is in a downtrend, forming lower highs and lower lows.
It is moving inside a descending channel, with the price currently near the lower boundary.
There are change of character (ChoCH) and break of structure (BOS) points, indicating possible shifts in trend momentum.
2. Support & Resistance:
There is a strong support level around 0.0000100 USDT, marked as "Strong Low."
The resistance levels are indicated by red zones around 0.0000200 - 0.0000328 USDT, with the highest level being labeled as a "Weak High."
The price is currently reacting to a demand zone near the lower boundary of the descending channel.
3. Moving Averages:
The blue (200 EMA), orange (100 EMA), and red (50 EMA) moving averages are above the current price, acting as resistance.
A potential bullish reversal may occur if the price can break above these EMAs.
4. RSI (Relative Strength Index):
The RSI is near the oversold zone (below 50) but appears to be recovering, indicating possible bullish momentum.
A bullish divergence could be forming.
5. Volume:
Volume spikes indicate potential buying interest at lower levels.
A significant increase in volume would confirm a breakout from the descending channel.
Conclusion & Potential Scenarios:
Bullish Scenario: If SHIB breaks out of the descending channel with high volume, we could see a move towards 0.0000150 USDT, followed by 0.0000200 USDT.
Bearish Scenario: If SHIB fails to hold the support around 0.0000100 USDT, it may drop further to lower levels.
Would you like a more detailed breakdown or potential trade setups? 🚀

Good DCA zone buy for SHIBI don't care much for SHIB, but can't ignore that if this holds (i.e., 3D closes green, volume stays green and above average), this looks pretty bullish.

Will Shiba’s 20% decline reach the crucial 0.0000090 support?Hello and greetings to all the crypto enthusiasts, ✌
All previous targets were nailed ✅! Now, let’s dive into a full analysis of the upcoming price potential for Shiba 🔍📈.
Shiba appears to have become a stagnating asset, resembling a "walking dead" in the market. In my upcoming educational analysis, I will delve deeper into such tokens, providing a more comprehensive understanding. Currently, Shiba is trapped within a descending channel, and I anticipate a further decline of at least 20%. The primary target for this downtrend is 0.0000090, a significant monthly support level that will play a crucial role in determining its future price action.📚🙌
🧨 Our team's main opinion is: 🧨
Shiba is stuck in a downtrend, with a 20% drop likely, targeting the key support at 0.0000090.📚🎇
Give me some energy !!
✨We invest hours crafting valuable ideas, and your support means everything—feel free to ask questions in the comments! 😊💬
Cheers, Mad Whale. 🐋


SHIB Experiences Token Burns: What's Next?Shiba Inu (SHIB) is currently trading at $0.00001166. This price reflects a sharp decline from $0.00001541 on March 10, aligning with a broader cryptocurrency market downturn that saw the total market capitalization drop by 4.4% over the past 24 hours. SHIB’s current price sits below its 50-day SMA ($0.00001647) and 200-day SMA ($0.00001939), signaling a bearish trend in the medium to long term. Recent social media posts on X note a significant token burn rate, with over 15 million SHIB burned in the last 24 hours, reducing supply, a factor that could bolster the price over time. However, for the short-term 1-hour timeframe, volatility and market sentiment are driving the action.
Technical Indicators and Key Levels
On the 1-hour chart, SHIB is testing a key support zone around $0.00001100, with additional support levels at $0.00001051 and $0.00001001 if the downward pressure continues. The price is likely below short-term moving averages (e.g., 20-period or 50-period), reinforcing the bearish momentum in this timeframe. The Relative Strength Index (RSI) was recently reported at 31.80, hovering near oversold territory (below 30), which could suggest a potential bounce if buying interest picks up. On the upside, resistance levels to watch include $0.00001278, $0.00001403, and the recent high of $0.00001541. Breaking these levels would require a shift in market dynamics, likely accompanied by a surge in trading volume.
Potential Scenarios and Trading Considerations
Two primary scenarios emerge for SHIB on the 1-hour chart. Bullish Case: If the price holds above $0.00001100 and attracts buyers, it could rally toward $0.00001278 or even $0.00001403, especially if volume increases on upward moves. However, the broader market’s bearish sentiment might limit gains, so any recovery could be short-lived. Bearish Case: If selling pressure breaks $0.00001100, SHIB could slide toward $0.00001051 or $0.00001001, particularly if high volume confirms the downtrend. The recent token burns add a positive long-term narrative, but their impact is unlikely to dominate this short timeframe. Traders should also monitor broader market catalysts—such as shifts in crypto sentiment, that could influence SHIB’s next move.
Final Tips
In this volatile setup, timing is critical. Watch the $0.00001100 support closely, a hold or break here will dictate the short-term direction. Look for volume spikes to confirm any breakout above $0.00001278 or breakdown below $0.00001100. Given the market-wide downturn, risk management is essential, use tight stop-losses and avoid chasing momentum without confirmation. Stay alert for news or whale activity that could jolt the price, and let the chart guide your decisions.
Potential Price Movements
Bullish Scenario: A move above $0.00001278 could target $0.00001403.
Bearish Scenario: A drop below $0.00001100 may test $0.00001051 or lower.
Note: Volume confirmation is key, watch for spikes to validate price action.

SHIBUSDT major daily support zones aheadAs we can see price is now near two major daily supports and each can pump the price at least to the first target which is 0.000025$.
one support is near 0.000010$ and the major one is 0.000005$ which is last support zone also and we can expect now range for a while here or pump to the targets from these supports.
DISCLAIMER: ((trade based on your own decision))
<<press like👍 if you enjoy💚
