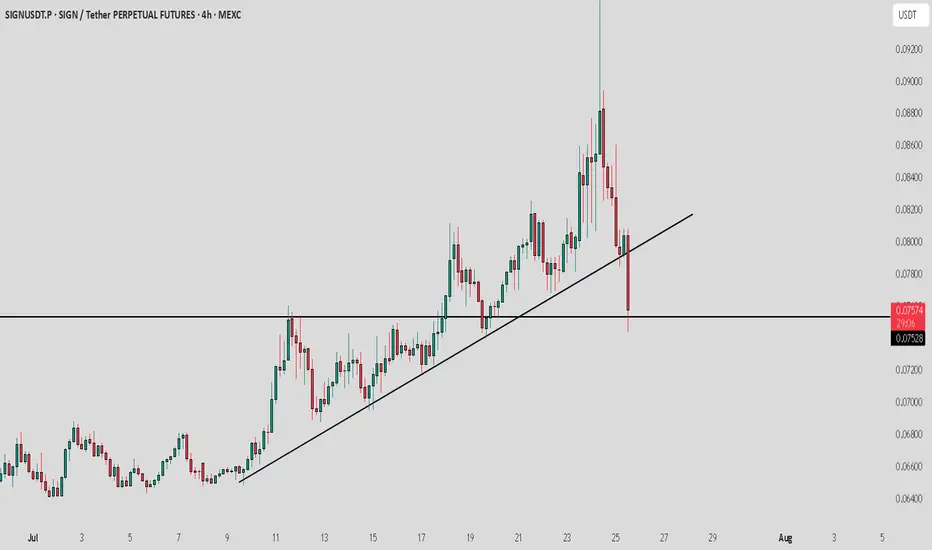
SIGN buy/long setup (4H)A tight consolidation range has been broken to the upside, and price has not yet pulled back to it.
On the chart, we have a trigger line breakout and the formation of a bullish change of character (CH).
When the price reaches the green zone, we can look for buy/long positions.
Targets are marked
Related pairs

Sign / USDT : Huge breakdown and currently sitting on supportSIGN/USDT Analysis:
SIGN is testing a crucial support level. The price has pulled back from its recent highs and is now sitting on a key Horizontal line. How the market reacts here will determine the next move.
Bullish Scenario:
Horizontal line Support: If the price holds above the Horizontal lin
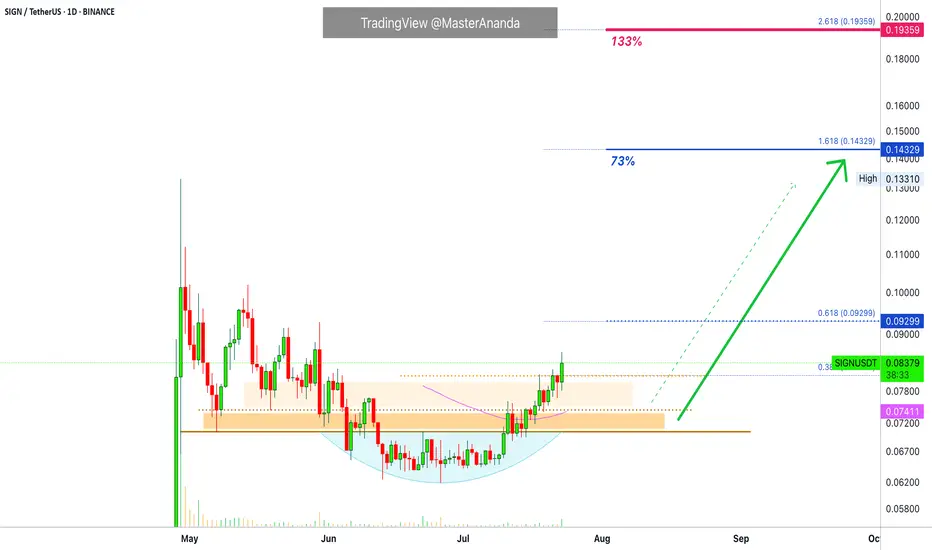
Sign · Same Chart, Same Pattern, Easy Profits · 133% PotentialThe same chart, the same dynamics and the same highly profitable easy to win trading opportunity.
The main low happens 7-May. There are lower prices after this but this is the stop-loss hunt event. We know this based on the rounded bottom pattern.
SIGNUSDT is back above its 7-May low and also trad
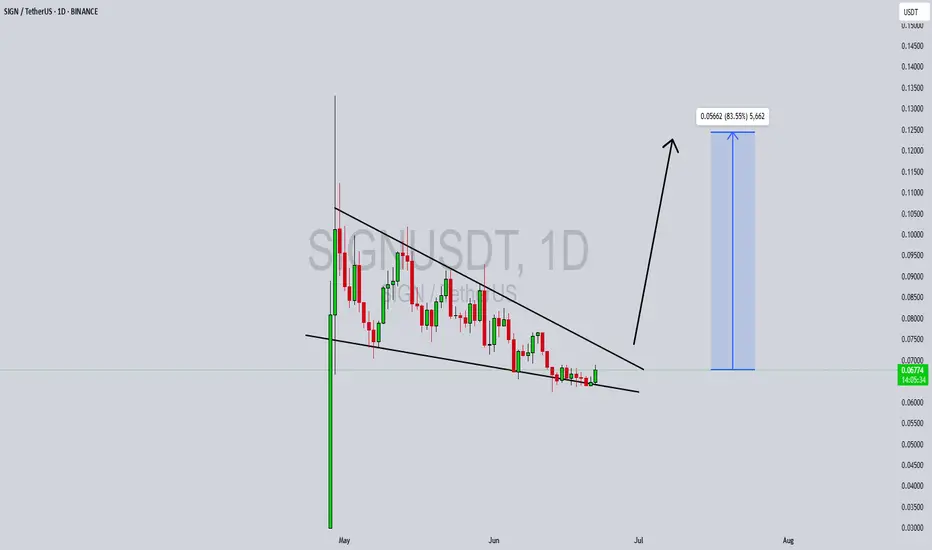
SIGNUSDT 12H#SIGN has formed a Falling Wedge pattern on the 12H chart — a bullish setup.
📍 Entry Idea: Consider buying a small bag near the support level of $0.06395.
If the price breaks out above the wedge resistance, the potential targets are:
🎯 $0.07142
🎯 $0.07604
🎯 $0.07978
🎯 $0.08351
🎯 $0.08883
🎯 $0.0956

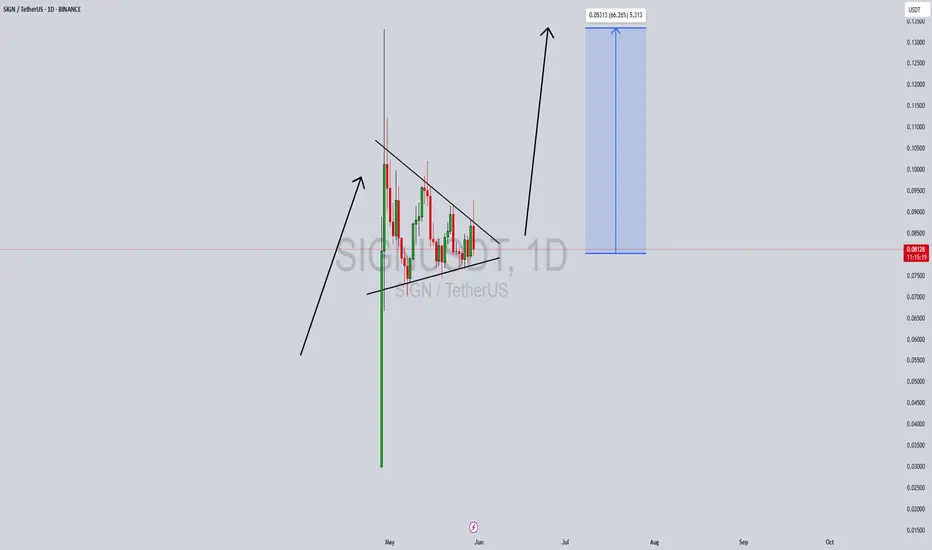
SIGNUSDT Forming Falling Wedge SIGNUSDT is currently forming a textbook Falling Wedge Pattern, a bullish chart formation that often signals the end of a downtrend and the start of a breakout rally. This pattern is becoming increasingly visible on the daily chart, with price action narrowing and volatility decreasing—setting the s
SIGNUSDT Forming Bullish Pennant SIGNUSDT is currently exhibiting a strong bullish pennant pattern on the daily timeframe—a continuation setup that often precedes substantial upward movement. Following an aggressive price surge, the pair has entered a brief consolidation phase within converging trendlines, suggesting that bulls are
$SIGN - Long Trade IdeaBINANCE:SIGNUSDT | 4H
Entry: .085 to .084
DCA level/conservative entry: .082 to .080
Stoploss: just below .077
TPs:
.088 to .094
.102 to .106

SIGN/USDT – Bullish Breakout Alert!🚀 SIGN Breakout Alert – 80% Potential Incoming?! 👀🔥
Hey Traders! If you're all about high-conviction plays and real alpha, smash that 👍 and tap Follow for more setups that actually deliver! 💹💯
SIGN has just broken out from a symmetrical triangle after consolidating tightly for weeks. The breakout

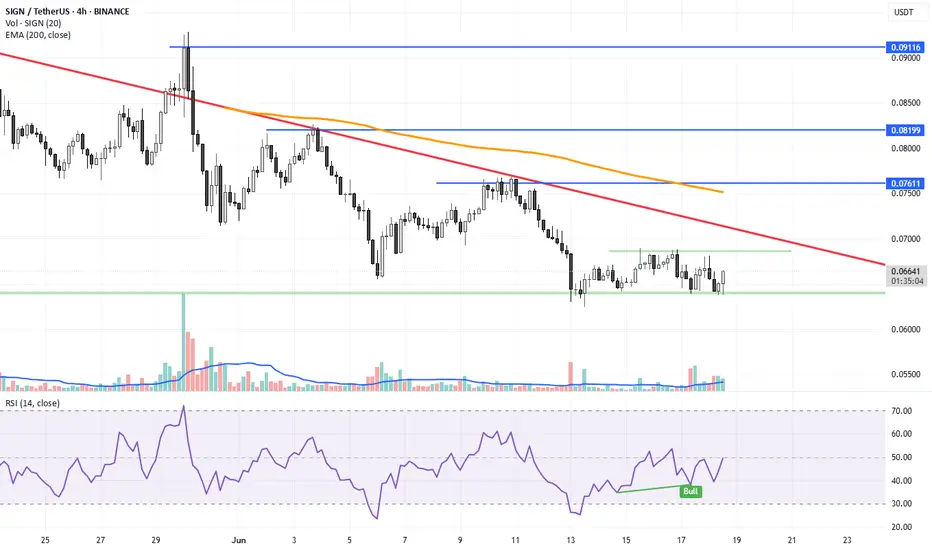
SIGNUSDT could make another pumpSIGN exits consolidation (price breaks resistance of corrective descending channel)
The coin is consolidating above the line and testing resistance at 0.09. There is a rally ahead....
Overall, the young coin has a good chance. The price has completed the dump phase after the dump and is again prepa

See all ideas
Summarizing what the indicators are suggesting.
Oscillators
Neutral
SellBuy
Strong sellStrong buy
Strong sellSellNeutralBuyStrong buy
Oscillators
Neutral
SellBuy
Strong sellStrong buy
Strong sellSellNeutralBuyStrong buy
Summary
Neutral
SellBuy
Strong sellStrong buy
Strong sellSellNeutralBuyStrong buy
Summary
Neutral
SellBuy
Strong sellStrong buy
Strong sellSellNeutralBuyStrong buy
Summary
Neutral
SellBuy
Strong sellStrong buy
Strong sellSellNeutralBuyStrong buy
Moving Averages
Neutral
SellBuy
Strong sellStrong buy
Strong sellSellNeutralBuyStrong buy
Moving Averages
Neutral
SellBuy
Strong sellStrong buy
Strong sellSellNeutralBuyStrong buy
Frequently Asked Questions
The current price of Sign / USDT (SIGN) is 0.06911 USDT — it has risen 1.34% in the past 24 hours. Try placing this info into the context by checking out what coins are also gaining and losing at the moment and seeing SIGN price chart.
Sign / USDT price has risen by 2.81% over the last week, its month performance shows a −3.31% decrease, and as for the last year, Sign / USDT has increased by 4.98%. See more dynamics on SIGN price chart.
Keep track of coins' changes with our Crypto Coins Heatmap.
Keep track of coins' changes with our Crypto Coins Heatmap.
Sign / USDT (SIGN) reached its highest price on Apr 29, 2025 — it amounted to 0.13387 USDT. Find more insights on the SIGN price chart.
See the list of crypto gainers and choose what best fits your strategy.
See the list of crypto gainers and choose what best fits your strategy.
Sign / USDT (SIGN) reached the lowest price of 0.05827 USDT on Apr 28, 2025. View more Sign / USDT dynamics on the price chart.
See the list of crypto losers to find unexpected opportunities.
See the list of crypto losers to find unexpected opportunities.
The safest choice when buying SIGN is to go to a well-known crypto exchange. Some of the popular names are Binance, Coinbase, Kraken. But you'll have to find a reliable broker and create an account first. You can trade SIGN right from TradingView charts — just choose a broker and connect to your account.
Sign / USDT (SIGN) is just as reliable as any other crypto asset — this corner of the world market is highly volatile. Today, for instance, Sign / USDT is estimated as 5.40% volatile. The only thing it means is that you must prepare and examine all available information before making a decision. And if you're not sure about Sign / USDT, you can find more inspiration in our curated watchlists.
You can discuss Sign / USDT (SIGN) with other users in our public chats, Minds or in the comments to Ideas.