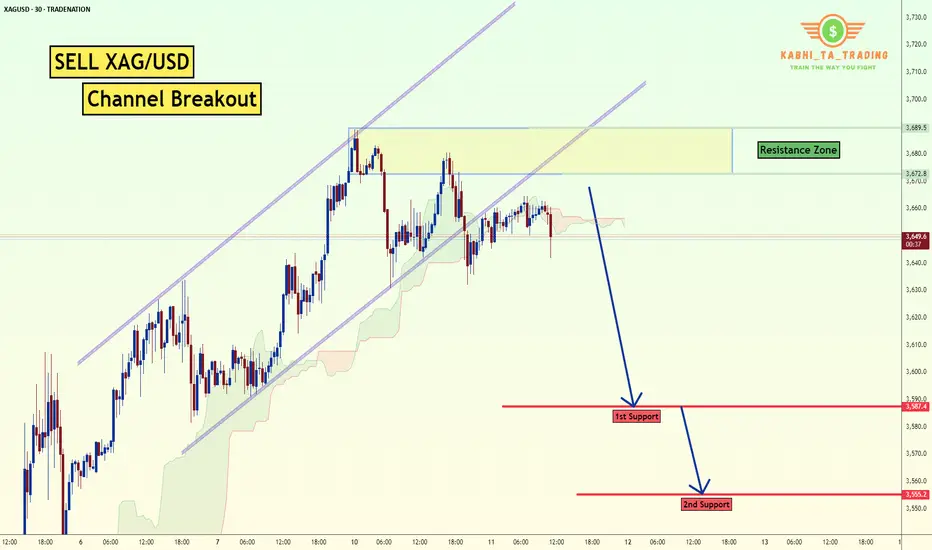
XAG/USD - Channel Breakout (11.06.2025) The XAG/USD Pair on the M30 timeframe presents a Potential Selling Opportunity due to a recent Formation of a CHannel Breakout Pattern. This suggests a shift in momentum towards the downside in the coming hours.
Possible Short Trade:
Entry: Consider Entering A Short Position around Trendline Of The Pattern.
Target Levels:
1st Support – 3587
2nd Support – 3555
🎁 Please hit the like button and
🎁 Leave a comment to support for My Post !
Your likes and comments are incredibly motivating and will encourage me to share more analysis with you.
Best Regards, KABHI_TA_TRADING
Thank you.
Disclosure: I am part of Trade Nation's Influencer program and receive a monthly fee for using their TradingView charts in my analysis.
SILVER trade ideas
SILVER (#XAGUSD): Strong Bullish Move Ahead?!It appears we've seen a legitimate liquidity grab following a test of a crucial daily/intraday structure on 📈SILVER.
After a false breakout of the highlighted area, the price rebounded and broke through a significant downward trend line and a minor horizontal resistance on the 4H chart.
I believe the market could stay bullish and potentially reach at least the 36.88 level again.

Silver surge has more bullish upsideSilver is breaking out. Its strength is no accident. The US is running a structural deficit north of 6% of GDP in a full-employment economy. The bond market has absorbed the pain so far, but pressure is building. Investors are starting to look for insurance. Silver is one of the cleanest ways to play the dollar’s long-term debasement.
The metal is trading well above its 200-day moving average. The US$31.50-32.00 zone now acts as solid support. Any pullback into that range is likely to be short-lived.
Silver doesn’t move in straight lines. It runs, consolidates, then runs again, usually in 50–90 day cycles. The current setup fits that rhythm.
The gold-to-silver ratio is still near 100x. Historically, the average is closer to 60-70x. That gives silver more room to catch up. Traders can short gold and go long silver to play that mean reversion. Or simply buy silver outright and short the dollar. ETF inflows into silver have picked up, showing broader market interest.
The main risk? A sudden shift in Fed tone or falling inflation expectations. But that seems unlikely near term.
Silver isn’t just a trade. It’s a message. A hedge against fiscal irresponsibility and the cost of kicking the can too far.

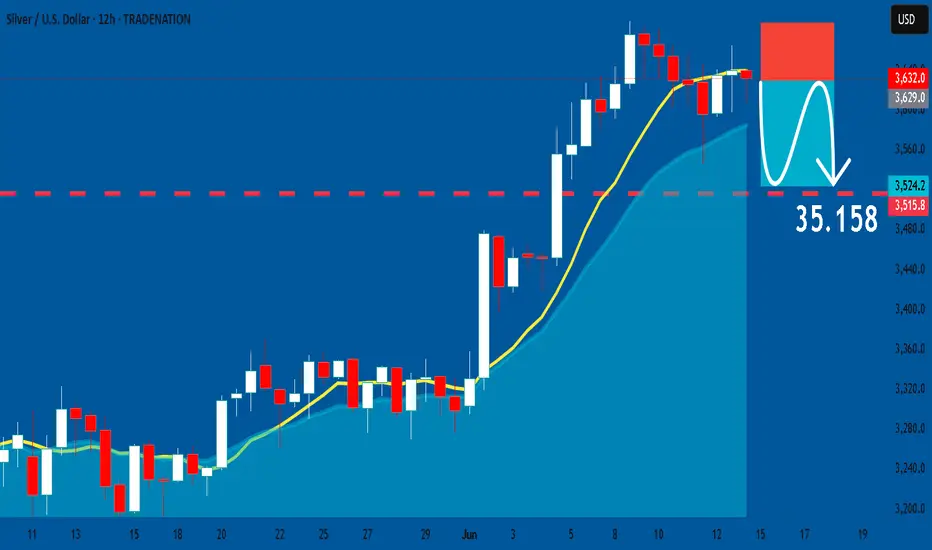
SILVER: Short Trade Explained
SILVER
- Classic bearish setup
- Our team expects bearish continuation
SUGGESTED TRADE:
Swing Trade
Short SILVER
Entry Point - 36.320
Stop Loss - 36.874
Take Profit - 35.158
Our Risk - 1%
Start protection of your profits from lower levels
Disclosure: I am part of Trade Nation's Influencer program and receive a monthly fee for using their TradingView charts in my analysis.
❤️ Please, support our work with like & comment! ❤️
SILVER Will Go Down! Short!
Take a look at our analysis for SILVER.
Time Frame: 9h
Current Trend: Bearish
Sentiment: Overbought (based on 7-period RSI)
Forecast: Bearish
The market is on a crucial zone of supply 3,622.4.
The oversold market condition in a combination with key structure gives us a relatively strong bullish signal with goal 3,483.8 level.
P.S
Please, note that an oversold/overbought condition can last for a long time, and therefore being oversold/overbought doesn't mean a price rally will come soon, or at all.
Disclosure: I am part of Trade Nation's Influencer program and receive a monthly fee for using their TradingView charts in my analysis.
Like and subscribe and comment my ideas if you enjoy them!

Silver Swing plan trade .???if price come to this level then you can plan trade by 15 min candlestick confirm like( Engulfing, evening star, etc) or buy after 5min Coch

SILVER (XAGUSD): One More Buying Opportunity📈SILVER is currently experiencing a strong bullish trend on the daily chart.
Since the end of last week, it has been consolidating within a horizontal range on a 4-hour time frame.
Today's bullish movement has successfully broken above the resistance of this range, confirming buyer strength and suggesting a likely continuation of the upward trend.
The next target is 38.00.

Silver Update
All the idea about price action described on chart you can analyze over my analysis on SILVER . Silver is already on Impulsive Bullish moment from past few days.

Silver expectation 1HWell, this could be tricky, as i would like to see silver consolidate for a short time, then break through that top trend line. Or, it could come down for a second touch of support, then bounce off it and bull its way to the top. Me personally, i think it might do a bullish move, buts lets wait and see. #BuyTheBull

SILVER BEARISH BIAS RIGHT NOW| SHORT
SILVER SIGNAL
Trade Direction: short
Entry Level: 3,714.4
Target Level: 3,384.5
Stop Loss: 3,933.3
RISK PROFILE
Risk level: medium
Suggested risk: 1%
Timeframe: 1D
Disclosure: I am part of Trade Nation's Influencer program and receive a monthly fee for using their TradingView charts in my analysis.
✅LIKE AND COMMENT MY IDEAS✅

Silver Setup: Ready for the Next Leg HigherSilver is consolidating, and I expect an upward breakout.
At the very least, I believe the price will reach the $37.35 level — and there’s a strong chance we’ll go even higher, potentially up to $44 per ounce.
Long from current levels.
Stop-loss at $35.10.

SILVER Buyers In Panic! SELL!
My dear friends,
My technical analysis for SILVER is below:
The market is trading on 36.320 pivot level.
Bias - Bearish
Technical Indicators: Both Super Trend & Pivot HL indicate a highly probable Bearish continuation.
Target - 35.168
Recommended Stop Loss - 36.830
About Used Indicators:
A pivot point is a technical analysis indicator, or calculations, used to determine the overall trend of the market over different time frames.
Disclosure: I am part of Trade Nation's Influencer program and receive a monthly fee for using their TradingView charts in my analysis.
———————————
WISH YOU ALL LUCK

SILVERThe price of silver is trading around $36.308 per ounce (approximately $1,203 per kilogram), showing modest gains with a slight intraday rise into a new high of 36.770
Year-to-Date Performance: Silver has gained over 14% in 2025 and about 23.6% since the start of the year in kilogram terms, reflecting strong industrial demand and safe-haven buying.
Industrial Demand: Growth in renewable energy sectors, especially solar power and electric vehicles, continues to drive robust demand for silver, which is a key component in photovoltaic cells and electronics.
Geopolitical and Market Factors: Recent geopolitical tensions, such as the Iran-Israel conflict, have supported silver as a safe-haven asset alongside gold, contributing to price strength.
Volatility: While silver has seen strong gains, short-term fluctuations remain, influenced by dollar strength, interest rate expectations, and profit-taking by investors.
silver as undervalued relative to its industrial demand and inflation hedge qualities,so expect continued upward pressure over the medium term .Supply-side risks, including mining disruptions and environmental regulations, may tighten availability and support prices.
Investors should be mindful of potential short-term pullbacks amid profit-taking or shifts in macroeconomic sentiment.
Key Drivers for price rally ,Industrial demand, safe haven, geopolitical tensions Solar energy, EVs, Iran-Israel conflict
In summary: Silver prices are currently strong, supported by industrial demand, geopolitical uncertainty, and safe-haven buying. While short-term volatility persists, the medium-term outlook remains bullish due to supply constraints and growing demand from renewable energy and technology sectors.
#silver#gold

SILVER: The Market Is Looking Up! Long!
My dear friends,
Today we will analyse SILVER together☺️
The price is near a wide key level
and the pair is approaching a significant decision level of 36.903 Therefore, a strong bullish reaction here could determine the next move up.We will watch for a confirmation candle, and then target the next key level of 37.240 .Recommend Stop-loss is beyond the current level.
❤️Sending you lots of Love and Hugs❤️

Silver's march towards $40 resumes...this rising support line needs to hold for higher up targets to be reached
Could be at $40 before August

Silver's Next Supercycle: $200+ by 2031?Silver has twice hit the $50 mark — once in 1980 and again in 2011. Today, it trades around $35, but the technical landscape is shifting fast.
At Vital Direction, our long-term Elliott Wave and Gann analysis signals a major breakout cycle already underway.
🌀 Wave structure suggests a multi-year impulsive rally
📐 Gann angles align with historic turning points
💥 Target: $200+ by 2031 (conservative)
⚙️ Backed by growing industrial demand, inflation risks, and monetary instability
This isn’t just a metal — it’s a macro opportunity.

SILVER- LONG( positional and investments)TVC:SILVER 25 years of consolidation with cup handle formation on quarterly chart setup will predict that next 5 to 10 years may be good upward movements for silver.

Sliver OTW to $40, $50 & blue skySliver OTW to $40, $50 & blue sky. Consolidation breakout imminent. You'll never see sub $40 in your lifetime ever gain.
Silver is nearing a critical rangeThe main move is done! It's time to rest now and don't expect any big moves on the chart. We are approaching a very important area that I think the price doesn't have enough strength to break through.

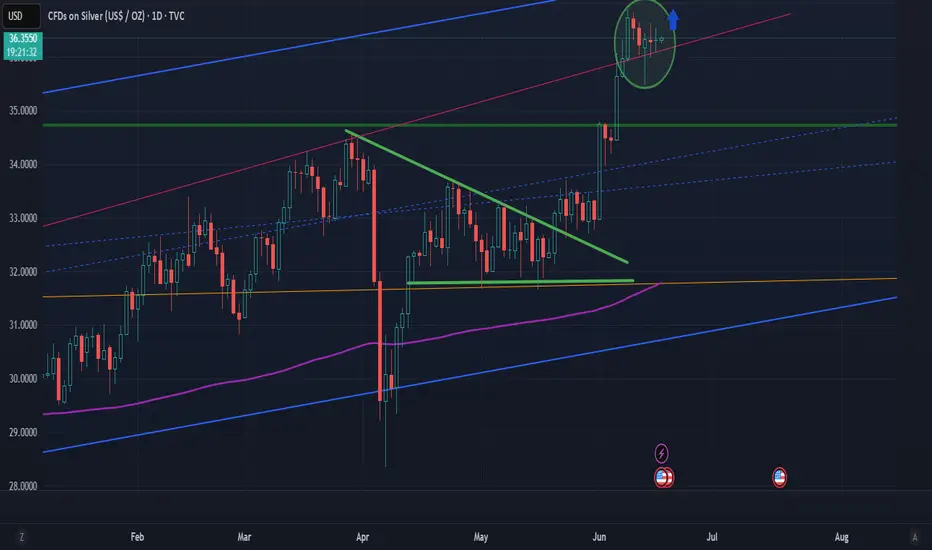
Silver Tests Key Long-Term ResistanceSilver is testing the 34.85 level, a critical resistance both in the short and long term. Since 2013, a cup and handle formation has developed just beneath this level. A confirmed breakout could signal sustained long-term bullish momentum.
Supporting this outlook, the gold/silver ratio has recently shown a decisive tilt in gold's favor, reaching historically extreme levels. This test of 34.85 might be the catalyst silver bulls have been waiting for and a return to normal signal for gold/silver ratio with pair trade oppurtunity.
However, caution is warranted. Silver is known for sharp intraday and weekly reversals. Confirming the breakout or false breakout could become tricky.

Oil Extends Rally as Israel-Iran Conflict Stokes Supply FearsBrent jumps 5.5 %, bullion hits fresh records, but analysts still see $65 crude by Q4 if key shipping lanes stay open
The crude-oil market loves nothing more than a geopolitical headline, and the one that flashed across terminals this past weekend was a whopper: escalating hostilities between Israel and Iran. Within minutes of the first wire stories, Brent crude vaulted 5.5 % to an intraday high of $76.02 a barrel—its largest single-session pop since Russia invaded Ukraine in early 2022—before giving back part of the gain to settle just under $76. West Texas Intermediate (WTI) traced a similar arc, peaking at $74.11 and closing fractionally lower.
At the same time, investors stampeded into traditional havens. COMEX gold pierced $2,450 an ounce for the first time, while silver sprinted above $33—blowing past the decade-old high set during the meme-metal frenzy of 2021. The twin moves in energy and precious metals underscore how fragile risk sentiment has become even as global demand growth, OPEC discipline, and U.S. shale resilience point to a more balanced physical market later this year.
Below we dissect the drivers of crude’s latest surge, explore the scenarios that could push prices back toward—or away from—the $65 handle by the fourth quarter, and explain why bullion refuses to loosen its grip on record territory.
________________________________________
1. What Sparked the Spike?
1. Tit-for-tat escalation. Reports of Israel striking Iran-linked assets in Syria and Iran responding with drone attacks near the Golan Heights raised fears of a direct Israel-Iran confrontation—a worst-case scenario that could spill into the Strait of Hormuz and threaten 20 % of global seaborne oil.
2. Thin pre-holiday liquidity. Monday volume was 30 % below the 20-day average with several Asian markets closed, exaggerating price swings and triggering momentum-chasing algos.
3. Options market gamma squeeze. Dealers short upside calls scrambled to hedge as spot pierced $75, accelerating the melt-up. Open interest in $80 Brent calls expiring in June ballooned to 45,000 contracts—four times the 3-month norm.
________________________________________
2. How Real Is the Supply Risk?
While the headlines are chilling, physical flows remain intact for now:
• Strait of Hormuz: No tankers have been impeded, insurance premia have widened only 25 ¢ per barrel—well below the $3 spike seen after the 2019 Abqaiq attack in Saudi Arabia.
• Iraqi-Turkish Pipeline: Still shuttered for unrelated legal reasons; volumes have been offline since March 2023 and are therefore “priced in.”
• Suez Canal / SUMED: Egyptian authorities report normal operations.
In short, the rally is risk premia, not actual barrels lost. That distinction matters because premia tend to deflate quickly once tension plateaus, as the market witnessed in October 2023 after Hamas’s initial assault on Israel.
________________________________________
3. Fundamentals Point to Softer Prices by Autumn
Four forces could push Brent back into the $65–68 corridor by Q4 2025 if the geopolitical situation stabilizes:
Force Current Status Q3–Q4 Outlook
OPEC+ Spare Capacity ~5.5 mbpd, most in Saudi/UAE
Ability to add 1–2 mbpd if prices spike
U.S. Shale Growth 13.3 mbpd, record high +0.6 mbpd y/y, breakeven $47–55
Refinery Maintenance Peak spring turnarounds remove 1.5 mbpd demand Units restart by July, easing crude tightness
Global Demand +1.2 mbpd y/y (IEA) Slows to +0.8 mbpd on OECD weakness
Add seasonal gasoline demand ebbing after August, and the supply-demand balance tilts looser just as futures curves roll into Q1 2026 deliveries—a period typically beset by refinery slowdowns and holiday travel lulls.
________________________________________
4. Scenario Analysis: Three Paths for Brent
1. Escalation (20 % probability)
• Direct Israeli strike on Iranian territory → Tehran targets Hormuz traffic
• 3 mbpd disrupted for one month
• Brent overshoots to $100+, backwardation widens above $10
• Biden releases 90 mb from the SPR; OPEC signals emergency meeting
2. Containment (60 % probability)
• Hostilities remain proxy-based in Syria/Lebanon; shipping unscathed
• Risk premium bleeds off; Brent drifts to $70–72 by July
• By Q4 oversupply emerges; prices test $65
3. Detente (20 % probability)
• U.S.-mediated cease-fire; hostages exchanged
• Iran de-escalates to focus on reviving JCPOA talks
• Risk premium collapses; Brent revisits mid-$60s by August and low-$60s into winter
________________________________________
5. Why Gold and Silver Are On Fire
The precious-metals rally is less about oil and more about real yields and central-bank buying:
• Real 10-year U.S. yield sits at 1.05 %, down from 1.55 % in February, boosting gold’s carry cost competitiveness.
• PBoC & EM central banks added a net 23 tonnes in April—the 17th straight month of net purchases.
• ETF inflows turned positive for the first time in nine months, adding 14 tonnes last week.
Silver benefits from the same macro tailwinds plus industrial demand (solar panel capacity is growing 45 % y/y). A tight COMEX inventory cover ratio—registered stocks equal to just 1.4 months of offtake—amplifies price sensitivity.
________________________________________
6. Cross-Asset Implications
1. Equities: Energy stocks (XLE) outperformed the S&P 500 by 3 % intraday but could retrace if crude fizzles. Miners (GDX, SILJ) may enjoy more durable momentum given new-high psychology.
2. FX: Petro-currencies CAD and NOK rallied 0.4 % vs. USD; safe-haven CHF gained 0.3 %. JPY failed to catch a bid, reflecting carry-trade dominance.
3. Rates: U.S. 2-year yields slipped 6 bp as Fed cut odds edged up on stagflation fears, but the move lacked conviction.
________________________________________
7. What Could Invalidate the Bearish Q4 Call?
• OPEC+ Discipline Frays: If Saudi Arabia tires of single-handedly absorbing cuts and opens the taps, prices could undershoot $60—but Riyadh’s fiscal breakeven (~$82) makes this unlikely.
• U.S. Election Politics: A new White House may re-impose harsher sanctions on Iran or ease drilling restrictions, tilting balances either way.
• Extreme Weather: An intense Atlantic hurricane season could knock Gulf of Mexico output offline, squeezing physical supply just as refineries demand more feedstock.
________________________________________
8. Trading and Hedging Playbook
Asset Bias Vehicles Key Levels
Brent Crude Fade rallies toward $80; target $68 by Oct ICE futures, Jul $70 puts Resistance $78.80 / Support $71.30
WTI Similar to Brent NYMEX CL, calendar-spread (long Dec 24, short Dec 25) Resistance $75.20
Gold Buy dips if real yields fall below 0.9 % Futures, GLD ETF, 25-delta call spreads Support $2,390
Silver Momentum long until $35; tighten stops Futures, SLV ETF, 2-month $34 calls Resistance $36.20
Energy Equities Pair trade: long refiners vs. short E&Ps ETFs: CRAK vs. XOP Watch crack spreads
Risk managers should recall that correlation spikes under stress: a portfolio long gold and short crude looks diversified—until a Middle-East cease-fire nukes both legs.
________________________________________
9. Macro Backdrop: Demand Still Fragile
Even before the flare-up, oil demand forecasts were slipping:
• OECD: Eurozone PMIs languish below 50; German diesel demand –7 % y/y.
• China: Q2 refinery runs flatlining; teapot margins < $2/bbl.
• India: Bright spot with gasoline demand +9 %, but monsoon season will clip growth.
On the supply side, non-OPEC production is rising 1.8 mbpd this year, led by Brazil’s pre-salt, Guyana’s Stabroek block, and U.S. Permian efficiency gains. Unless Middle-East barrels exit the market, the call on OPEC crude will shrink from 28 mbpd in Q2 to 26.7 mbpd in Q4, forcing the cartel to decide between market share and price.
________________________________________
10. Historical Perspective: Geopolitical Risk Premiums Fade Fast
Event Initial Brent Jump Days to Round-Trip Barrels Lost?
2019 Abqaiq Attack +15 % 38 < 0.2 mbpd for 30 days
2020 U.S.–Iran (Soleimani) +5 % 10 None
2022 Russia-Ukraine +35 % Still elevated > 1 mbpd rerouted
Based on precedent, a 5–7 % surge without real supply disruption typically unwinds within six weeks.
________________________________________
11. Outlook Summary
• Base Case: Containment; Brent averages $70–72 through summer, melts to $65–68 Q4. Gold consolidates above $2,350; silver churns $30–34.
• Bull Case (Oil): Hormuz threatened; Brent $100+, gas prices soar, Fed forced to juggle inflation vs. growth.
• Bear Case (Oil): Cease-fire + soft demand; Brent breaks $60, OPEC+ grapples with fresh round of cuts.
•
________________________________________
12. Conclusion
The Israel-Iran flashpoint has injected a fresh geopolitical premium into oil and turbo-charged safe-haven metals, but history suggests emotion-driven rallies fade quickly when physical barrels keep flowing. Unless missiles land near Hormuz or an errant drone strikes a Saudi export terminal, the structural forces of rising non-OPEC supply and cooling demand should reassert themselves, dragging Brent back toward the mid-$60s by year-end.
For traders, that means respecting the tape today but planning for mean reversion tomorrow—selling gamma-rich call structures in crude, rolling stop-losses higher on bullion longs, and watching like hawks for any hint that shipping lanes are no longer merely a headline risk but a tangible bottleneck. Until that line is crossed, the smart money will treat each price spike not as the dawn of $100 crude, but as an opportunity to hedge, fade, and position for a calmer, cheaper barrel in the months ahead.
Silver expectation 1HSilver has been developing for a while now, and its funneling into a bullish flag. Its had the change to break out, but couldnt, also, it could have gone into a sell, but didnt. The main uptrend is still being supported, so the chance of a bullish movement is good. The US news later will help price move well...lets hope its for the buy.

Silver energy buildup, Bullish continuation pattern developing Key Support and Resistance Levels
Resistance Level 1: 3723
Resistance Level 2: 3787
Resistance Level 3: 3847
Support Level 1: 3507
Support Level 2: 3448
Support Level 3: 3386
This communication is for informational purposes only and should not be viewed as any form of recommendation as to a particular course of action or as investment advice. It is not intended as an offer or solicitation for the purchase or sale of any financial instrument or as an official confirmation of any transaction. Opinions, estimates and assumptions expressed herein are made as of the date of this communication and are subject to change without notice. This communication has been prepared based upon information, including market prices, data and other information, believed to be reliable; however, Trade Nation does not warrant its completeness or accuracy. All market prices and market data contained in or attached to this communication are indicative and subject to change without notice.
