SILVER US$ 1H CHART PATTERNSilver (XAG/USD) 1H timeframe, here’s a breakdown of the target levels indicated:
📈 Chart Analysis Highlights:
The chart shows a bullish ascending triangle pattern, which is typically a continuation pattern signaling upward movement.
The price has recently broken above resistance around the 36.36–36.40 area.
You’ve marked two target points:
---
🎯 Target Levels:
1. First Target Point:
Price Level: Approximately 37.40 USD
This is the first significant resistance level after breakout, potentially reachable if momentum continues.
2. Second Target Point (Extended Target):
Price Level: Approximately 37.80 USD
This would be a more ambitious target assuming strong bullish follow-through.
---
📌 Notes:
Ensure to monitor volume on breakout for confirmation.
Risk management is important — consider stop-loss near 36.10 or below the ascending trendline.
Watch for any false breakouts especially near Ichimoku cloud resistance zones.
Would you like help setting up entry/exit levels or risk-reward ratios?
SILVER trade ideas

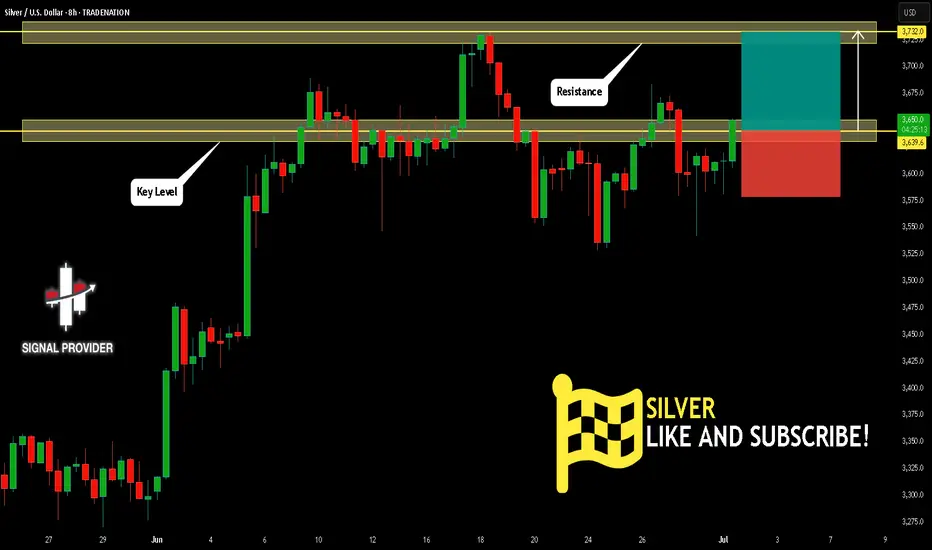
SILVER Will Move Higher! Long!
Please, check our technical outlook for SILVER.
Time Frame: 8h
Current Trend: Bullish
Sentiment: Oversold (based on 7-period RSI)
Forecast: Bullish
The price is testing a key support 3,639.6.
Current market trend & oversold RSI makes me think that buyers will push the price. I will anticipate a bullish movement at least to 3,732.0 level.
P.S
The term oversold refers to a condition where an asset has traded lower in price and has the potential for a price bounce.
Overbought refers to market scenarios where the instrument is traded considerably higher than its fair value. Overvaluation is caused by market sentiments when there is positive news.
Disclosure: I am part of Trade Nation's Influencer program and receive a monthly fee for using their TradingView charts in my analysis.
Like and subscribe and comment my ideas if you enjoy them!
XAGUSD H1 I Bearish Drop Based on the H1 chart analysis, we can see that the price is approaching our sell entry at 36.05, a pullback resistance
Our take profit will be at 34.77, a pullback support.
The stop loss will be placed at 37.00, a pullback resistance.
High Risk Investment Warning
Trading Forex/CFDs on margin carries a high level of risk and may not be suitable for all investors. Leverage can work against you.
Stratos Markets Limited (tradu.com ):
CFDs are complex instruments and come with a high risk of losing money rapidly due to leverage. 63% of retail investor accounts lose money when trading CFDs with this provider. You should consider whether you understand how CFDs work and whether you can afford to take the high risk of losing your money.
Stratos Europe Ltd (tradu.com ):
CFDs are complex instruments and come with a high risk of losing money rapidly due to leverage. 63% of retail investor accounts lose money when trading CFDs with this provider. You should consider whether you understand how CFDs work and whether you can afford to take the high risk of losing your money.
Stratos Global LLC (tradu.com ):
Losses can exceed deposits.
Please be advised that the information presented on TradingView is provided to Tradu (‘Company’, ‘we’) by a third-party provider (‘TFA Global Pte Ltd’). Please be reminded that you are solely responsible for the trading decisions on your account. There is a very high degree of risk involved in trading. Any information and/or content is intended entirely for research, educational and informational purposes only and does not constitute investment or consultation advice or investment strategy. The information is not tailored to the investment needs of any specific person and therefore does not involve a consideration of any of the investment objectives, financial situation or needs of any viewer that may receive it. Kindly also note that past performance is not a reliable indicator of future results. Actual results may differ materially from those anticipated in forward-looking or past performance statements. We assume no liability as to the accuracy or completeness of any of the information and/or content provided herein and the Company cannot be held responsible for any omission, mistake nor for any loss or damage including without limitation to any loss of profit which may arise from reliance on any information supplied by TFA Global Pte Ltd.
The speaker(s) is neither an employee, agent nor representative of Tradu and is therefore acting independently. The opinions given are their own, constitute general market commentary, and do not constitute the opinion or advice of Tradu or any form of personal or investment advice. Tradu neither endorses nor guarantees offerings of third-party speakers, nor is Tradu responsible for the content, veracity or opinions of third-party speakers, presenters or participants.

Bearish drop off pullback resistance?XAG/USD is rising towards the resistance level which is a pullback resistance and could drop from this level to our take proft.
Entry: 36.70
Why we like it:
There is a pullback resitance.
Stop loss: 37.24
Why we like it:
There is a pullback resistance level.
Take profit: 34.78
Why we like it:
There is a pullback support level that lines up with the 127.2% Fibonacci extension.
Enjoying your TradingView experience? Review us!
Please be advised that the information presented on TradingView is provided to Vantage (‘Vantage Global Limited’, ‘we’) by a third-party provider (‘Everest Fortune Group’). Please be reminded that you are solely responsible for the trading decisions on your account. There is a very high degree of risk involved in trading. Any information and/or content is intended entirely for research, educational and informational purposes only and does not constitute investment or consultation advice or investment strategy. The information is not tailored to the investment needs of any specific person and therefore does not involve a consideration of any of the investment objectives, financial situation or needs of any viewer that may receive it. Kindly also note that past performance is not a reliable indicator of future results. Actual results may differ materially from those anticipated in forward-looking or past performance statements. We assume no liability as to the accuracy or completeness of any of the information and/or content provided herein and the Company cannot be held responsible for any omission, mistake nor for any loss or damage including without limitation to any loss of profit which may arise from reliance on any information supplied by Everest Fortune Group.

Market next target 🔀 Disruption Analysis - Alternative Scenario
While the current chart suggests a bullish breakout from the support area around $35.85–$35.90 with an upward target above $36.20, a potential bearish disruption scenario could unfold under the following conditions:
⚠️ Bearish Disruption Possibility:
1. Weakening Buying Pressure:
Price has tested the support zone multiple times, showing signs of weakening bullish momentum.
Buyers may be exhausting near the $36.00 area without strong follow-through.
2. Break Below Support:
If price breaks and closes below $35.85 support zone on high volume, it could invalidate the bullish setup.
This would create a lower low, indicating a potential trend reversal to the downside.
3. Next Downside Targets:
Immediate support lies around $35.60.
Further downside could take price to $35.40 if bearish momentum strengthens.
4. Bearish Triggers:
Negative economic data (especially U.S.-related as indicated by the calendar icon).
Rising DXY or bond yields may pressure silver prices

Possible Movement of Silver: Watch the Golden Zone RetestSilver has broken above a two-top downtrend with a strong bullish impulse, marked by a long white candle. Currently, it appears to be forming a Head and Shoulders pattern. A break below the neckline and the supporting uptrend could lead price back to the golden zone—around the base of the breakout candle—before resuming its upward move toward the main target near $39.

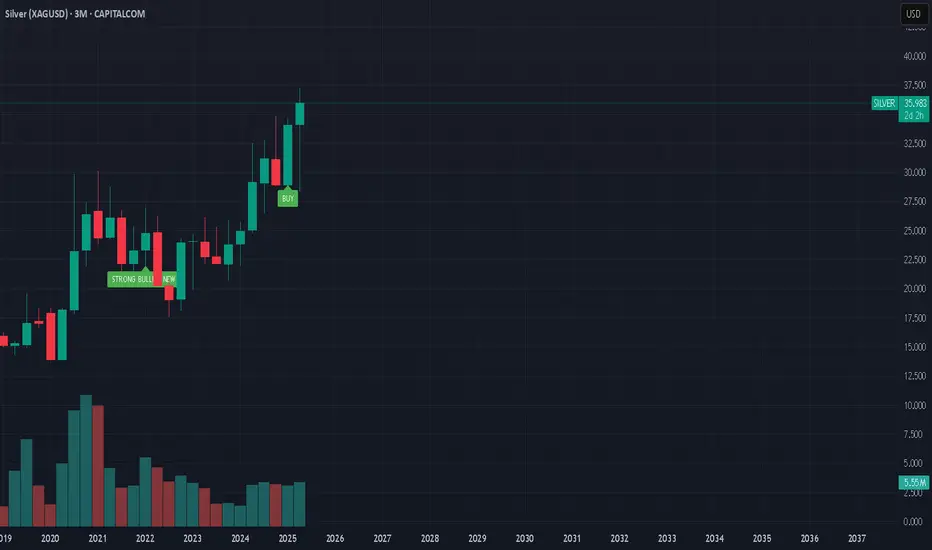
Silver Analysis – June 29, 2025Over the past two weeks, silver surged to the $37 level, forming a new high.
Given the speed of this move from the $33 area, this nearly 20% rally appears a bit too sharp in a short time frame.
💡 As a result, profit-taking around $37 is likely, making it harder for silver to break above this level in the near term.
We expect a period of consolidation or a minor pullback, potentially dragging the price back toward the $33 zone — where buy orders may start getting triggered.
📌 The $33 area could offer a more attractive buying opportunity.
Whether silver can retest the previous highs will largely depend on the strength and volume of demand at that level.

Silver sideways consolidation support at 3500Silver – Technical Analysis
The Silver price action continues to exhibit a bullish sentiment, underpinned by a prevailing rising trend. However, recent intraday moves indicate a corrective pullback, reflecting short-term consolidation within the broader uptrend.
Key Technical Levels:
Support:
3,500 – Primary support and previous consolidation zone; critical for maintaining bullish structure.
3,450 – Secondary support; potential downside target if 3,500 fails.
3,390 – Key lower support; aligns with a broader demand area.
Resistance:
3,720 – Immediate upside resistance; first target on a bullish bounce.
3,790 – Intermediate resistance; aligns with recent swing highs.
3,850 – Long-term resistance target; marks the upper boundary of the current bullish channel.
Scenario Analysis:
Bullish Continuation (Base Case):
A bounce from the 3,500 level would affirm the corrective pullback as temporary, with potential for a bullish continuation targeting 3,720, followed by 3,790 and 3,850 over a longer timeframe.
Bearish Reversal (Alternative Scenario):
A daily close below 3,500 would undermine the current bullish outlook and signal a deeper retracement, with downside risk toward 3,450 and potentially 3,390, where structural support may stabilize price.
Conclusion:
Silver remains structurally bullish, with the current pullback offering a potential entry point within the trend. The 3,500 level is the key pivot—holding above it supports further upside continuation, while a breakdown below would raise the risk of a deeper correction. Traders should watch for price action confirmation at this level to validate the next directional move.
This communication is for informational purposes only and should not be viewed as any form of recommendation as to a particular course of action or as investment advice. It is not intended as an offer or solicitation for the purchase or sale of any financial instrument or as an official confirmation of any transaction. Opinions, estimates and assumptions expressed herein are made as of the date of this communication and are subject to change without notice. This communication has been prepared based upon information, including market prices, data and other information, believed to be reliable; however, Trade Nation does not warrant its completeness or accuracy. All market prices and market data contained in or attached to this communication are indicative and subject to change without notice.

SILVER BEARS ARE STRONG HERE|SHORT
SILVER SIGNAL
Trade Direction: short
Entry Level: 3,607.1
Target Level: 3,250.7
Stop Loss: 3,843.0
RISK PROFILE
Risk level: medium
Suggested risk: 1%
Timeframe: 1D
Disclosure: I am part of Trade Nation's Influencer program and receive a monthly fee for using their TradingView charts in my analysis.
✅LIKE AND COMMENT MY IDEAS✅

SILVER: Strong Growth Ahead! Long!
My dear friends,
Today we will analyse SILVER together☺️
The price is near a wide key level
and the pair is approaching a significant decision level of 36.170 Therefore, a strong bullish reaction here could determine the next move up.We will watch for a confirmation candle, and then target the next key level of 36.429.Recommend Stop-loss is beyond the current level.
❤️Sending you lots of Love and Hugs❤️

XAGUSD – Bullish Setup for a Move Toward 40 1. What happened recently
After the massive selloff in early April, Silver (XAGUSD) reversed aggressively — gaining nearly 10,000 pips and breaking into multi-decade highs near 38. That kind of move is not noise. It’s power.
The month of June brought consolidation, with price slowly correcting and stabilizing. But this doesn’t look like distribution — it looks like new accumulation.
2. The key question
Is Silver building a base for the next breakout, or has the rally run out of steam?
3. Why I expect another leg up
- 35.00 is now acting as a solid support — tested, respected
- The correction has been shallow, typical for a bull rectangle structure
- Momentum remains on the buyers’ side — no major breakdown signs
- If buyers step in strongly, the next target is clearly the 40.00 psychological level
- This is a textbook bullish continuation setup.
4. Trading plan
Swing traders should watch the 35.00–35.20 zone for buying opportunities.
The risk/reward is attractive — with a potential for +5000 pips on a move toward 40, while keeping stops under the base.
Buy the dips — not the breakouts.
5. Final thoughts 🚀
Silver is shining again. The trend is up, the structure supports further gains, and the chart is offering a clean setup. Until 35 fails, the bias remains bullish.
Disclosure: I am part of TradeNation's Influencer program and receive a monthly fee for using their TradingView charts in my analyses and educational articles.

silver head and shoulder pattern price breakout in first week of june then sideways entire month
during same time gold was selling off below $3430 resistance and fed was very hawkish on stagflation
if buyers stopped buying and seller come in then price can breakdown then neckline of pattern

Silver Maintains Uptrend Amid ConsolidationThe uptrend in silver remains intact. The price is consolidating after a strong rally, similar to the consolidation phase seen from mid-April to the end of May. As long as the $35.25 level holds, I consider it reasonable to trade from the long side. Silver has a strong potential to reach $43 and even $48.
I remain very bullish on the commodity market, particularly precious metals, where I believe powerful rallies are still ahead.
Entering a position at the current level implies a relatively wide stop loss — nearly 2.5%. At this point, one has to choose between accepting the wider stop or skipping the entry and waiting for a breakout above $36.85, with a tighter stop set around $36.35. However, silver is a highly volatile asset, and such a tight stop might get hit by a false move.
I'm buying — I like the current level. The risk is acceptable considering the accumulated profit.

XAGUSD Ready to go North Buyers are in
Catch every move to the upside
With proper risk management
Happy trading OANDA:XAGUSD

Possible BUY setup on SILVER in H1Possible LONG setup in H1 timeframe. XAGUSD in H1 timeframe seems to be in LONG trend breaking higher highs.
Possible BUY setup in XAGUSD targetting previous swing high 36.778
This is for educational purpose only. Not an investment or financial advise.

"SILVER (XAGUSD) July Breakdown = Trend Reversal SetupSilver’s explosive rally may be running out of steam — the July setup is screaming SELL.
📌 Using Vinnie’s Trading Cheat Code System, here’s the case:
✅ CC SELL confirmed near the 37.30 zone
✅ RSI Overbought printed — classic blow-off top conditions
✅ MACD rolling over + weakening momentum
✅ Price rejected cleanly from the top of trend channel
🎯 Bearish targets:
34.60 – first reaction zone / channel midpoint
32.80 – channel base and high-volume node
This is a prime setup for a mean reversion trade or trend reversal, depending on how July opens. Looking to build shorts into rallies.
🧠 Powered by:
Confirm Alerts
CC MACD Screener
RSI OB/OS Zones
Cheat Code Trend Indicator
Watch for continued weakness below 35.80 to confirm momentum shift.

"The Vault is Open!" - Time to Steal Silver Pips🔥 XAG/USD SILVER HEIST: Bearish Raid in Progress! (Short Setup) 🔥
🦹♂️ ATTENTION SILVER BANDITS!
To the Metals Mercenaries & Risk-Takers! 💰🔪
Using our 🔥Thief Trading Tactics🔥, we're executing a bearish raid on XAG/USD - this is not advice, just a strategic robbery plan for traders who play to win.
📉 THE SILVER VAULT BREAK-IN (SHORT ENTRY PLAN)
🎯 Loot Zone: 34.500 (or escape earlier if bulls fight back)
💣 High-Stakes Play: Perfect pullback to steal pips
👮♂️ Cop Trap: Where bulls get liquidated
🔪 ENTRY RULES:
"Vault Breach Confirmed!" - Strike at pullback to nearest swing high/low (15-30min TF)
Sell Limit Orders for optimal risk/reward
Aggressive? Enter at market but watch gold correlation
📌 SET ALERTS! Don't miss the rejection
🚨 STOP LOSS (Escape Plan):
Thief SL at 36.400 (Key swing level)
⚠️ Warning: "Ignore this SL? Enjoy donating to bulls."
🎯 TARGETS:
Main Take-Profit: 34.500
Scalpers: Ride the NY session momentum
🔍 WHY THIS HEIST WORKS
✅ Industrial demand slowing
✅ Dollar strength crushing metals
✅ ETF outflows accelerating
✅ Technical rejection at key level
🚨 RISK WARNING
Avoid FOMC/NFP periods (Silver loves volatility)
Trailing stops = your escape plan
💎 BOOST THIS HEIST!
👍 Smash Like to fund our next raid!
🔁 Share to build our thief army!
🤑 See you at 34.500, bandits!
⚖️ DISCLAIMER: Hypothetical scenario. Trade at your own risk.
#XAGUSD #SilverTrading #Commodities #ThiefTrading
💬 COMMENT: "Short already - or waiting for better entry?"* 👇🔥

Silver is in the Bearish trend after testing ResistanceHello Traders
In This Chart XAGUSD HOURLY Forex Forecast By FOREX PLANET
today XAGUSD analysis 👆
🟢This Chart includes_ (XAGUSD market update)
🟢What is The Next Opportunity on XAGUSD Market
🟢how to Enter to the Valid Entry With Assurance Profit
This CHART is For Trader's that Want to Improve Their Technical Analysis Skills and Their Trading By Understanding How To Analyze The Market Using Multiple Timeframes and Understanding The Bigger Picture on the Charts

SILVER Sellers In Panic! BUY!
My dear friends,
Please, find my technical outlook for SILVER below:
The price is coiling around a solid key level - 35.993
Bias -Bullish
Technical Indicators: Pivot Points Low anticipates a potential price reversal.
Super trend shows a clear buy, giving a perfect indicators' convergence.
Goal - 36.378
About Used Indicators:
The pivot point itself is simply the average of the high, low and closing prices from the previous trading day.
Disclosure: I am part of Trade Nation's Influencer program and receive a monthly fee for using their TradingView charts in my analysis.
———————————
WISH YOU ALL LUCK

XAGUSD - SILVERIf you ask me, the safest and best investment is silver—even better than gold. The minimum target is 51.7, but I’m sure it’ll shoot way past that easily.
ICT + AMD PO3 + STDV + QT

Is the Uptrend Over? Critical Break on the Silver 1-Hour ChartHey everyone,
After the upward trend structure on XAGUSD broke down, the support level was breached, followed by a pullback. Because of this, my target level is 35.286.💬
Also, keep a close eye on key economic data releases on the fundamental side, as they could significantly influence your strategy.
I meticulously prepare these analyses for you, and I sincerely appreciate your support through likes. Every like from you is my biggest motivation to continue sharing my analyses.
I’m truly grateful for each of you—love to all my followers💙💙💙

Silver’s "make-or-break" moment.Silver’s "make-or-break" moment.
Price is heading straight for that rising line...
If it holds, this could be the last lower-risk entry area before the rush toward $40.

Silver-The Next Gold?The precious metals market is abuzz with a compelling question: Is silver poised to become the next gold? As gold continues its record-breaking ascent, investors and analysts are turning their attention to silver, which has demonstrated remarkable performance and potential in 2025. Let’s dive into the factors driving silver’s price, expert forecasts, and what the future may hold for this dynamic metal.
Silver’s 2025 Surge: Outpacing Expectations
Silver prices have surged impressively in 2025, recently trading above $34 per ounce—a 14% year-to-date increase that outpaces many other commodities. This rally is not just a speculative spike; it’s underpinned by robust fundamentals, including:
Gold’s record run, which historically pulls silver prices higher due to their strong correlation
Persistent supply deficits, with 2025 marking the fifth consecutive year of market shortfall
Soaring industrial demand, especially from the green technology and electronics sectors
Renewed safe-haven buying amid ongoing geopolitical and economic uncertainties
#commodity #silver #gold #xau #metals #finance #market #trading #portfolio #analysis