XAG/USD elliot wave countFXOPEN:XAGUSD
📊 Silver – Elliott Wave Analysis (Overview)
🔹 Macro Structure:
We’ve already completed the larger Wave 3 and are now transitioning into Wave 4.
🔹 Corrective Structure – Wave 4:
The A wave of the correction is already completed.
The B wave has also been completed.
We are now in the process of building the C wave, which will complete Wave 4.
🔹 Internal Structure of Wave C:
From the end of Wave B, we’ve already formed a (1) and (2) (in brackets).
Within this move, another smaller (1) and (2) have now unfolded, and we are currently on the way to the (3) of C.
🔹 Market Context:
Target zones and entry zones are already marked on the chart.
These zones can still be adjusted, depending on how price action develops in the coming days.
SILVERCFD trade ideas

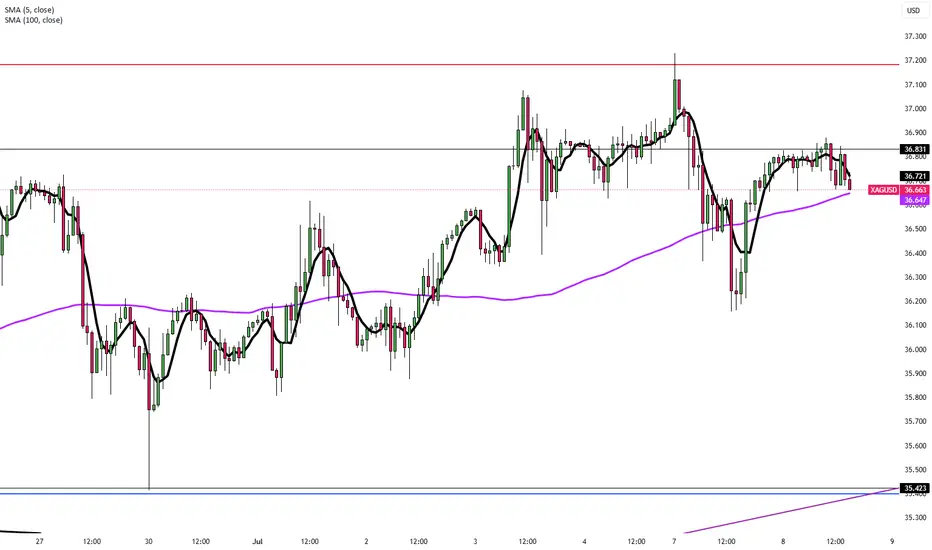
Silver Holds Near $36.80 on Tariff FearsSilver remains steady just below $37.00, hovering around $36.80 in Tuesday’s Asian session after a sharp rebound from the $36.15 level seen late Monday. The metal continues to trade in a tight range as conflicting market signals keep traders cautious.
Global trade tensions and geopolitical uncertainties, fueled by the U.S.’s upcoming tariffs on multiple countries and its hardline stance against BRICS-aligned nations, have elevated market risk perception. This has sparked a modest uptick in safe-haven demand, offering limited support to silver.
The strength of the U.S. Dollar and uncertainty surrounding future interest rate decisions are capping silver’s upside potential. Market participants remain focused on incoming economic data and central bank signals for clearer direction.
In the near term, silver is expected to stay volatile and highly reactive to geopolitical and economic headlines.
Resistance is at 37.50, while support holds at 35.40.
Final Stretch for SilverSilver OANDA:XAGUSD COMEX:SI1! AMEX:SLV continues to follow the plan
At this stage, price has either:
already completed wave ④ and is now entering wave ⑤,
or wave ④ is still in progress, currently in its final stages.
In either case, the wave structure suggests a final impulsive move upward into the $38–40 range — the climactic fifth wave of the sequence.
Volume Profile Analysis:
Price is currently trading between σ1 and σ2, with room to expand toward σ3 (~$40) if momentum continues.
The accumulation phase is behind us — we are now in the distribution zone.
Price action also supports the bullish outlook:
Last month closed with a strong bullish candle, showing no signs of reversal.
Keeping an eye on the move — the $38–40 zone remains the key target for the completion of this impulse.
#Silver #XAGUSD #ElliottWave #VolumeProfile #PriceAction #WaveAnalysis

SILVER (#XAGUSD): Correction is Over?! #SILVER (#XAGUSD): Correction is Over?! 🪙
It looks like 📈Silver has finally completed a consolidation within
a wide horizontal parallel channel on a daily.
A new higher high formation today indicates coming growth.
I suggest looking for trend-following buy from Monday.
Let the market close above the underlined resistance to let it set a Higher Close
as well.
Look for buying after a pullback, aiming at 38.0 as the first goal.
—————————
Daily time frame
—————————

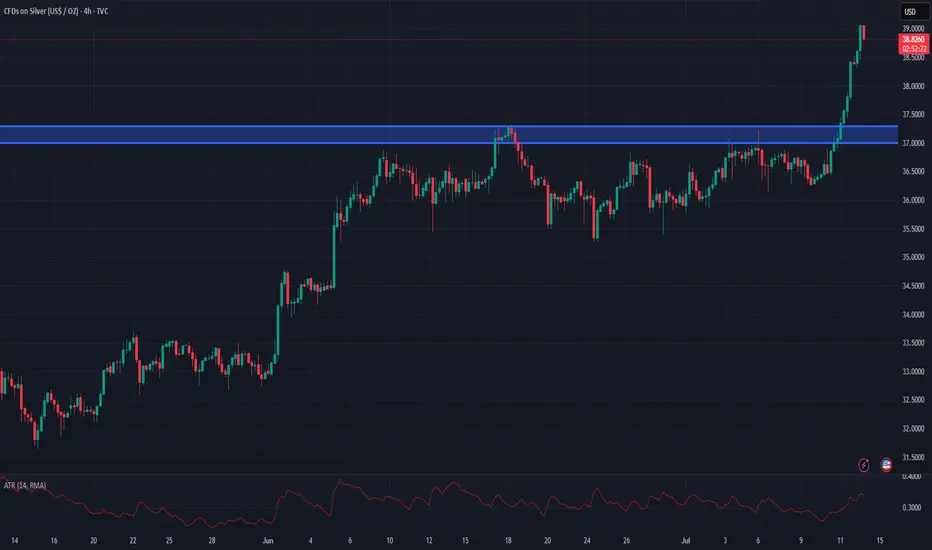
Silver breaks out to 14 year highsSilver has broken out again above the previous resistance zone at $37.00-$37.30 amid ongoing concerns surrounding tariffs
If we see corrective retests of this $37.00-$37.30 it can offer a good opportunity to get long and take advantage of Silvers bullish momentum.
Stops would need to be below $36.75 and targets can be set to around $40.00-$41.50
SILVER Support Ahead! Buy!
Hello,Traders!
SILVER is going down now
But the price is trading in a
Long-term uptrend so we are
Bullish biased and after the
Price retests of the horizontal
Support support below
Around 37.20$ we will be
Expecting a bullish rebound
Buy!
Comment and subscribe to help us grow!
Check out other forecasts below too!
Disclosure: I am part of Trade Nation's Influencer program and receive a monthly fee for using their TradingView charts in my analysis.

XAGUSDXAG/USD is currently exhibiting an increasingly bearish net position from major institutional players. Given this positioning, a continued bearish outlook is anticipated for the upcoming week.
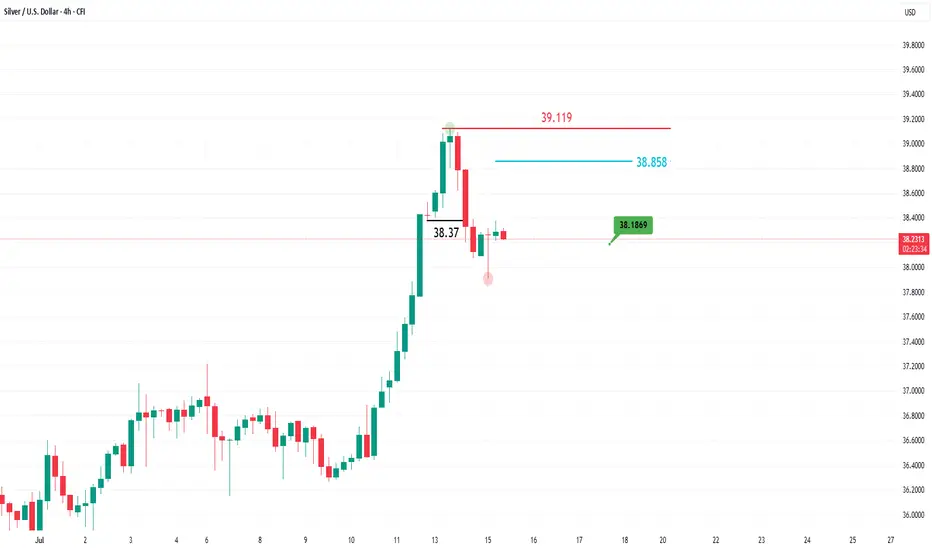
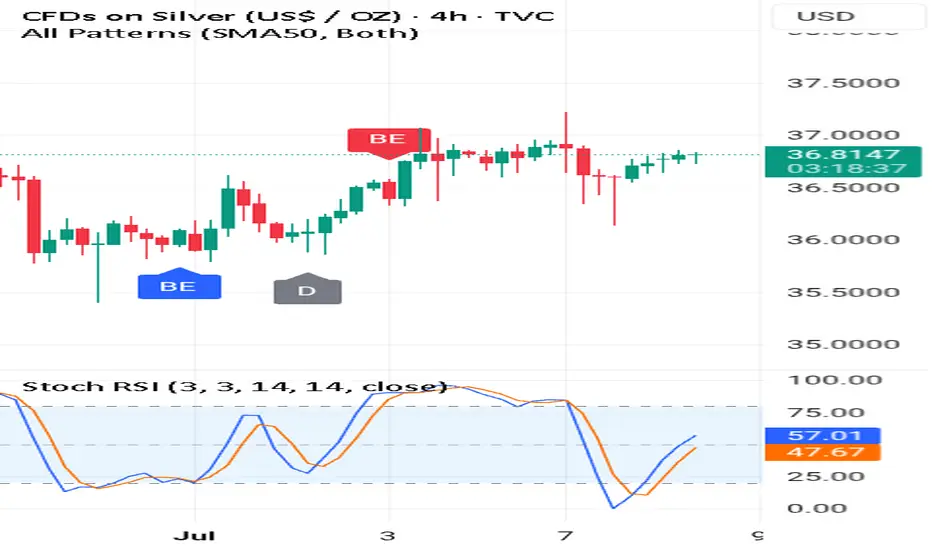
A temporary pause for silver!After its recent surge to reach the highest levels since September 2011, silver is showing short-to-medium-term negative signals on the 4-hour timeframe, before potentially resuming its upward trend on the daily chart.
As seen in the chart above, the price dropped quickly below the 38.37 level, forming a new low and shifting the 4-hour trend from bullish to bearish. The rebound to the 38.858 level appears to be a corrective move targeting the 38.1869 level.
The bearish scenario would be invalidated if the price rises again and forms a higher high on the 4-hour chart above the 39.119 level.
XAGUSD is BullishPrice was in a downtrend on 15 min time frame, however a matured bullish divergence hints that bulls are re-assuming control of price action. If previous lower high is broken with good volume then we can expect a bullish reversal as per Dow theory. Targets are mentioned on the chart.
XAG/USD Eyes Upside Targets as Wave C MaturesXAG/USD is currently trading in a corrective phase where wave B appears to have completed, and wave C is currently forming. Based on the current price action, it doesn’t seem likely that this entire move will result in a full bullish recovery. The structure suggests that this could be sub-wave C of wave 4, potentially completing around the 26.79944 level. Going forward, if the 5th wave begins to unfold, potential targets could be in the range of 29.74182 to 30.57528.

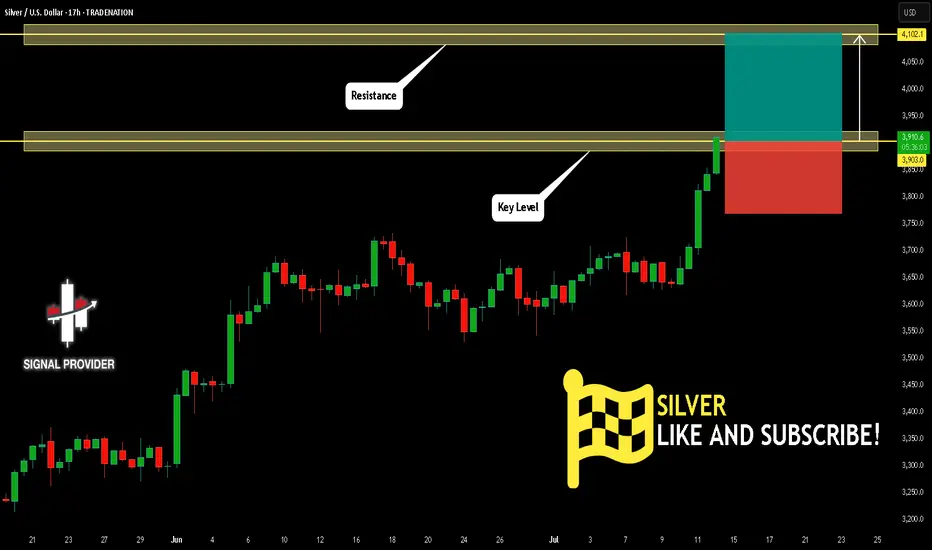
SILVER Will Go Up From Support! Buy!
Please, check our technical outlook for SILVER.
Time Frame: 17h
Current Trend: Bullish
Sentiment: Oversold (based on 7-period RSI)
Forecast: Bullish
The market is approaching a key horizontal level 3,903.0.
Considering the today's price action, probabilities will be high to see a movement to 4,102.1.
P.S
Overbought describes a period of time where there has been a significant and consistent upward move in price over a period of time without much pullback.
Disclosure: I am part of Trade Nation's Influencer program and receive a monthly fee for using their TradingView charts in my analysis.
Like and subscribe and comment my ideas if you enjoy them!
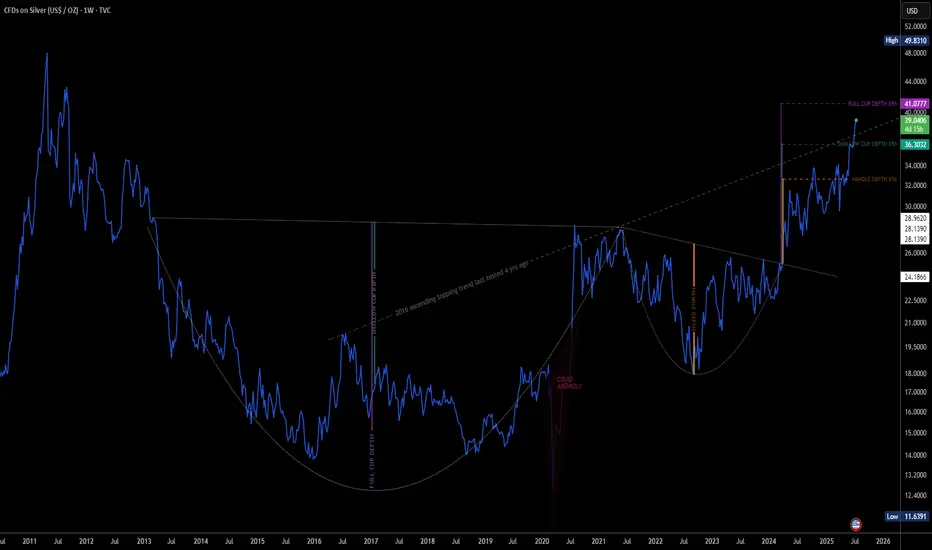
Silver to Make $41 before the leaves change colorVery old cup and handle .. but will dance on $41 before passing thru 50
Thinking Out Loud, Silver dipping before launchingLooking back on the chart, massive climbs were often preceded by abrupt dips.
Stay shark.

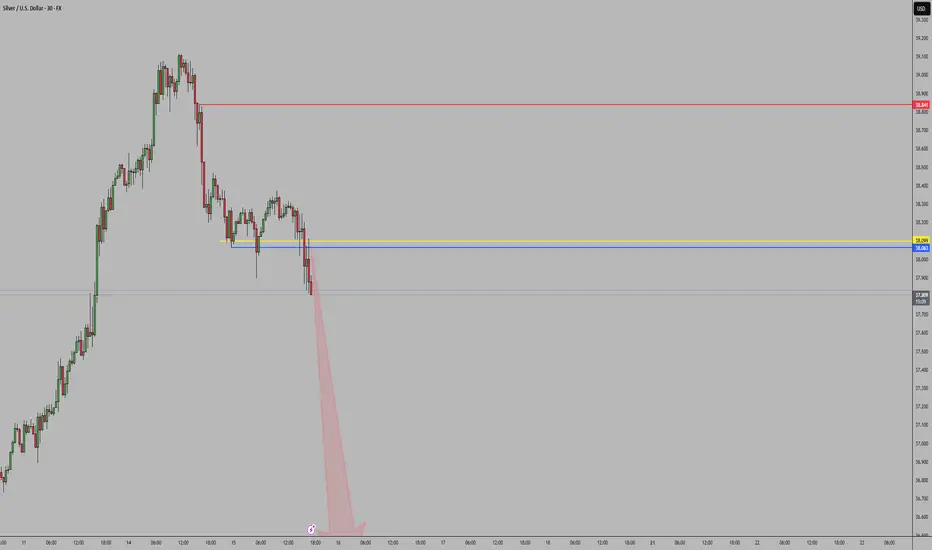
SILVER: Local Bearish Bias! Short!
My dear friends,
Today we will analyse SILVER together☺️
The price is near a wide key level
and the pair is approaching a significant decision level of 36.435 Therefore, a strong bearish reaction here could determine the next move down.We will watch for a confirmation candle, and then target the next key level of 36.336..Recommend Stop-loss is beyond the current level.
❤️Sending you lots of Love and Hugs❤️

“Can This XAG/USD Setup Make You the Next Market Thief?”🏴☠️ Operation Silver Swipe — Thief Trading Heist Plan for XAG/USD
🚨 Target Locked: The Silver Vault 🧳🎯
🌟Hi! Hola! Ola! Bonjour! Hallo! Marhaba!🌟
Dear Market Hustlers & Chart Whisperers, 🕵️♂️💼📉💰
Step into the shadows with our stealth plan based on our signature Thief Trading Style—a mix of smart technicals and crafty fundamentals. Today, we’re eyeing XAG/USD (Silver) for a clean sweep. Here's how to gear up for the breakout job:
🎯 Entry Zone — “The Heist Is On!” 💥
📍Key Level: Break & Retest above 37.000 – that's your cue to act.
🔑Strategy:
Buy Stop Orders: Set above the breakout level
Buy Limit Orders: Use recent 15/30M swings for a sneaky pullback entry 🎯
🛑 Stop Loss — “Every Thief Has a Backup Plan” 🎭
Place your SL like a pro, not a panic button!
📌Recommended: Around 35.660 using the 4H nearest candle wick swing low place after the breakout entry.
⚠️Tip: Adjust based on your risk appetite, lot size, and number of entries. You’re the mastermind, not a minion.
🎯 Target — “Escape Route” 🏃♂️💸
📌 First checkpoint: 38.800
📌 Or take your loot early if the heat rises! (Overbought zones, trend traps, or reversal zones)
💡 Scalper's Shortcut 💡
Go only long for safety. If you’ve got the cash stack, jump in fast. If you’re more of a sneaky swing trader, follow the roadmap and trail your SL to secure that bag 🧳📈
🔍 Market Status
Silver’s in a Neutral Phase – but signs point to an upward getaway 🚀
Fueling this momentum:
Macro & Fundamental trends
COT Positioning
Intermarket Clues
Sentimental Signals
🔗 Read the full breakdown check there 👉🔗🔗🌏🌎!
📢 Trading Alert — News Release Caution ⚠️
Don’t get caught mid-escape during news bombs! 💣
✅ Avoid fresh entries during high-impact events
✅ Use trailing SL to lock in your gains and cover your tracks
💖 Smash the Boost Button if you vibe with this plan 💥
Support the crew and help keep the charts hot and the loot flowing. Your boost powers up our next big heist 🚁🔥
📡 Stay tuned for more street-smart setups... we rob the charts, not the rules! 🐱👤💸📊💎

XAGUSD
Silver Outlook: Bullish with Potential Upside
Current Price: $30.24
Anticipated Targets: $33.00 - $36.00 - $39.00 - $40.00+++
Rationale:
Silver (XAG/USD) appears poised for significant upside potential in the coming months. Several technical indicators support this bullish view. The Relative Strength Index (RSI) has shown a strong uptrend, indicating increasing buying momentum. Additionally, the Moving Average Convergence Divergence (MACD) has crossed over into bullish territory, further affirming positive sentiment.
Risk Disclaimer:
Trading Forex and commodities involves substantial risk and may not be suitable for all investors. Past performance is not indicative of future results. It's important to carefully consider your financial situation and consult with a qualified financial advisor before making any investment decisions.
Conclusion:
Given the technical indicators and current market sentiment, I believe silver is positioned for a potential rally towards $33.00, $36.00, $39.00, and possibly beyond $40.00 in the coming months. Traders should monitor price action closely and manage risk appropriately.

Silver Rectangle Price Target $40Silver H & S continuation target met.
Trend has resumed in an up channel with a rectangle price target of 40.6.

A SUPER XAGUSD BUYYesterday XAGUSD reached its demand bottom, and now it is rising to the supply ceiling,
In the meantime I found an order block in the 1 min time frame, and immediately I placed a Buy order, and I will travel with it until the price reaches the supply ceiling with 1.2 win rate.

#1 Breaking News: Silver The Bullet Price Am listening to a podcast online this podcast mainly focusses on :
1-Gold
2-Silver
3-Mining Stocks
I always wondered what is it about these sectors that makes them "special"
Well I have recently mastered how to trade the double or triple tops.
And I can see why the experts in this commodity industry love double tops and triple tops.
Silver is hitting a top and has bounced from the neckline.
This is very important for you to understand.Also am using the 🚀 Rocket Booster strategy.
This strategy helps me pick the strength of the price trending.
It can also be used as a stop loss.This means you can use the moving averages for risk management.
Now I dont want you to worry too much about the technicals in this article but I just want us to have a conversation.
Sometimes technical analysis ca be boring but you will learn from conversations such as podcasts as well.
Rocket Boost This Content To Learn More.
Disclaimer ⚠️ Trading is risky please learn more about risk management and profit taking strategies and feel free to use a simulation trading account before you use real money.
SILVER Will Go Lower From Resistance! Short!
Here is our detailed technical review for SILVER.
Time Frame: 12h
Current Trend: Bearish
Sentiment: Overbought (based on 7-period RSI)
Forecast: Bearish
The market is approaching a significant resistance area 3,654.7.
Due to the fact that we see a positive bearish reaction from the underlined area, I strongly believe that sellers will manage to push the price all the way down to 3,536.0 level.
P.S
Please, note that an oversold/overbought condition can last for a long time, and therefore being oversold/overbought doesn't mean a price rally will come soon, or at all.
Disclosure: I am part of Trade Nation's Influencer program and receive a monthly fee for using their TradingView charts in my analysis.
Like and subscribe and comment my ideas if you enjoy them!

SILVER: Short Signal with Entry/SL/TP
SILVER
- Classic bearish setup
- Our team expects bearish continuation
SUGGESTED TRADE:
Swing Trade
Short SILVER
Entry Point - 36.935
Stop Loss - 37.204
Take Profit - 36.369
Our Risk - 1%
Start protection of your profits from lower levels
Disclosure: I am part of Trade Nation's Influencer program and receive a monthly fee for using their TradingView charts in my analysis.
❤️ Please, support our work with like & comment! ❤️

XAG/USD Daily AnalysisPrice is moving within a bullish channel, which is itself situated inside a bigger bullish structure.
The most recent price action appears to be a consolidation within the uptrend.
Price may possibly be setting up for another impulsive move towards the top of structure for a 3rd test.
If you agree with this analysis, look for a trade that meets your strategy rules.

Nasdaq, BTCUSD, ETHUSD, EURUSD & XAGUSD Daily Trade SetupsIn this update we review the recent price action in the Nasdaq, Bitcoin, Ethereum, Euro & Silver and identify the next high probability trade setups and price objectives to target. To review today's video analysis click here!
