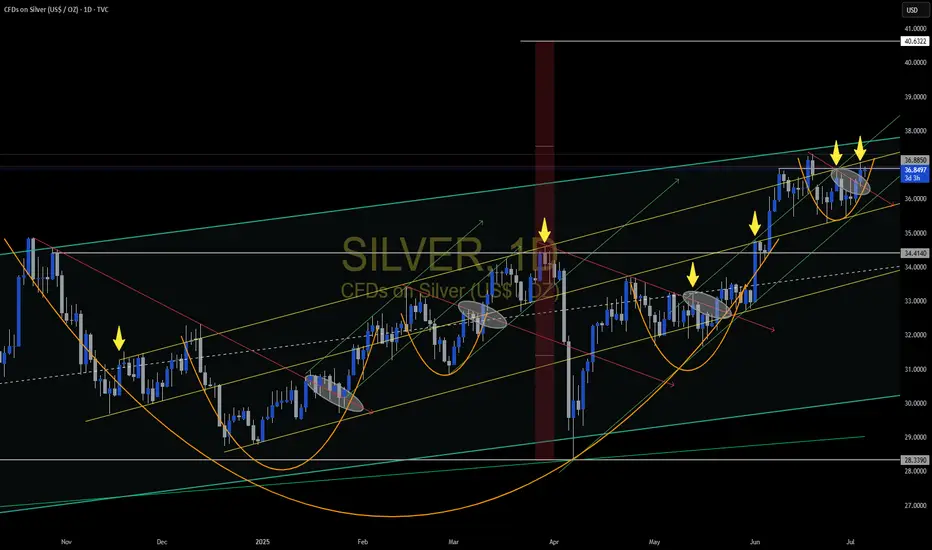
Silver (XAGUSD) Structural Analysis : Curve break & TargetSilver is exhibiting a textbook bullish continuation pattern, guided by a parabolic curve structure that reflects intensifying buyer momentum. This unique setup provides a high-probability trading roadmap as we approach a major reversal zone—one where smart money may look to offload long positions or enter fresh shorts.
This analysis aims to help traders anticipate the likely path of XAGUSD based on structure, liquidity behavior, and trend psychology.
🔍 Key Structural Observations:
1. Black Mind Curve Support (Dynamic Bullish Structure)
This parabolic arc acts as dynamic support. Every bounce from the curve shows growing strength in buyer conviction.
The price is riding the curve upward with higher lows, signaling accumulation with momentum.
This is not a standard trendline but rather a curve reflecting the accelerated nature of this uptrend.
2. Aggressive Bullish Momentum
The recent price behavior has shown strong impulsive candles to the upside followed by shallow corrections, confirming bullish dominance.
Volume and candle size increase near the curve, suggesting institutional interest.
3. Reversal Zone: 37.20 – 37.45
Marked as the Next Reversal Zone, this green box represents a key supply area where previous swing highs exist.
Historically, price struggled to break this region cleanly, making it a high-probability reaction zone.
Expect either:
a bearish rejection (short-term correction), or
a consolidation before a breakout continuation.
4. Liquidity Pool & Needed Volume Zone (~35.20 – 35.50)
The market often revisits zones of untapped liquidity. This area likely holds:
Buy-side stop losses
Unfilled institutional orders
If the market needs a deeper retracement, this is the zone to watch for re-accumulation.
🧠 Market Psychology Behind This Setup:
This structure suggests a classic case of smart money accumulation, with price moving upward in a controlled yet aggressive fashion. The parabolic nature of the move points to:
Increasing retail buy-ins
FOMO-driven entries
Possible engineered sweep before the next impulse
The reversal zone could become a profit-taking area for institutions. If large players want to continue higher, they may first induce a pullback to absorb more volume at lower prices (near the curve or liquidity zone).
🔧 Tactical Playbook for Traders:
For Bulls (Long Bias):
Watch for pullbacks toward the curve or liquidity zone.
Enter long positions on bullish confirmation (e.g., engulfing candles, pin bars) off those zones.
Targets: 37.20 – 37.45, possibly higher if broken with strength.
For Bears (Countertrend Traders):
Wait for clear rejection patterns in the reversal zone.
Use confirmation like RSI divergence, momentum slowdown, or distribution volume.
Target: Curve support or deeper liquidity zone for reentry.
📌 Key Technical Levels:
Zone Price Range Description
Reversal Zone 37.20 – 37.45 Resistance / Take-Profit Area
Curve Support Dynamic (rising) Support based on parabolic arc
Liquidity Pool 35.20 – 35.50 High-volume demand zone
🧭 Conclusion
Silver is currently in a momentum-driven phase supported by smart money activity. The parabolic structure and clean liquidity map give traders a clear plan to engage both long and short setups with timing and precision. Patience around the reversal zone will be key, as the next major move may depend on how price behaves in this critical area.
SILVERCFD trade ideas

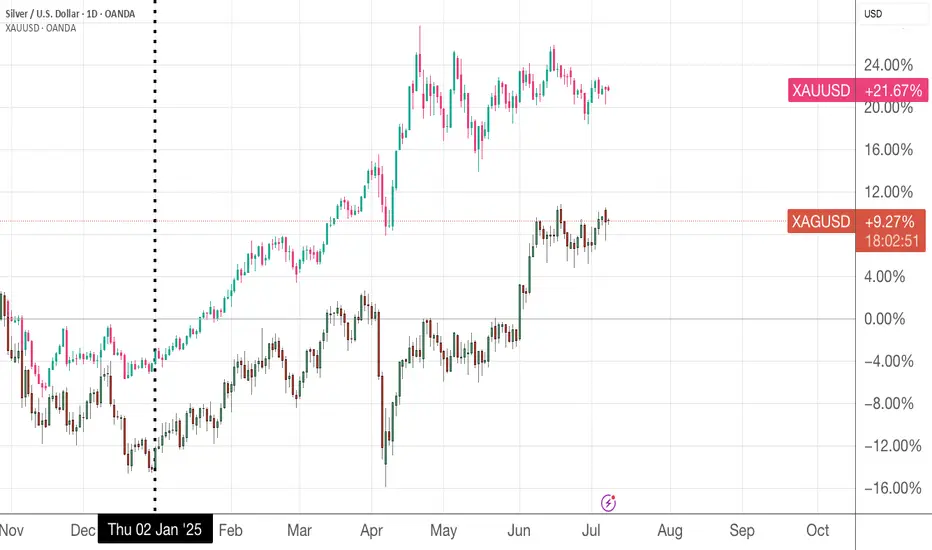
Silver is playing catch upI just nibble some silver on XAGUSD yesterday and believe it will closer the gap nearer with XAUUSD
Short term pullback is overFrom my last analysis on silver, we had a sell on silver, but it happened that the short term sell was liquidity the market used to buy dip.
Looking at the red rectangle we can see that silver has finished accumulating at that zone and is heading north ⬆️,so we are bullish going forward.
Target profit:38.00 , 39.00

Silver Wants a TrampolineThe bright green is what I foresee. A solid reversal after a decent correction. I see $36 as the next average level for Silver. If the markets turn more bullish I see $38-45 as a very real possibility.
DYOR.
Trade Slick.

Drop in Silver might not be complete, but it will be temporaryThere is a lot of volatility in the markets this week, so I'll be watching how things unfold to develop this idea more.
But to me it looks like for Silver $25 could be a current floor, and another rally could bring it back to $32 or higher. I expect a overall bullish transition into 2025.
DYOR
Trade Slick

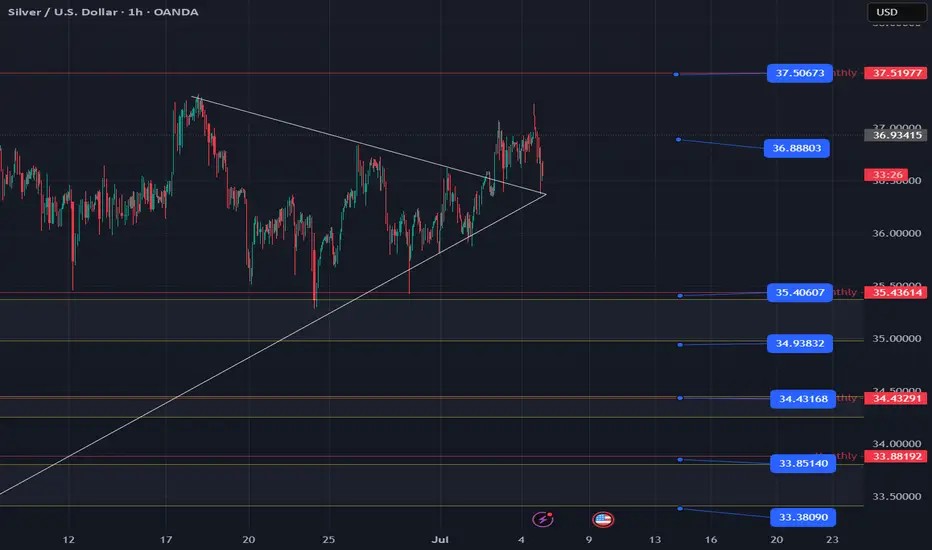
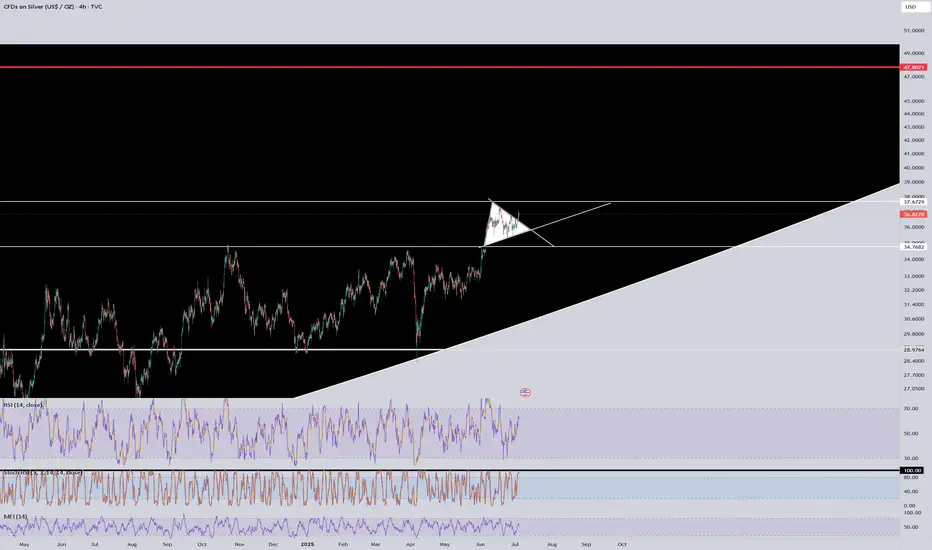
XAGUSD Strong accumulation waiting for a break-out. Silver (XAGUSD) has been trading within a 3-month Channel Up pattern and since the June 18 Higher High, it has entered a Descending Triangle.
This has previous been an Accumulation pattern, which after broken to the upside, it led to June's High. Similarly, we expect a bullish break-out once the 4H RSI breaks above its MA, and as long as the 4H MA200 (orange trend-line) holds, we expect a +15.50% minimum rise (like the first Bullish Leg of the Channel Up), with our Target se at 40.500.
-------------------------------------------------------------------------------
** Please LIKE 👍, FOLLOW ✅, SHARE 🙌 and COMMENT ✍ if you enjoy this idea! Also share your ideas and charts in the comments section below! This is best way to keep it relevant, support us, keep the content here free and allow the idea to reach as many people as possible. **
-------------------------------------------------------------------------------
💸💸💸💸💸💸
👇 👇 👇 👇 👇 👇

SILVER: Will Go Up! Long!
My dear friends,
Today we will analyse SILVER together☺️
The in-trend continuation seems likely as the current long-term trend appears to be strong, and price is holding above a key level of 36.696 So a bullish continuation seems plausible, targeting the next high. We should enter on confirmation, and place a stop-loss beyond the recent swing level.
❤️Sending you lots of Love and Hugs❤️

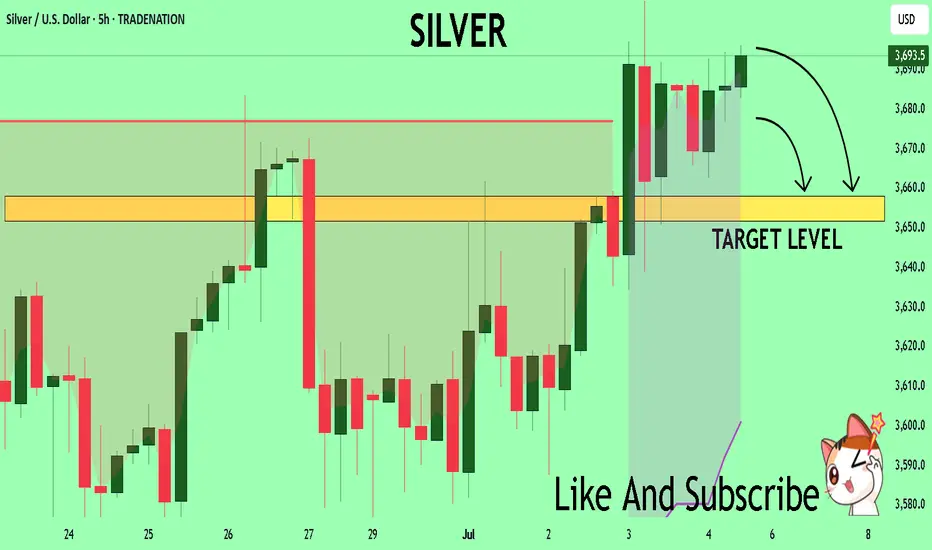
Silver sideways consolidation support at 3500The Silver price action continues to exhibit a bullish sentiment, underpinned by a prevailing rising trend. However, recent intraday moves indicate a corrective pullback, reflecting short-term consolidation within the broader uptrend.
Key Technical Levels:
Support:
3,500 – Primary support and previous consolidation zone; critical for maintaining bullish structure.
3,450 – Secondary support; potential downside target if 3,500 fails.
3,390 – Key lower support; aligns with a broader demand area.
Resistance:
3,720 – Immediate upside resistance; first target on a bullish bounce.
3,790 – Intermediate resistance; aligns with recent swing highs.
3,850 – Long-term resistance target; marks the upper boundary of the current bullish channel.
Scenario Analysis:
Bullish Continuation (Base Case):
A bounce from the 3,500 level would affirm the corrective pullback as temporary, with potential for a bullish continuation targeting 3,720, followed by 3,790 and 3,850 over a longer timeframe.
Bearish Reversal (Alternative Scenario):
A daily close below 3,500 would undermine the current bullish outlook and signal a deeper retracement, with downside risk toward 3,450 and potentially 3,390, where structural support may stabilize price.
Conclusion:
Silver remains structurally bullish, with the current pullback offering a potential entry point within the trend. The 3,500 level is the key pivot—holding above it supports further upside continuation, while a breakdown below would raise the risk of a deeper correction. Traders should watch for price action confirmation at this level to validate the next directional move.
This communication is for informational purposes only and should not be viewed as any form of recommendation as to a particular course of action or as investment advice. It is not intended as an offer or solicitation for the purchase or sale of any financial instrument or as an official confirmation of any transaction. Opinions, estimates and assumptions expressed herein are made as of the date of this communication and are subject to change without notice. This communication has been prepared based upon information, including market prices, data and other information, believed to be reliable; however, Trade Nation does not warrant its completeness or accuracy. All market prices and market data contained in or attached to this communication are indicative and subject to change without notice.

Cheap jewellery (Silver XAG/USD)Setup
Silver is sitting just under multi-decade highs having broken above $34 resistance last month. The long term cup and handle pattern is still in place.
Signal
The price has been consolidating in what could be a bull flag pattern between 35 and 37. A breakout could trigger the next leg of the uptrend, whereas a drop below the bottom of the flag would imply a retest of 34.

Long XAGUSDXAGUSD has been holding the breakout of this wedge as well as the 8MA and 21MA. I like longs here using a break/hold below the 21MA as a stop. I would target 37, 37.5 initially and if we can see a break/hold of 37.5 I would target 39, 40.
And silver's ride to $40 continues ...this rising support line needs to hold for higher up targets to be reached
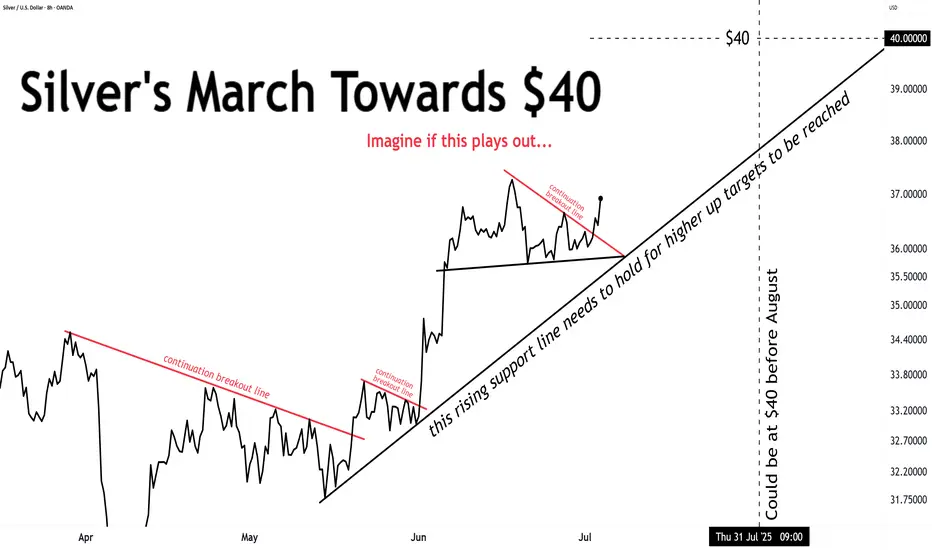
Resistance at $37.60. After that, look out above. This could be the next leg up to get to $40 and above. Some resistance around $37.60 to break first.
SILVERSilver lake and Palmer AK mag pouch and I can do the best you could get me some time and Palmer ma to Worcester county jail roster for a few minutes then we will head to bed early and I will head to bed now so we will be home tomorrow and Palmer AK pistol grip stock market open on

Silver Demand Present, $38 seems easy nowIn 2003, Silver was below $7. Today it's above $33. What will it be in 2050?
At today's price:
For many, it's a great price to sell.
For many, it's a great price to buy.
DYOR. Trade Slick. <3

“Can This XAG/USD Setup Make You the Next Market Thief?”🏴☠️ Operation Silver Swipe — Thief Trading Heist Plan for XAG/USD 🪙💸
🚨 Target Locked: The Silver Vault 🧳🎯
🌟Hi! Hola! Ola! Bonjour! Hallo! Marhaba!🌟
Dear Market Hustlers & Chart Whisperers, 🕵️♂️💼📉💰
Step into the shadows with our stealth plan based on our signature Thief Trading Style—a mix of smart technicals and crafty fundamentals. Today, we’re eyeing XAG/USD (Silver) for a clean sweep. Here's how to gear up for the breakout job:
🎯 Entry Zone — “The Heist Is On!” 💥
📍Key Level: Break & Retest above 36.500 – that's your cue to act.
🔑Strategy:
Buy Stop Orders: Set above the breakout level
Buy Limit Orders: Use recent 15/30M swings for a sneaky pullback entry 🎯
🛑 Stop Loss — “Every Thief Has a Backup Plan” 🎭
Place your SL like a pro, not a panic button!
📌Recommended: Around 31.700 using the 4H swing low
⚠️Tip: Adjust based on your risk appetite, lot size, and number of entries. You’re the mastermind, not a minion.
🎯 Target — “Escape Route” 🏃♂️💸
📌 First checkpoint: 37.700
📌 Or take your loot early if the heat rises! (Overbought zones, trend traps, or reversal zones)
💡 Scalper's Shortcut 💡
Go only long for safety. If you’ve got the cash stack, jump in fast. If you’re more of a sneaky swing trader, follow the roadmap and trail your SL to secure that bag 🧳📈
🔍 Market Status
Silver’s in a Neutral Phase – but signs point to an upward getaway 🚀
Fueling this momentum:
Macro & Fundamental trends
COT Positioning
Intermarket Clues
Sentimental Signals
🔗 Read the full breakdown check there 👉🔗🔗🌏🌎!
📢 Trading Alert — News Release Caution ⚠️
Don’t get caught mid-escape during news bombs! 💣
✅ Avoid fresh entries during high-impact events
✅ Use trailing SL to lock in your gains and cover your tracks
💖 Smash the Boost Button if you vibe with this plan 💥
Support the crew and help keep the charts hot and the loot flowing. Your boost powers up our next big heist 🚁🔥
📡 Stay tuned for more street-smart setups... we rob the charts, not the rules! 🐱👤💸📊💎

SLIVER Weekly patternJust another view from the weekly chart. To give confirmation of the daily bias

Silver approaching key resistance barrierLooking at MARKETSCOM:SILVER , we can see that the price action is approaching the highest point of June. If that gets cleared, the next target might be the highest point of 2012. Let's dig in.
TVC:SILVER
Let us know what you think in the comments below.
Thank you.
77.3% of retail investor accounts lose money when trading CFDs with this provider. You should consider whether you understand how CFDs work and whether you can afford to take the high risk of losing your money. Past performance is not necessarily indicative of future results. The value of investments may fall as well as rise and the investor may not get back the amount initially invested. This content is not intended for nor applicable to residents of the UK. Cryptocurrency CFDs and spread bets are restricted in the UK for all retail clients.

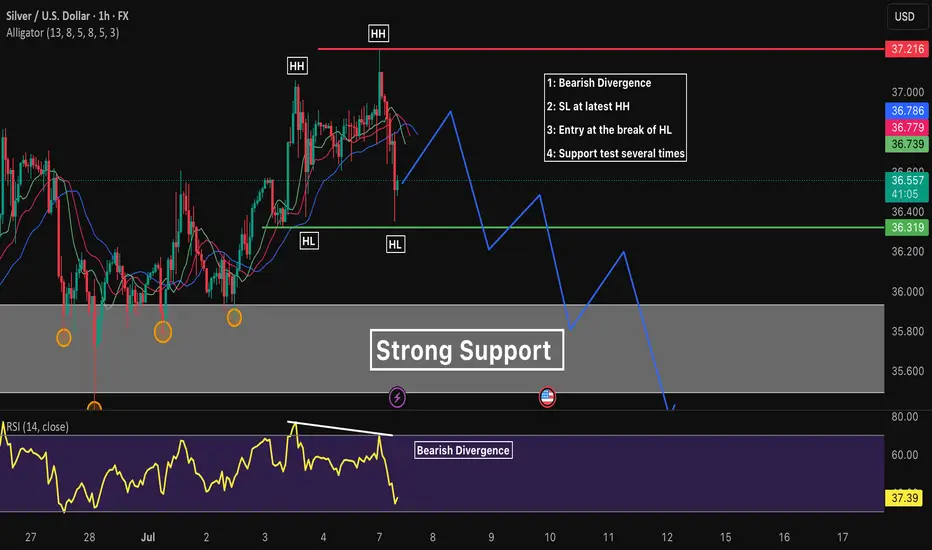
SILVER Technical Analysis! SELL!
My dear followers,
I analysed this chart on SILVER and concluded the following:
The market is trading on 36.935 pivot level.
Bias - Bearish
Technical Indicators: Both Super Trend & Pivot HL indicate a highly probable Bearish continuation.
Target - 36.582
About Used Indicators:
A super-trend indicator is plotted on either above or below the closing price to signal a buy or sell. The indicator changes color, based on whether or not you should be buying. If the super-trend indicator moves below the closing price, the indicator turns green, and it signals an entry point or points to buy.
Disclosure: I am part of Trade Nation's Influencer program and receive a monthly fee for using their TradingView charts in my analysis.
———————————
WISH YOU ALL LUCK
SilverCOT: The Managed Money net long remains high at approximately 45,000 contracts. A recent correction of Δ = –4,000 indicates some position unwinding, but the absolute long exposure is still firmly in bullish territory.
ETF Flows: Silver ETFs saw net inflows in June, signaling increased investment interest.
Daily Chart (D1): A bullish flag has formed following the July 1 impulse, with the flag pattern repeating throughout the week.
50-Day EMA: Around $35 – price is holding above this level, confirming the medium-term uptrend.
Silver continues to trade in a medium-term uptrend, supported by declining U.S. real yields, a weaker dollar, and ongoing ETF inflows into precious metals. Despite some reduction in speculative long positions (COT), the overall net long remains substantial.
Technically, price is consolidating above the 50-day EMA on the daily chart and preparing to test resistance at $37.30. A breakout above this level would confirm further upside toward $38.30, whereas a false breakout off the EMA50 (near $37.30) would provide a strong downward impulse and a long entry opportunity with a strict stop-loss ≤ 0.4%.
Trade Ideas:
SHORT at $37.40 on a false breakout above resistance.
LONG near $36.00, based on a double-bottom pattern on the 5-minute chart.
Avoid trading a clean breakout above $37.30—stop-loss would be too large.
Risk Management:
Stop-loss: 0.6%
Take-profit targets: Risk-Reward ratios of 1:3 and 1:5.

Watching Silver Prices After Recent HighsI see 3 main scenarios for silver's next few moves. I don't expect its lower support levels to be tested if the pattern represents the yellow path. I expect the green scenario to be the most likely outcome. Blue wouldn't surprise me either ($$) especially as the dollar's performance has a downward momentum.
DYOR
Trade Slick

XAGUSD Analysis : Consolidation & FMFR Setup + Target🧭 Technical Overview:
Silver has had a strong bullish rally that started after the breakout of a long-term symmetrical triangle pattern. This breakout marked a Major Break of Structure (BOS) and shifted the overall market sentiment toward the bulls. Since then, price has been consolidating under a major resistance zone, forming a compression range, which is now shown as a blue elliptical zone in the chart.
This ellipse is not just a consolidation area — it represents a neutral compression zone where price can explode in either direction. The price action inside this area has been choppy and manipulative, sweeping both local highs and lows without real follow-through — a perfect environment for a Fake Move – then Reversal (FMFR) strategy.
🔍 Key Chart Components:
🔹 1. Ellipse (Dual Directional Zone)
This region shows indecision. Price is coiling inside, creating higher lows and lower highs — a volatility squeeze. A breakout from this ellipse is likely, but the first breakout move may be fake, followed by a quick reversal.
🔹 2. Major BOS (Break of Structure)
Price broke out of a long-term descending structure and pushed strongly upward, which marked a significant bullish shift. The pullback after that BOS was shallow — a sign of continued strength — but now we’re at a decision point.
🔹 3. Resistance Zone (Previous Target Area)
The price is now retesting a strong historical resistance around $37.00–$38.00, where we’ve seen rejections before. This is the liquidity zone where breakout traders enter long, but institutions may sweep them for liquidity before reversing.
🔹 4. Minor and Major CHoCH Levels
Minor CHoCH: Around $35.00–$35.50
Major CHoCH: Near $33.80–$34.00
These are reversal zones to watch if a fake move to the upside occurs and price rolls over.
📉 FMFR Setup Explained:
FMFR (First Move Fake Reversal) is a market behavior pattern where:
Price fakes a breakout in one direction (e.g., above resistance).
Attracts liquidity (traders’ orders).
Reverses rapidly in the opposite direction, trapping those who entered late.
In your chart, the blue notes say:
“In This Case, XAGUSD Have to Gave FMFR From Anyside”
“First Move Fake Then Reversal”
This highlights that no matter which direction the market initially breaks, it’s likely to reverse shortly afterward. This pattern is often seen before major moves when the market seeks to clear liquidity.
🔄 Scenarios to Watch:
🅰️ Bull Trap (Fake Breakout)
Price spikes above $37.80–$38.00.
Sweeps the highs and rejects sharply.
Reversal triggers below the ellipse, heading toward minor/major CHoCH.
🅱️ Bear Trap (Fake Breakdown)
Price dips below $35.00 (minor CHoCH).
Triggers panic sells.
Then rebounds quickly into the previous high zone or beyond.
⚙️ Trading Strategy Ideas:
Wait for Confirmation: Enter only after a confirmed breakout and retest OR a fakeout with reversal candles (e.g., engulfing, pin bar).
Use Tight Risk Management: Place stops outside sweep zones. This setup is volatile and can trap undisciplined trades.
Watch Volume & Wicks: Spikes with wicks and no close beyond the level usually confirm FMFR setups.
🔐 Key Levels to Watch:
Zone Price Level Action
Major Resistance $37.00–$38.00 Watch for fakeouts
Minor CHoCH ~$35.00–$35.50 Reversal entry zone
Major CHoCH ~$33.80 Last line of bullish defense
📝 Final Thoughts:
This is a textbook FMFR compression setup, where volatility is building inside a symmetrical price zone. The first aggressive move from this region is likely to be deceptive. Smart money traders look for trap setups, not the obvious direction. Silver is approaching a high-risk, high-reward decision zone, and staying patient will be key.
📊 Wait. Observe. React — don’t predict blindly.
