Nvidia - 100% new all time highs!Nvidia - NASDAQ:NVDA - is just too bullish now:
(click chart above to see the in depth analysis👆🏻)
Honestly it was not unexpected that Nvidia is now the most valuable company in the world. The chart is just so strong and perfectly following structure; it seems to be just a matter of days until
Next report date
—
Report period
—
EPS estimate
—
Revenue estimate
—
2.59 CHF
66.44 B CHF
118.96 B CHF
23.40 B
About NVIDIA
Sector
Industry
CEO
Jen Hsun Huang
Website
Headquarters
Santa Clara
Founded
1993
FIGI
BBG006TLSPX6
NVIDIA Corp engages in the design and manufacture of computer graphics processors, chipsets, and related multimedia software. It operates through the following segments: Graphics Processing Unit (GPU), Tegra Processor, and All Other. The GPU segment comprises of product brands, which aims specialized markets including GeForce for gamers; Quadro for designers; Tesla and DGX for AI data scientists and big data researchers; and GRID for cloud-based visual computing users. The Tegra Processor segment integrates an entire computer onto a single chip, and incorporates GPUs and multi-core CPUs to drive supercomputing for autonomous robots, drones, and cars, as well as for consoles and mobile gaming and entertainment devices. The All Other segment refers to the stock-based compensation expense, corporate infrastructure and support costs, acquisition-related costs, legal settlement costs, and other non-recurring charges. The company was founded by Jen Hsun Huang, Chris A. Malachowsky, and Curtis R. Priem in January 1993 and is headquartered in Santa Clara, CA.

keep an eye on 144.80 !boost and follow for more!💖
NVDA is hitting my bullish targets a mentioned in my last update from early April🎯, now watching my final short term price target of 144.80, if this can break and hold this week then a rally to new ATH/175-200 should follow.
if we reject here then a dip to 124-132 shoul

NvdaRising wedge just like Qqq, Spy, and most of tech sectors...
Price should begin the decline down to 112.00 with a pit stop first at 128 or 200ma ..
I expect a dead cat bounce there back to 134 before the next leg down
As you can see here looking at the Chip sector SMH
You have a similar Risi

Fundamental and technical analysis on NVDA (Chicken Nugget) soonFundamental Analysis
NVIDIA Corporation (NVDA) remains a key player in the tech sector, benefiting from the rise of artificial intelligence, data centers, and gaming. With sustained growth, constant innovation, and strong demand for its graphics chips, the company continues to deliver solid financ

NVDA Support and Resistance Lines Valid from June 1 to 30Overview:
These purple lines act as Support and resistance lines when the price moves into these lines from the bottom or the top direction. Based on the direction of the price movement one can take long or short entries.
Trading Timeframes
I usually use 30min candlesticks to swing trade option

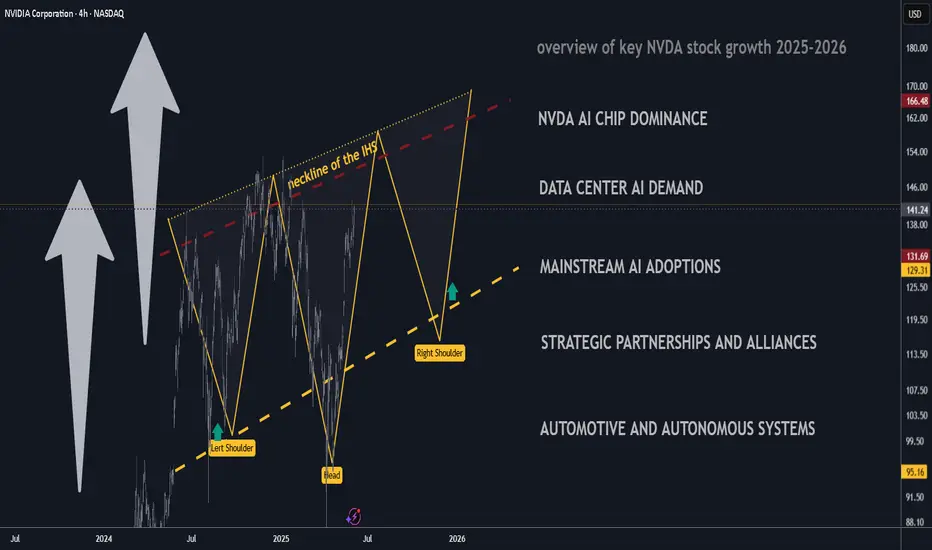
Key Catalysts Driving Nvidia’s Stock Growth 2025 and BeyondKey Catalysts Driving Nvidia’s Stock Growth (Mid-2025 Onward)
Nvidia (NVDA) has solidified its position at the center of the AI computing boom, with record fiscal 2025 revenue of $130.5 billion (114% year-over-year growth) driven by surging demand for its AI chips. Looking ahead from mid-2025, mul
How to see other users positions on an asset - Long vs Short Want a quick way to be able to see what others are thinking about an asset - whether they are long or short - and perhaps even which users are making the best calls?
TradingView has it built in with a couple of button clicks :)

Is NVDA Building Strength Before a Breakout?After cooling off from its $150 highs, NVIDIA (NVDA) is consolidating in the $140–$145 zone. While some traders fear the AI hype has peaked, others see this as the calm before another rally. With solid fundamentals, continued leadership in AI, and strong institutional backing, NVDA remains a name to

NVDIANVDIA will not back down until 158-160 level is reached. Wait for setup and aim for the target.
Disclosure: We are part of Trade Nation's Influencer program and receive a monthly fee for using their TradingView charts in our analysis.

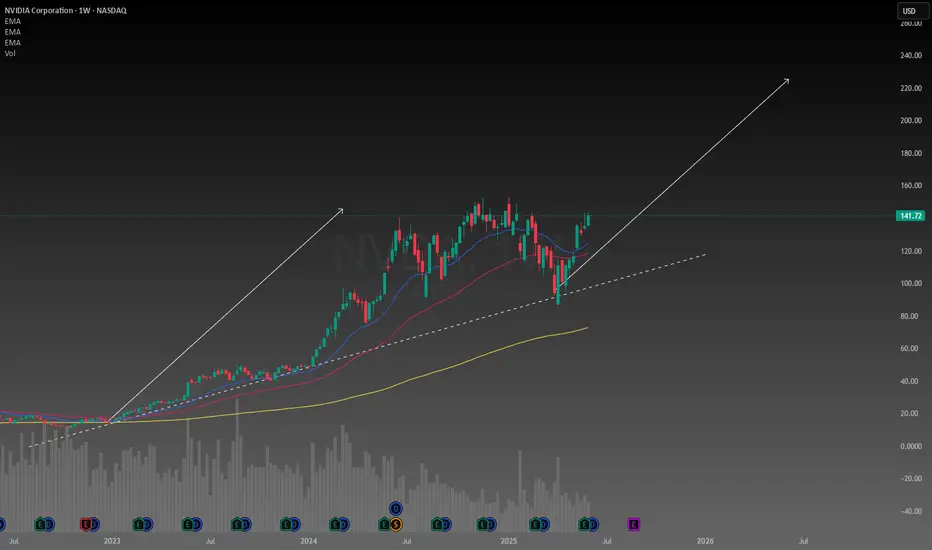
Nvidia could be worth $220 by this time next yearThe amount of money this company is making is insane and it doesn't look like its going to slow down any time soon. There is strong demand for Nvidia products universally there is no limit to how far this thing will go. Over the past 5 years it has outperformed Bitcoin, need I say more?
I am abit l
See all ideas
Summarizing what the indicators are suggesting.
Neutral
SellBuy
Strong sellStrong buy
Strong sellSellNeutralBuyStrong buy
Neutral
SellBuy
Strong sellStrong buy
Strong sellSellNeutralBuyStrong buy
Neutral
SellBuy
Strong sellStrong buy
Strong sellSellNeutralBuyStrong buy
An aggregate view of professional's ratings.
Neutral
SellBuy
Strong sellStrong buy
Strong sellSellNeutralBuyStrong buy
Neutral
SellBuy
Strong sellStrong buy
Strong sellSellNeutralBuyStrong buy
Neutral
SellBuy
Strong sellStrong buy
Strong sellSellNeutralBuyStrong buy
Displays a symbol's price movements over previous years to identify recurring trends.
NVDA4971919
NVIDIA Corporation 3.7% 01-APR-2060Yield to maturity
6.21%
Maturity date
Apr 1, 2060
NVDA4971918
NVIDIA Corporation 3.5% 01-APR-2050Yield to maturity
6.18%
Maturity date
Apr 1, 2050
NVDA4971917
NVIDIA Corporation 3.5% 01-APR-2040Yield to maturity
5.71%
Maturity date
Apr 1, 2040
US67066GAN4
NVIDIA 21/31Yield to maturity
4.61%
Maturity date
Jun 15, 2031
NVDA4971916
NVIDIA Corporation 2.85% 01-APR-2030Yield to maturity
4.41%
Maturity date
Apr 1, 2030
US67066GAE4
NVIDIA 2026Yield to maturity
4.27%
Maturity date
Sep 16, 2026
NVDA5203204
NVIDIA Corporation 1.55% 15-JUN-2028Yield to maturity
4.17%
Maturity date
Jun 15, 2028
See all NVDA bonds
Curated watchlists where NVDA is featured.


Related stocks
Frequently Asked Questions
The current price of NVDA is 15.90 CHF — it hasn't changed in the past 24 hours. Watch NVIDIA stock price performance more closely on the chart.
Depending on the exchange, the stock ticker may vary. For instance, on SIX exchange NVIDIA stocks are traded under the ticker NVDA.
We've gathered analysts' opinions on NVIDIA future price: according to them, NVDA price has a max estimate of 170.25 CHF and a min estimate of 81.07 CHF. Watch NVDA chart and read a more detailed NVIDIA stock forecast: see what analysts think of NVIDIA and suggest that you do with its stocks.
NVDA reached its all-time high on Jan 19, 2024 with the price of 15.90 CHF, and its all-time low was 0.47 CHF and was reached on Nov 13, 2014. View more price dynamics on NVDA chart.
See other stocks reaching their highest and lowest prices.
See other stocks reaching their highest and lowest prices.
NVDA stock is 0.00% volatile and has beta coefficient of 2.34. Track NVIDIA stock price on the chart and check out the list of the most volatile stocks — is NVIDIA there?
Today NVIDIA has the market capitalization of 2.81 T, it has increased by 6.27% over the last week.
Yes, you can track NVIDIA financials in yearly and quarterly reports right on TradingView.
NVIDIA is going to release the next earnings report on Aug 27, 2025. Keep track of upcoming events with our Earnings Calendar.
NVDA earnings for the last quarter are 0.67 CHF per share, whereas the estimation was 0.61 CHF resulting in a 9.89% surprise. The estimated earnings for the next quarter are 0.81 CHF per share. See more details about NVIDIA earnings.
NVIDIA revenue for the last quarter amounts to 36.47 B CHF, despite the estimated figure of 35.87 B CHF. In the next quarter, revenue is expected to reach 36.94 B CHF.
NVDA net income for the last quarter is 15.54 B CHF, while the quarter before that showed 20.14 B CHF of net income which accounts for −22.83% change. Track more NVIDIA financial stats to get the full picture.
Yes, NVDA dividends are paid quarterly. The last dividend per share was 0.01 CHF. As of today, Dividend Yield (TTM)% is 0.03%. Tracking NVIDIA dividends might help you take more informed decisions.
NVIDIA dividend yield was 0.03% in 2024, and payout ratio reached 1.16%. The year before the numbers were 0.03% and 1.34% correspondingly. See high-dividend stocks and find more opportunities for your portfolio.
As of Jun 15, 2025, the company has 36 K employees. See our rating of the largest employees — is NVIDIA on this list?
EBITDA measures a company's operating performance, its growth signifies an improvement in the efficiency of a company. NVIDIA EBITDA is 73.05 B CHF, and current EBITDA margin is 63.85%. See more stats in NVIDIA financial statements.
Like other stocks, NVDA shares are traded on stock exchanges, e.g. Nasdaq, Nyse, Euronext, and the easiest way to buy them is through an online stock broker. To do this, you need to open an account and follow a broker's procedures, then start trading. You can trade NVIDIA stock right from TradingView charts — choose your broker and connect to your account.
Investing in stocks requires a comprehensive research: you should carefully study all the available data, e.g. company's financials, related news, and its technical analysis. So NVIDIA technincal analysis shows the buy rating today, and its 1 week rating is buy. Since market conditions are prone to changes, it's worth looking a bit further into the future — according to the 1 month rating NVIDIA stock shows the buy signal. See more of NVIDIA technicals for a more comprehensive analysis.
If you're still not sure, try looking for inspiration in our curated watchlists.
If you're still not sure, try looking for inspiration in our curated watchlists.