$NVDA one more leg lower $58-76 targetNASDAQ:NVDA bounced off the lows at $86 but is now finding resistance, I think it's likely that we turn lower next week and start falling towards the targets below.
I think it's very likely that we make it down to the lower supports at $63-58 before we see a sustainable bounce form.
Let's see how it plays out over the coming weeks.
NVDA trade ideas

The Case for NVDA to 40As a prereq to this post it would be good to read my post on SMCI. In that I link to all the real time forecasts in SMCI of the methods we're using for the NVDA forecast.
And somewhat lay the groundwork for this post.
Click the post to read in full.
===#
So let's start with the big overview. NVDA for a long time has been trading inside of the risk zone for the end of wave.
Here's a forecast on NVDA when it was 500 (pre split)in which I mapped out the full extension of an Elliot wave.
Click the post to read in full.
In that post based on the assumption the previous rally was wave one we could make a forecast of a rally to around 800 - 900 and then some head fake action above 1,000.
I also put fibs on the chart and showed how this move would be a breaking of the 1.61 and a full extension to the 4.23.
As you can see, we're now sitting right at that big 4.23 level I brought up back in 2024.
Here's the thing spoken of in the SMCI top.
In that post I spoke about the tendency for move to end on spike outs of the 4.23 and they can make full retracements all the way to the 1.27 (or worse, in some cases - that's the bull setup).
The 4.23 is a big decision point. If NVDA held the 4.23 as support I'd be insanely bullish on this for the next couple years ahead. It'd be a huge win for the bulls I'd think.
However, if that was a head fake over the 4.23, you've seen the best you'll see from NVDA for a while. Indeed, we would be very close to entering the worst you've seen from it.

Nvidia Prepares For New All-Time High, Last Chance To Buy Low!The market always gives as second chance. This is a phrase that I love to share and it is true, it is confirmed here on this very chart.
The action for NVDA moved back down to produce a higher low —your second and last chance. This higher low is happening within a very strong buy-zone and this can mean the difference between massive profits or an opportunity that is lost. From here on, Nvidia will grow long-term set to produce a new All-Time High in the coming months.
The minimum target and price level for this rise stands around ~150 within 1-3 months. Then a correction and then higher, much higher... Up, up and up go we.
I can entertain you with tons of details I have the ability but I will not do so. I will go straight to the point.
» The next All-Time High and main target for this wave is 194, this can take a little more, or less, than 6 months.
What will happen next, we will have to wait to ask the chart.
It is my pleasure to write for you again.
Make sure to boost if you would like more updates.
If you boost and comment, we can move to daily updates as the market grow.
Go in, go now, buy-in and go LONG!
Nvidia is going up! Together with Bitcoin and the Altcoins.
Thanks a lot for your continued support.
Namaste.

$NVDA forming local higher low and above 20-Day SMA NASDAQ:NVDA has traded very poorly recently. Today we are looking at a daily price chart of NASDAQ:NVDA and we have seen many lower lows and lower highs since GTC Conference. After touching the ATH of 150 $, the price is making new lows and has recently touched the lows of 85 $ and made new higher low of 95 $. So, this marks a double higher bottom and now the at 105 $ is now above 20 Day SMA. This might mark a bullish reversal in my opinion.
So why not a trade idea on a Friday. #TGIF. I say we go long NASDAQ:NVDA here and now. Remain long if it remains over the 50-Day, 100-Day and 200-Day SMA. 200-Day SMA ist currently @ 125 $. If NVDA has a weekly close above 125 $ then we go all in on $NVDA.
Verdict: Long NASDAQ:NVDA here until 125 $. Keep watching this space for next levels.

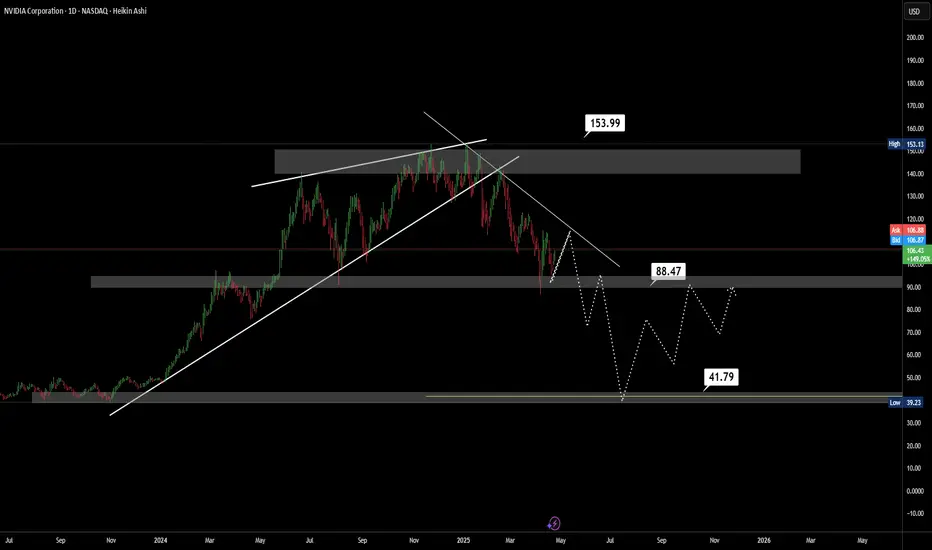
Bearish Continuation in PlayAfter an extended distribution phase near the premium zone and a clear break of the ascending channel, NVDA has shifted into a bearish market structure.
Price is currently pulling back into a key supply zone and retesting the bearish trendline. If this area holds, we could see further downside movement with the following targets:
🔻 $88.47 – potential support and short-term consolidation area.
🔻 $41.79 – medium-term target if bearish momentum continues and support breaks.
This bearish outlook remains valid as long as price stays below $153.99, which marks the invalidation level and the potential start of a bullish reversal.
🔍 Market structure is showing consistent lower highs and lower lows, confirming bearish pressure.
NVDA Time For Bounce?Nvidia has been in a strict downtrend for the last few months, forming a constricting price action in the form of a falling wedge.
Generally, this can be seen as a bullish reversal pattern as "pressure" builds within the wedge before ultimately an explosive move.
I will look to take long trades here with a stop below the previous low with a 1H candle close as an invalidation.
Any potential good news can be a massive catalyst for the market, majorly Nvidia who has been a large target of trumps tariffs in relation to china.

INTEL DROP --- FIELD COMM LOG #02242025🪖 WAR ROOM DISPATCH — FIELD REPORT FROM CAMP JARVIS & CAMP LIVERMORE
Date: 4/24/2025
Status: STANDBY
Volume: Normal
Current Order: HOLD
⚔️ SUMMARY OF ENGAGEMENTS – LAST 30 DAYS
The battlefield has been blood-red. Abnormal reactions litter the map. Morale was tested—but our troops never broke. The Red Army pushed hard, exploiting weakness, creating chaos. Yet we held.
📍Camp Jarvis
Coordinates: 115.10
☑️ Status: HOLD
📈 Trend: UPTREND
📊 ATR: Tightening (3.39)
🟩 Zone: Top of box: 115.10 | Bottom: 86.62
📢 Latest: “We’re nearing breakout. Position secure. Scouting volume now.”
Jarvis is seeing a shift—momentum is whispering beneath the soil. There's life stirring. But RSI is low (sub-45). This isn't the time for heroes—it’s a time for patience. Let the weak exhaust themselves.
📍Camp Livermore
Position: Natural Reaction Zone
☑️ Status: HOLD
📉 Trend: Weak uptrend but too early to act
🔄 Recent movement: Mixed signals, sporadic action, no confirmation.
Livermore's forces are strong in discipline, but not yet in numbers. They report: “Volume’s stable, but not convincing. We’ll move when the field confirms it—not before.”
📛 INTEL WARNING
The maps are clear—we are not in breakout yet.
There’s a false calm in the air.
Do NOT chase. Do NOT preempt.
This is how armies get slaughtered in the fog.
💡 Key Quote from Command:
“The Red Army still has strength. We’re holding—but holding isn’t winning. We wait for the flinch. The break. The rally cry. That’s when we move.”
🎖️ Current Position: HOLD
🛡️ Camp Jarvis: Monitoring breakout zone
🧭 Camp Livermore: Awaiting troop confirmation
📉 RSI low, Trend early
🔕 No All-Signal-Go confirmed
🚨 Mixed Signals = DO NOT ADVANCE
The war is not over.
But neither are we.

NVDA Recovery in Motion — Bullish Setup BrewingNVDA 6H TECHNICAL ANALYSIS 📈
OVERALL TREND
📈 UPTREND — The chart confirms an early-stage recovery from a key pivot low (April 22), with moderate confidence (4.8%). The structure is forming higher lows, and price is currently above several critical short-term MAs. Trend Score sits at +0.10.
📉RESISTANCE ZONE
🔴 153.1300 — SELL STOPLOSS | PIVOT HIGH
🔴 149.8423 — SELL ORDER 2
🔴 143.18875 — SELL ORDER 1
🎯ENTRIES & TARGETS
🎯 139.8280 — EXIT BUY & TP 4
🎯 127.7263 — BUY ORDER & TP 3
🎯 119.8750 — BUY ORDER & TP 2 | MID PIVOT
🎯 108.5705 — BUY ORDER & TP 1
📈SUPPORT ZONE
🟢 97.0121 — BUY ORDER 1
🟢 89.9455 — BUY ORDER 2
🟢 86.6200 — BUY STOPLOSS | PIVOT LOW
✍️STRUCTURAL NOTES
Recent bounce from 86.62 pivot low signals strong bullish interest
Key reentry occurred above 97.01, aligning with short-term moving averages
All major short-term and mid-range MAs (10–100) are BUY-rated
Oscillators mixed: MACD and Ultimate Oscillator lean bullish, while Momentum and Williams %R flash caution
Ichimoku Base Line neutral — awaiting trend confirmation
Hull MA diverges from other MAs — short-term caution on overheated price
📉TRADE OUTLOOK
📈 Bullish bias toward TP3 @ 127.72 and TP4 @ 139.82
📉 Short-term pullback likely at 108.57 or 119.87 — use dips as potential reentry
🔍 Watch for rejection near 143.18–153.13 to reassess continuation vs correction
🧪STRATEGY RECOMMENDATION
CONSERVATIVE TREND FOLLOW:
— Entry: 97.01
— TP: 108.57 / 119.87 / 127.72 / 139.82
— SL: Below 86.62
AGGRESSIVE REVERSAL:
— Entry: 86.62 (Pivot Low Defense)
— TP: 97.01 / 108.57
— SL: Below 83.00
“Discipline | Consistency | PAY-tience™”

NVDA FVG 111.90 I can see now that it has started to move up after all the fakeness in the market. Clear FVG to be filled in the 1 hour timeframe. Price needs rebalance. I am expecting a bounce to 104 in order to cap on orders and move up to close out the FVG. From there we can see what price will want to do.


NVDIA Short to T1 2 Setups here.
- Both T1 and T2 will be hit as part of my price return to zero system (inflexion points).
- I'm shorting to T1 first and then reverse into long for T2. If it heads to T2 first I'll simply stay in my original T1 short for the duration.
It is of course easy to say that this will either go up or down :-). My system defines targets and there is no rules to say that can only produce a target in one direction. Based on what I see I know with around 95% accuracy that it will hit both with a reasonable timescale. I just don't know which one comes first :).
Either way I'm shorting to T1 in the first instance. It may hit T2 first but that doesn't bother my trading as I still expect T1. I won't go down the route of a martingale to T! if it goes to T2 first!! that's just asking for trouble regardless of confidence levels!


Nvidia - The Chart Just Told Us So!Nvidia ( NASDAQ:NVDA ) might just still head a little lower:
Click chart above to see the detailed analysis👆🏻
After Nvidia perfectly retested the previous rising channel resistance just a couple of months ago, it was quite expected that we'll see a retracement. The overall trend however still remains bullish and if Nvidia drops a little more, the overall bullrun continuation rally might just follow.
Levels to watch: $80
Keep your long term vision,
Philip (BasicTrading)

cup with handle pattern on the 1-hour time frameWelcome to today's analysis! Let’s break down the current price action on NASDAQ:NVDA and potential trade setups.
🌐 Overview: NASDAQ:NVDA Forming a Cup with Handle Pattern
📈 NASDAQ:NVDA is currently forming a cup with handle pattern on the 1-hour time frame. This pattern is typically bullish and could indicate a potential upward move.
🔄 Current Scenario:
NASDAQ:NVDA has formed a cup shape and is now developing the handle. The handle is a consolidation phase before a potential breakout.
The key level to watch is the resistance at the top of the handle. A breakout above this level could signal a bullish continuation.
🔑 Key Levels to Watch
🔴 Resistance: Top of the Handle (Needs breakout for continuation)
🟢 Target: Measured move equal to the depth of the cup, projected from the breakout point.
🛠️ Trade Scenarios
📌 Bullish Scenario (Breakout Above Resistance)
If NASDAQ:NVDA breaks and holds above the handle resistance, it could move toward the target level.
This breakout would confirm the cup with handle pattern and suggest a potential upward trend.
📌 Bearish Scenario (Failure to Breakout)
If NASDAQ:NVDA fails to break out and instead moves lower, it could retest the support levels within the cup or handle.
A failure to hold above key support levels could indicate a potential reversal or further consolidation.
📌 Conclusion
NASDAQ:NVDA is forming a cup with handle pattern on the 1-hour time frame. A breakout above the handle resistance could signal a bullish move toward the target level. If the price fails to break out, further consolidation or a retest of support levels may be necessary.

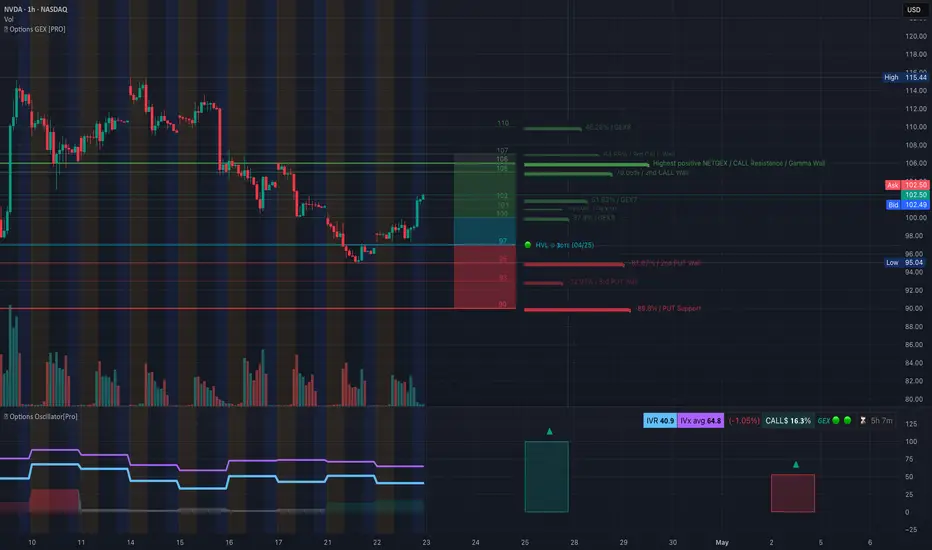
NVDA Options GEX + Trade Forecast – April 23, 2025🔍 GEX Options Overview:
NVDA is experiencing a clear options-driven magnet toward 105–106, with notable call wall concentration and positive NET GEX at those levels:
* Highest positive GEX zone: 105–106 = bullish gamma magnet
* HVL for 3DTE anchored at 97 = strong bounce zone
* PUT walls stacked at 95, 93, 90 showing limited downside support but weakening pressure
* Options Oscillator confirms this bullish lean with green GEX dots, low IVX, and relatively low IVR (40.9)
Despite the macro softness, NVDA has gamma fuel to push up, especially with no strong call resistance until the 105–107 zone. This sets up a favorable risk/reward setup for short-term bullish trades.
📈 Technical Analysis & Trading Outlook:
From the SMC Co-Pilot chart, NVDA is rebounding after forming multiple BOS (Break of Structure) signals and is now consolidating under a previous CHoCH level, near the 102–103 zone.
* Trend Bias (MTF): 30m & 15m bullish, but 1h still recovering
* HTF Structure: Bullish SMC structure forming, but caution is required
* Volume: Extreme spike (1.6x) during reversal = institutions may be stepping in
* Setup Status: No trade confirmed yet – but we are in premium zone, so shorts are risky unless structure shifts
* EMA21 is the decision zone; price reclaiming and holding above would confirm further upside
🧠 My Thoughts:
This is one of those setups where the GEX setup is leading price, and technicals are just beginning to catch up. The move from 97 to 102 was gamma-fueled, and any dip toward 100 or 98 may provide high R/R re-entry zones for CALL scalps or spreads.
No trade now unless we get either:
1. A clean pullback to 99–100 and bounce with confirmation (BOS/CHoCH + volume support)
2. Break and hold above 103.5 with strength — then scalp to 106
⚠️ Avoid chasing at highs without confirmation. Volume and structure will decide whether this is a dead cat bounce or start of a new leg up.
This analysis is for educational purposes only. Always trade with a plan and proper risk management.
NVIDIA: From $300B to $3T – Is the Pullback a Setup?Between October 2022 and mid-2024, Nvidia's market capitalization surged from $300 billion to over $3 trillion — a tenfold increase that outpaced the GDP of entire nations such as Russia or Canada. This meteoric rise made Nvidia the largest public company in the world at one point.
A long-term investment in NVDA has dramatically outperformed the broader market. From May 2014 to May 2024, the stock gained over 22,000%, compared to 179% for the S&P 500 and 77% for gold.
However, in 2025, Nvidia stock declined by 43%, raising the question: does this mark the end of the rally or the beginning of a new accumulation phase?
Core Drivers
AI dominance: Nvidia controls 95% of the GPU market used in machine learning applications.
Strategic clients: Tesla, Meta, Microsoft, and Alphabet continue to deepen partnerships with NVDA.
Crypto leverage: The company holds 82% of the GPU market used for mining, benefiting from the renewed crypto upcycle.
Domestic production push: Nvidia is developing over 1 million square feet of manufacturing space in Arizona and Texas, aiming to produce $500B worth of AI infrastructure over the next four years.
Policy support: The US and EU are investing more than $240B to secure domestic chip production via the CHIPS Acts.
Financial Strength
FY2024 revenue grew 114% YoY to $130.5B
Q4 net income reached $22B
Nvidia joined the Dow Jones Industrial Average in late 2024
Announced a $50B buyback program
Executed a 10-for-1 stock split in June 2024
Trading View
After peaking in 2024, NVDA retraced to the $110 area, which now acts as a potential accumulation zone. The next major resistance lies near $150, offering a 35% upside if momentum returns.
The macro backdrop remains highly favorable — AI infrastructure investment continues to accelerate, and the recent correction may reflect short-term positioning rather than fundamental weakness.
Final Thoughts
Nvidia is no longer just a semiconductor company — it is a system-level platform powering the AI economy. With robust fundamentals, strategic expansion, and institutional demand, the current price levels could represent a key medium-term opportunity for trend-followers and long-term investors alike.
#NVDA #Nvidia #Semiconductors #AI #EquityMarkets #TradingViewIdeas

$NVDA – Going Long Long LONGTaking a long position here at $98 – yes, despite the noise.
There’s no denying the pressure across semiconductors following renewed tariff threats from the Trump administration. But I believe this is more short-term overreaction than long-term damage. Any meaningful negotiation or de-escalation could act as a slingshot for these names, especially leaders like Nvidia.
Nvidia's fundamentals remain incredibly strong. The company is still outpacing its peers in AI, data centers, and gaming hardware. Profitability remains intact, and there’s no indication of a breakdown in their competitive edge.
Technicals are giving us some strong signals:
We're seeing a long-term bullish divergence forming.
RSI is approaching oversold territory – rare for Nvidia and historically a signal for strong bounces.
Price is nearing key long-term support levels that held in previous cycles.
I'm positioning early here because I believe the broader market is mispricing geopolitical risk. If the situation improves – and it often does faster than expected – NVDA is one of the first names that will rebound aggressively.
Let’s see how this plays out, but I’m confident this is a high-conviction entry point in the 80's and 90's.

NVDA - DECENT CONFIRMATION Good Morning,
Seeing some strength in NVDA since yesterday. Trend is showing another strong movement upwards. There is a divergent volume profile since the original YTD low on April 7th 2025.
I feel a little like this is like taking candy from a baby, lets see what happens.
Enjoy!

simple chart of what I seeAnyone who knows me know I like to make simple charts that get to the point. Nothing fancy. Just lots of lines. Anyway, I did a ghost feed so you can get an idea of where I think we go from here. I seriously doubt we see any big changes until earnings. Unless China gets their heads out of the you know what, we will trade like this for a little while. I do feel there is hoppe. If NVIDIA has strong earnings , it could be enough push it to new highs. I would use caution. You will see by my chart we started off with an ascending wedge, moved right into a descending wedge and now I feel we will rinse and repeat. All the while ultimately creating new highs and new lows. Anywhere you see horizontal lines is where I see resistance. And yes, I do still think we could drop below 100 again, so get your buy fingers ready :) Not financial advice! Just an old trader's ideas. If we break above 130 before now and earnings, consider it could be a nice ride up!!


Where is the Nvidia ball bouncing?Good afternoon, at 15:48 p.m Nvidia is looking towards the up side. A sell off took place over the weekend (great deals).A swing up at least $3 in an accumulation or quick move up is likely. Decent entries to look for adding a steady 5% to 10% in a few days in this high volatile climate.


NVDA’s Wild Crash Alert: I’m Braced for a Heart-Stopping Drop!NVDA’s like a rocket losing altitude, and I’m on edge! It’s at $95.99, but I’m seeing it tumble to $90, maybe $88.95, then $83.59 if the bears go wild. If that breaks, whoa—$77.48 could hit hard! I’m glued to $90 for the first clue—big selling there, and it’s game on for a slide.
Kris/Mindbloome Exchange
Trade Smarter Live Better

