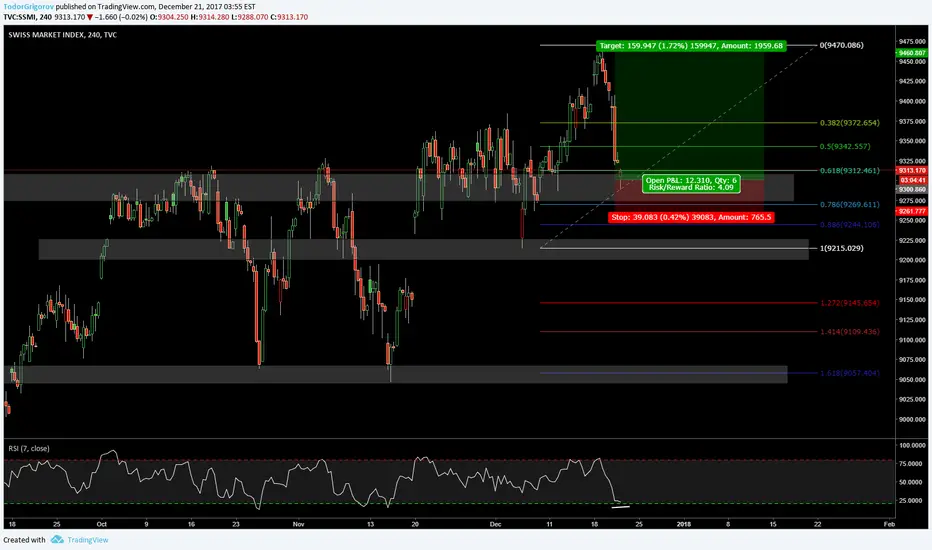
SMI Major Multi-Year Resistance (Monthly chart)The Swiss market index is now again testing a the major multi-year resistance around ~9 500 which in the past has produced multiple strong rejections.
Potential Short-term/Intermediate-term bearish plays from this resistance. Lower timeframe for possible entry.
SMI trade ideas


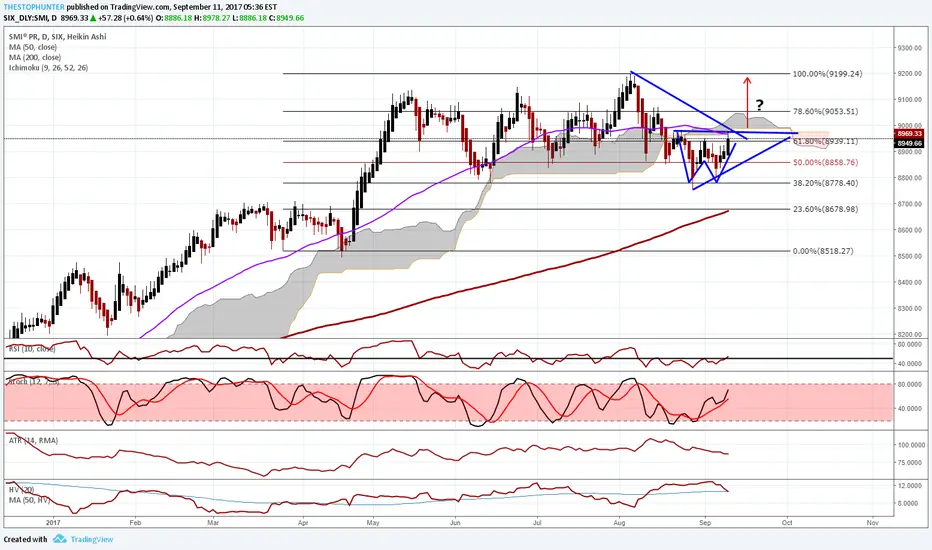
Swiss SMI - Cup and handles or triple top?Please tell me if I'm wrong as I'm shaky on technical patterns but is that 2 cup and handle patterns for the SSMI? It's pretty obvious that it may well come up against some massive resistance sooner rather than later but if it can break that resistance......... Interesting times.


Long SSMI at 8,511.00; TP @ 8681.22, SL your choiceLong SSMI at 8,511.00; TP @ 8681.22, SL your choice

Swiss Market Index LONGLong SMI. Trend continuation. 200MA acts as support, supported by 100MA heading up. On daily TF RSI oversold with divergence COPPOCK confirmes it. Coppock above 0 line on Daily Bullish momentum price above 20MA. Looking for retest of structure usually SMI lags behind EU indices or FIB extension to reach new highs. GOOD LUCK


Swiss Market Index Buy DailyGood buying opportunity on the SMI. Trend continuation trade. MACD signs of continuation. Previous resist becomes support

SWISS MARKET INDEX SIMPLE TRADE 4H LONGNot bad long opportunity on SMI RSI oversold strong level of support uptrend
Swiss Stock market - text book Elliott Wave?This one will probably let me down right at the end of the move but I have attempted to show how this 5th wave has taken on board many facets of Elliott Wave. The principle of alternation in the two corrections, the fib extensions and the otherwise clear nature of the count. I am expecting another, final leg up to complete the 5th wave and this text book example of wave theory so it will probably go wrong here by not doing what I expect it is going to do. The final wave here is a bit ambiguous and could have completed already. Time will tell, as ever.

Swiss Stock Market Probable Top Please see TOMJ2417 great post today 11/23/17 on the SSMI
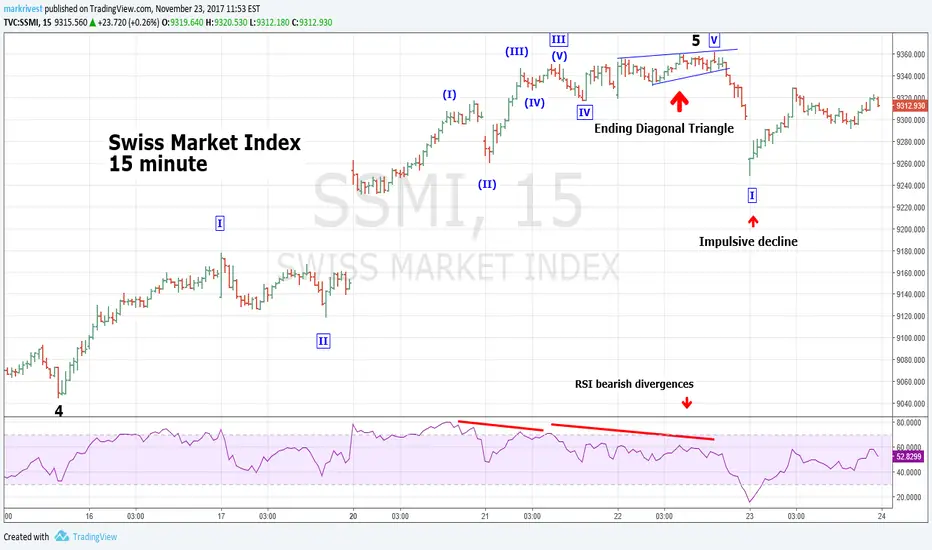
This is a follow up post, showing at the 15 minute level a probable completion of what TOMJ2417 has labeled as wave "5"
The fifth wave of wave "5" appears to be an Ending Diagonal Triangle(EDT). The sharp and impulsive decline from the peak is
exactly what you would expect after an EDT.
Additionally the daily SSMI chart from early 2016 to November 2017 shows a completed Elliott five wave pattern.
If this daily structure is complete, it implies at least a .382 retracement of the bull move from early 2016 to November 2017.
The only improvement that TOMJ2417 could have made on the SSMI post is on part of the title- text book Elliott wave?
That part of the title should be - text book Elliott wave!
The SSMI has a very clear Elliott wave pattern from the daily scale down to the 15 minute level.
Again, great post TOMJ2417!
Mark
#slimstebelegger , SMI koop door chrisVOSOnly buy for index I could find for now. Price is on strong support atm.

Swiss SMI building up positive momentum?#Swiss #SMI poised for a move north up to highs early 9100's? Base around mid 8800? Support 8800 then 8700?
SSMI (Swiss Market Index) LONG setup (H1/H4)Hi, traders!
Swiss Market Index* INDEX:SSMI formed the bullish wave and appears to be ready for take off to point 6.
This potential move is being supported by RSI divergence as well as significant volume at point 5 (unfortunately not available here, but I can see it in my terminal).
It is also worth noting that internal structure of the wave is being enhanced by already completed minor bearish yellow WW.
Good luck and profitable week!

