VRX trade ideas

FDA Approves Ortho Dermatologics' ARAZLOTM (Tazarotene) Lotion, BHC: Bausch Health Companies Inc.
2019-12-19 06:59:00
FDA Approves Ortho Dermatologics' ARAZLOTM (Tazarotene) Lotion, 0.045%, For Acne Vulgaris

i45. BHCBeta-R:Journal. Risk Management: Compound .Level : PA . Time: Short-term - Intermediate . This is just my view follow if it aligns with yours. Ideas are not repeated rather updated.Worry about risk only.

Breakout In Bausch health CosEntry level $29.15, if market regains some strength
target price $35.50 = Stop loss $27.50
Golden cross is a very reliable buy signal and alerts new investors.
Stock has also been highlighted by ZAckz as atop value to stock to buy.
Average analysts price target $ 31 | Overweight
Short interest 3.4%
Company profile
Bausch Health Cos., Inc. engages in the development, manufacture, and market of a range of branded, generic and branded generic pharmaceuticals, medical devices and over-the-counter products. It operates through the following segments: The Bausch + Lomb/International, Salix, Ortho Dermatologics and Diversified Products. The Bausch + Lomb/International segment consists of the sale of pharmaceutical products, over-the-counter products, and medical devices products. The Branded Rx segment comprises of pharmaceutical products related to the Salix product portfolio; dermatological product portfolio; branded pharmaceutical products, branded generic pharmaceutical products; over-the-counter products; medical device products; Bausch + Lomb products sold in Canada; and the oncology, dentistry, and health products for women. The Salix Segment consists of sales in the U.S. of GI Products, The Ortho Dermatologics segment consists of sales in the U.S. of Ortho Dermatologics (dermatological) products and global sales of Solta medical aesthetic devices. The Diversified Products segment consists of sales in the U.S. of pharmaceutical products in the areas of neurology and certain other therapeutic classes, in the U.S. of generic products, in the U.S. of dentistry products. The company was founded on March 29, 1994 and is headquartered in Laval, Canada.

Shorting opportunity with 2 head an shoulders!
On the Daily chart the rsi has a bearish divergence on both previous peaks indicating that the bulls are losing steam. On top of that the rsi even forms a head and shoulders aswell .
38.4 seems to have been an historical resistance in the summer of 2016.
However, judging from the MACD I don't think there is enough momentum to push it down through 36.6 this coming week,
so I believe the price action may form a head and shoulders and then with a more favorable MACD to provide the right time to short , especially if the RSI crosses the 50 EMA
I may miss the opportunity to short by waiting for the right shoulder to form but owell. a 1.5 risk to reward scenario
Feed back welcomed!

BHC - Quick pullbackBased on current set-up and price resistance, I'm looking for BHC to test its 20day EMA before heading northward
Trade:
ITM 27.50 Ps
If crosses 10 d EMA
Target 20 d EMA ~26.40

COMPRA PUT EN 1.21$ A 28$ CON ACCION EN PRECIO 28.43$ VENCIMIECOMPRA PUT EN 1.21$ A 28$
CON ACCION EN PRECIO 28.43$
VENCIMIENTO 2 MESES
ENERO 17 2020
...


Elliott Wave View: An Impulsive Rally in Bausch Health (BHC)Elliott Wave View in Bausch Health (BHC) suggests the rally from June 4 low (20.28) unfolded as a 5 waves impulse Elliott Wave structure. Up from 20.28, wave (1) ended at 21.9 and wave (2) pullback ended at 20.8. The stock then resumes the rally higher in wave (3) towards 25.85, and wave (4) pullback ended at 24.61. Finally, the stock ended wave (5) of ((1)) at 25.9.
The stock is now correcting cycle from June 4 low within wave ((2)). Wave ((2)) pullback should unfold in the sequence of 3, 7, or 11 swing. The current pullback is proposed to unfold as a double zigzag Elliott Wave structure. Down from 25.9, wave (A) ended at 24.64 as a diagonal structure. Expect a bounce in wave (B) then another leg lower in wave (C) as another 5 waves before wave ((2)) pullback is complete. We don’t like selling the stock and expect dips to continue finding support in 3, 7, or 11 swing as far as pivot at June 4 low (20.28) stays intact.


Example of a false golden crosstechincally 50 may cross above, with both MAs pointing downward. Large bear flag on the weekly chart. $XLV $STUDY


$BHC weekly just a healthy correction to supportAfter a good earning announcement BHC corrected lower into the broadening bottom support zone. Look for the increased buying pressure from here


$BHC LONG WITH UPCOMING PDFUA DATE AND THEN EARNINGS.CHECK THE CHART NOTES. CHECK THE CUP - NICE VOL TOO.

$BHC is coming back up with strength Resistence 28$BHC is coming back up with strength Resistence 28

$BHC is coming back up with strengthBHC is showing strength. Let's see if it crosses 28 resistance this time.

Watch Consolidation Breakout in BHC.TOWatching for a consolidation breakout in Bausch.
With the market downturn, I haven't taken many long trades lately. But this one popped up on the screener the other day. It is consolidation near a recent high. Prior patterns like this have seen the price run higher... if it breaks the consolidation to the upside.
Expected profit is roughly 20%, while downside risk is about 5% (4:1 reward:risk).
Disclosure: Not long yet. Want to see a break higher, out of the consolidation, preferably on a high volume day.

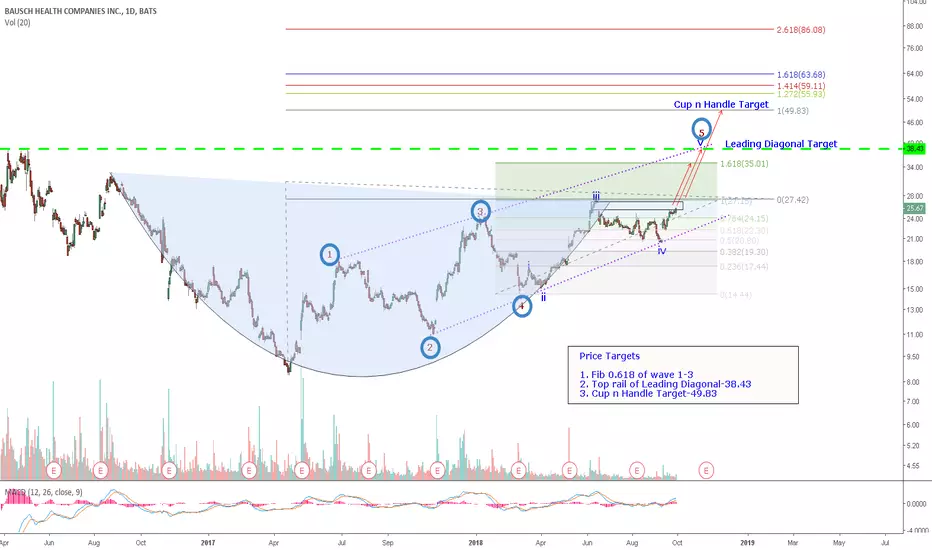
BHC (Formerly VRX) has printed a long-term CnH and a Leading Diagonal. This Chart shows the three possible targets starting from the Fib 0.618 extension of wave 1-3, to the Top Rail of the Leading Diagonal , to the Target of the Cup n Handle. Please DYODD. I am holding Oct 19 $24 Calls which are currently over 100% up.
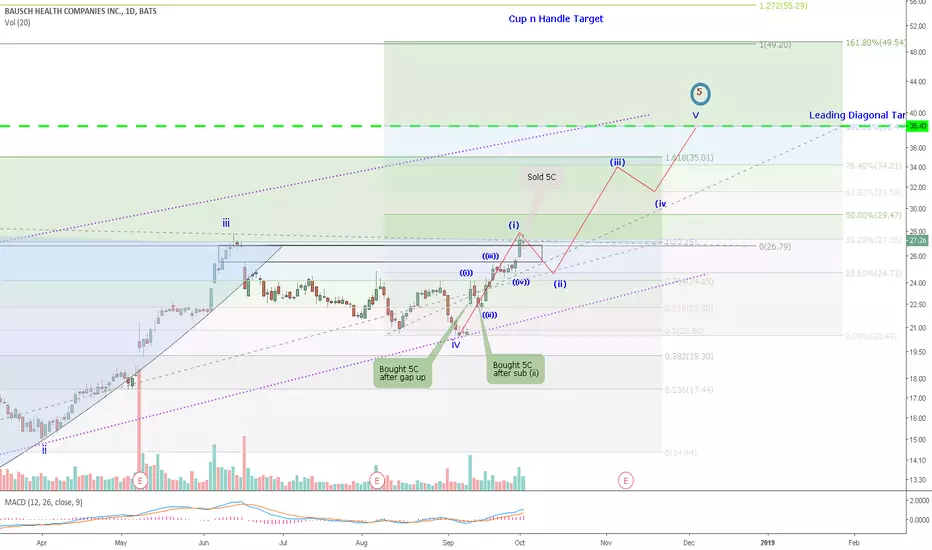
BHC-Using this as an illustration of my Swing Trade Strategy using EWT. EWT is great with counting the waves. To benefit from an accurate count, one must know how to use the wave count. I have used the EW as a tool to help me with my swing trading. I endeavor to buy calls at the end of wave 2 &4 (or beginning of wave 1,3&5) and exit my positions (take profits at the end of wave 1,3,&5 (or beginning of wave 2&4). I have been exceedingly successful with BHC. Of course those who have been following my BHC chart (formerly VRX) knows that I have charted a leading diagonal. Looking at this chart, there is a lot of room to run. For those who are interested in getting in, look for the wave 2 correction to end before getting in. Of course, if you are into shorting, this is probably the right time to buy puts. All the best.
BHC.TO Recent Long TriggerBHC recently broke out of a consolidation after putting in a rounded bottom. This pattern has played out three times over the last year, moving about 20%+ over the former high. This trade takes advantage of that same pattern with a target just under 20% away from the entry and a reward:risk of about 3.5:1.
Disclosure: long

BHC (Formerly VRX) poised to fill gap. Targets revised Wave 3 targets slightly revised to match Fib 1.618
