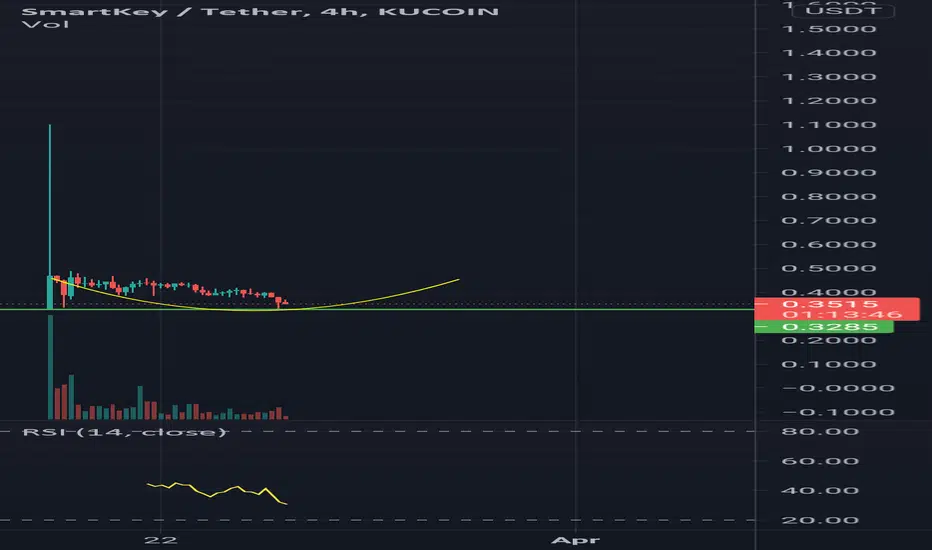
SmartKey: Simple Signals & 2263% Growth PotentialSee how here we reveal a chart bias. While the upper range of the consolidation range —in blue— to the right side gets broken, the lower range, support, continues to hold long-term. The bias is revealed as prices start to move higher and support also starts to rise. Higher lows and higher highs.
There is no major bullish phase yet but the chart bias is bullish and pointing up. This is my translation of the candles and action shown on this chart. SKEYUSDT.
Now that we determined where the next major move is going, we only need to define our targets. How far up can it go?
The first target can be generalized as the reversal of the bear-market. This amounts to a target around 0.48840 or a 1400% growth potential. Back to long-term baseline.
Then we can use other methods such as the Trend-Based Fib Extension to get more numbers beyond the base. This is what you see on the chart.
This is a simple analysis based on simple signals.
Thank you for reading.
Namaste.
SKEYUSDT trade ideas

Skeyusdt buy opportunitySKEYUSDT is showing a potential rounding bottom reversal pattern, with the price recently rejecting the neckline and pulling back towards the bottom area, followed by a strong bounce.
This action suggests that the bottom may be in. We plan to re-accumulate in the highlighted area, which is expected to act as a strong demand zone. The targets are detailed on the chart.
Share your thoughts on this coin with us in the comments.
Thanks!

SKEY LONG -> 12 centsElliot’s wave 3 reaches often 2.618 x wave 1 (as in this scenario).
Elliot’s wave 4 is often a triangle, so it seems we started Elliot’s wave 5 with possible range to 0.12 USD (1.61 x wave 4 or 4.236 x wave 1).
(Alternatively, we started wave 3 - but it does not change the rest of analysis)

SKEY LONG -> 12 centsElliot wave 4 is often a triangle, so it seems we started Elliot wave 5 with possible range to 0.12 USD.
(Alternatively, we started wave 3 - but it not changes the rest of analysis)

SKEYUSDT Possible LongSKEY is building up momentum under this resistance (neckline). A breakout here will send to 0.07 - 0.089 level. Keeping a close tab.


SKEY/USDT possible short term playSKEY nice pennant formed with a retest. IF momentum stays in SKEY favour with the BitMart listing short term price target .4+ easily can be achieved

Don't let the whales trick youNIce falling wedge, only buy this if a support resistance flip is confirmed, otherwise it will fall into re-accumulation

can we see explosion after this?after strugling in 0.1 % 0.15 zone the price is trying to move up.
this leading diagonal could be start of 5 wave impluse.


Jedyna droga dla #skeyI think this scenario has a lot of potential because #skey will go up faster than down.
-The downward trend has been broken.
-If it overcomes resistance, 40% gain to be realized for the less patient.
PS. There is nowhere to fall.