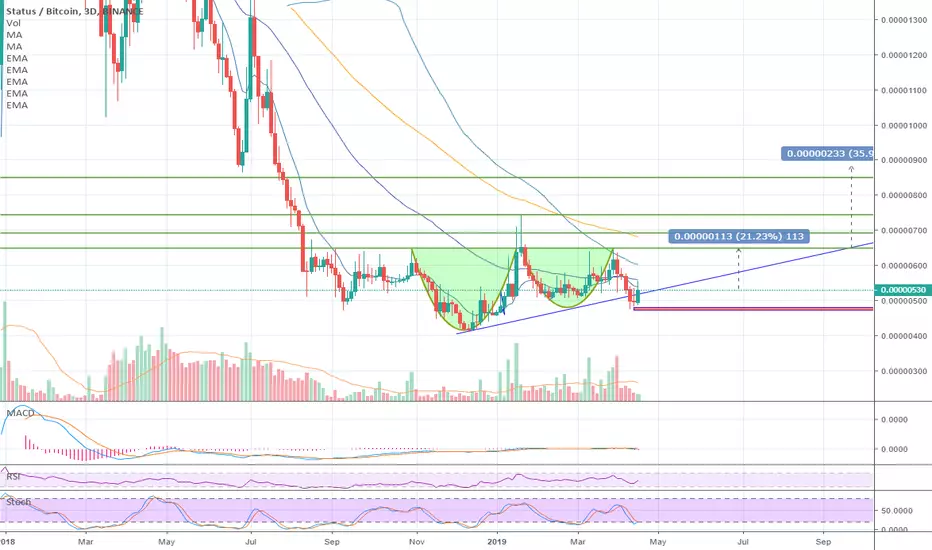
SNT/BTC BREAK OUT CONFIRMEDFirst target is the dotted line, I believe SNT will move beyond it this time. My main targets are 854 and 1159 satoshis.
SNTBTC trade ideas

SNT - Good potential with good R/RI expect good profits from it.
Buy now
Targets
420
500
620
Stop loss 340


SNT - Great BuyHi traders
as you can see first divergence changed drive lines angle now second divergence is going to happen ( Triple ) , It really great opportunity cause it will break trend line this time
best wishes for your trades


$SNT Reaching ATL BTC support... $SNT Reaching ATL BTC support... Last iteration with this level was good with a movement of 60%+...
These days market is VERY unstable.. entering any position has another layer of risk due to BTC status..
Make sure to set up SL & Short targets if you are taking a position.
#SNT

SNT time is up.This chart reinstates a pretty obvious fact. The bears better join bulls after we close the weekly above 650 sat area. After, it will be unstoppable.

Daily Bullish Signal $SNT #SNT #SNTBTC #BTC $BTC (23 April)RED ARROW indicates the EXPECTED Time and Targets
Level Stoploss point up to maximize profit and reduce risk
I'm working all the time, even in Bearish Market
======================
My path doesn't seem like anyone. I'm like a MONK, always studying to find the direction that prices will follow. I will feel very comfortable if the price goes exactly in the direction I drew. I will always try and practice until PERFECTION is MY OWN


SNT - Nice looking ascending triangle on 3DThis is a nice looking play in which I like to gamble. 3D chart and 1W charts are currently building
an Ascending Triangle. I would be watching for SNT to re-enter this triangle, and continue on upwards
slowly until reaching the top line. The speed of this ascent being either slow or fast will dictact I think
the direction we go when we get to the apex of the triangle. I will want to see a break out and then
a healthy retrace to the support before continuing on to the target of the triangle.
I will be watching for a breakdown below the red rectangle and re-asses there.
SNT - 1W support chart for other ideaSNT - 1W support chart for other idea.
Status Network Token is looking like a nice mid to long hold here.
I will be watching for any breakdown and re-assessing.

SNTBTC giving a buying opportunity again by completing gartley.The SNTBTC has completed the gartley pattern and entered in PRZ area to hit the sell targets soon insha Allah.
The targets are:
Buy between: 0.00000480 to 0.00000536
Sell between: 0.00000580 to 0.00000686
Regards,
Atif Akbar (moon333)

SNT bouncing between weekly and daily levelsThis is a good scalping opportunity as SNT bounces between the daily(red) and weekly(purple) trend lines.

SNTBTCNeed to break : 0.00000711
if Yes :
buy at 0.00000711
sell at :
level 1 : 0.00001014
level 2 : 0.00001310
level 2 : 0.00001614
Else : no buy

$SNT Volume increasing... Potential Ascending triangle$SNT Volume increasing... Potential Ascending triangle as continuation of the breakout..
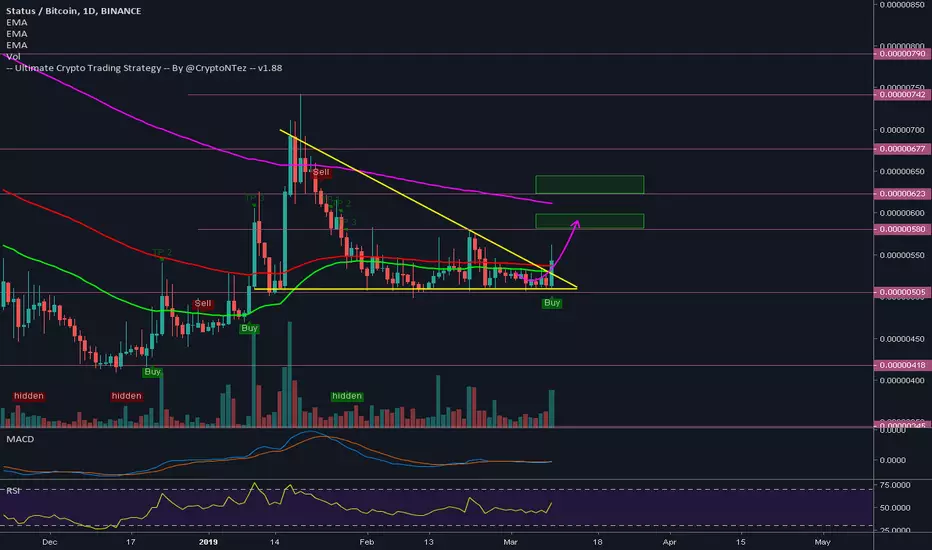
UCTS Buy signal active on the 1D
Crossing over EMA200 (rejected many times), EMA50/100 as support
MACD about to bullcross, RSI Rising + bullish divs
1st & 2nd target on the chart
#SNT


Breaking from current descending triangle to the upside. $SNT Breaking from current descending triangle to the upside.
Showing an increase in volume.
UCTS showing a buy on the daily.
MACD bull cross and RSI rising.
Currently trying to break above EMA50/EMA100. #SNT happy trading!


Status Network Token Prints High Volume (Already In Profit)Status Network Token (SNTBTC) is another altcoin that is starting to move.
We already have an active trade in profits for this one, you can find it here (we are looking at 35%+ profits already):
But I wanted to do a quick analysis on this chart for you, as there is lots of room left available for growth, so here are the signals:
We can see a recent break above EMA10, EMA50, and EMA100, which is really bullish supported by big volume.
We can clearly see an increase in green volume, a significant increase. This is really bullish and supports the recent break above resistance.
Last time SNTBTC broke above resistance without good volume supporting it (marked blue circle), it quickly fell back down.
So we have the high volume breakout and a follow up with the next day candle which is green.
The MACD is entering the bullish zone, and the RSI is strong and trading above all resistance.
Status Network Token is set up to generate some good gains in the coming weeks, but things can change...
Conditions for change: If SNTBTC loses momentums, breaks down and closes below support (EMA10, 50 and EMA100), then the above signals are invalidated and a new analysis is needed.
SNTBTC is now bullish and additional bullish action is expected.
Feel free to hit like if you were entertained or learned something by the content of this post. Or simple hit like to show your support.
Thanks a lot for reading.
Namaste.
