SNXBTC - Long if successful retestLong if successful retest - 38.2 Fibs and Retest of the bullish channel
SNXBTC trade ideas

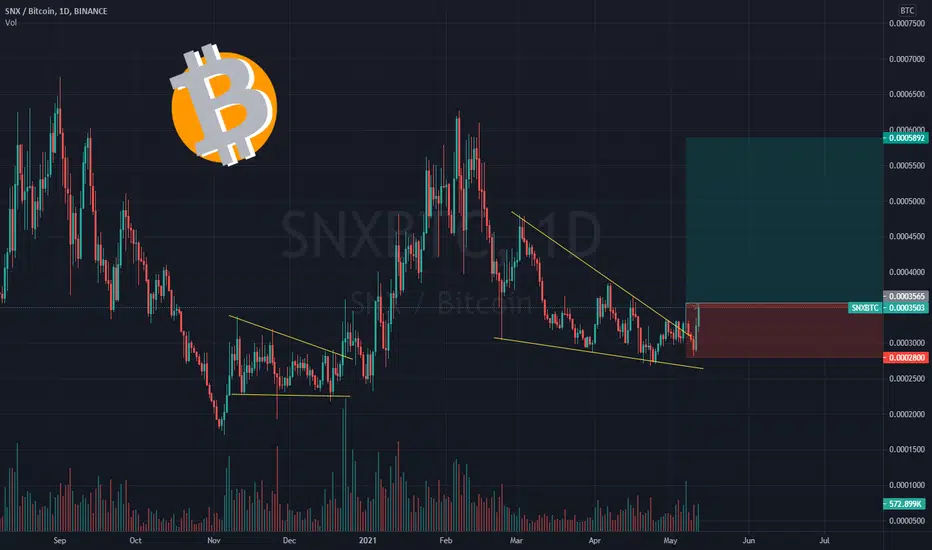
SNXBTC/SNXUSDT Long setup. Double your BTCthe pattern say's so, SL if drop below respected support trendline

#SNXBTC [ SYNTHETIX ]#SNXBTC
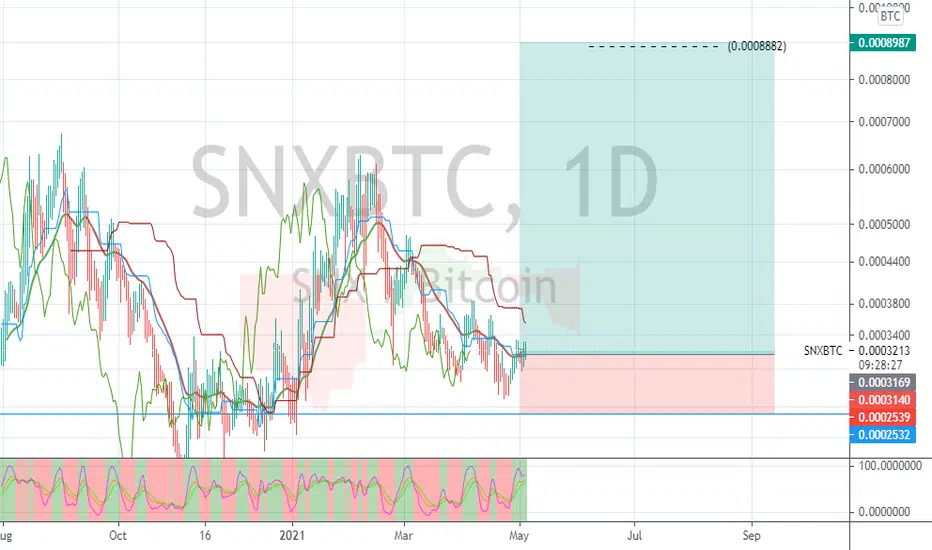
I'm Bullish on it, I see several bullish patterns on its charts (1D, 4H):
Golden Cross Trend Reversal Super Trend Bollinger Breakout

SNXBTC SNXUSD SNXDepending on if BTC Decides to range sideways more, shoot to the moon or head to the core of the earth, SNX looks Really interesting to me here! Alot of Volume under and alot of volume overhead to get through. Has broke the .618 and .66 speed fan and is trying to remain about the .382


SNX is about to dig a hole...The setup is looking really bearish against BTC.
Only Long argument would be that the breakout haven't happened with volume.
If I were to take a position, I would put a sell order just below the support in order to avoid going in on a potential fakeout.


SNX / BTC Mid Term SetupDropping In Demand Zone around 25000 Sats
Can be good to start accumulation here until 20000 sats
Mid Time Frame Setup with 1st Target at 34500 Sats

Synthetix Network Token SNXBTC 💪I may have come late to the party as so many have been shilling SNX last week. But I am here after a confirmation of both high volume, and a breakout on the 3d 50 EMA chart.
My entry is marked in blue.
And my conservative target is set in green.
I know a longer timeframe marks 100% gains, but at this stage of BTC drama I'd rather be extra cautious. What is yours?

Crypto|SNX/BTC|LongLong SNX/BTC
Activation of the transaction only when the blue zone is fixed/broken.
The author recommends the use of anchoring fixed the blue zone, this variation is less risky.
If there is increased volatility in the market and the price is held for more than 2-3 minutes behind the activation zone after the breakdown, then the activation of the idea occurs at the prices behind the activation zone.
The idea is to work out the resistance level .
* Possible closing of a trade before reaching the take/stop zone. The author can close the deal for subjective reasons, this does not completely cancel the idea and is not a call to the same action, you can continue working out the idea according to your data, but without the support of the author.
+ Maybe right now we will go even lower, then it's okay, the idea is not activated and simply canceled.
+ ! - zone highlighted by the ellipse is a zone of increased resistance, in this area there is a possible reversal for a correction, please take this factor into account in this transaction.
The "forecast" tool is used for more noticeable display of % (for the place of the usual % scale) of the price change, I do not put the date and time of the transaction, only %.
Blue zones - activation zones.
Green zones - take zones.
Red zone - stop zone.
Working out the stop when the price returns to the level after activation + fixing in the red zone.
Orange arrow - the direction of take.
The red arrow - the direction of the stop.
SUM PNL: This parameter displays the total % of all closed ideas of the "new" format (according to the author) for this sector at the time of publication of the idea. The calculation is very "clumsy" just the sum of the profits of all the ideas, based on this indicator, you can more accurately assess the risks when working with my ideas of this sector. I present you the construction of the idea, you can use it yourself as you like based on your subjective view and risks, the calculation of the PNL indicator is carried out only on transactions that the author closed on TV in manual mode or by take.
P.S Please use RM (risk management) and MM (money management) if you decide to use my ideas, there will always be unprofitable ideas, this will definitely happen, the goal of the system is that there will be more profitable ideas at a distance.

SNX/BTC - BIG BULL PENANT FORMING May 8
Hey guys!
Intro:
Synthetix ( SNX ) is another one of those juicy mid cap alts that has the chance to go balistic. It is forming a bullish pennant for 245 days now and the pattern will probably take some more time to establish. You have the chance to get in very early as this evloves further. Unfortunately the Binance chart doesn't show the full price history, so I suggest to check on cointrader.pro to see the full history.
Pro:
- Sitting in a nice reload zone between the 0,618 and the 0,786 Fib at around 30.000.
- Currently tries to "cut the corner" and prepares for the third impulse up.
- Very early in the pattern --> a lot of opportunities to scale in and make solid gains
Contra:
- Still long way to brake out
- Second higher low still in the process of establishing
Entry:
Option A: Right now and you would do nothing wrong since its in the reload zone between the 0,618 and the 0,786 Fib.
Option B: Wait for the pattern to evolve further and enter at a later stage (i.e. 3 higher low)
Option C: Wait for the retest of the trendline
Option D: Scale in on all three options
Exit:
Bullish:
- Measured move price target from a potential brake out point around 5300 Sats would be 10.000 - 10.500. This would mean a 250% move from the current price point around 30.000 Sats .
Bearish:
- Once the second higher low is fully established, set your Stop-Loss below that.
Enjoy and never forget: NO FINANCIAL ADVISE! :*


SNX Buy the Break Opportunity great entry available into SNX
price sitting just above a strong resistance trend line
BTC chart is very young and has much room for growth

SNX/BTC Get it when their not talking about it.The Little Old lady is a conservative investor and trader.
Always looking for cheap prices in crypto, she starts buying at the 0.618 Fibonacci level, 0.786, and at the 0.886 level. She never invests more than 5% in any one coin, expecting to lose the investment. Positions of 0.3% or a few dollars are not uncommon.
The old lady also looks for an asset that has flattened out and is on the floor preferably without a new bottom in the price after the first bottom. This is preferable, but not mandatory. She looks for coins that have bottomed and are forming a large W pattern on the chart.
We also look for lots of volume coming into an asset. And we see the OBV is in quite a significant uptrend.
She calls her "broker" and places an order for an amount @ Ƀ 0.00003075 at the 0.618 or the 0.786 Fib level she only buys when the market comes to her, she never chasing the market. When she gets her limit order filled she placed her sell orders and forgets, every time the coin doubles, half her holdings will sell. The first double will be at At Ƀ 0.00006150 if she bought at the market price because we are technically still in the trade location/reload zone. If SNX/BTC then retraced all the way back to the 618 after its double. She can rebuy at the 0.618 retracement half of what she sold if her position in this coin is still less than 5%. She then sets her new sell orders on doubles.
If the candle goes higher she has to keep adjusting the fib tool higher as new highs are made and buy-in at the relevant levels when it retraces to the reload zone. Her investment in a coin can never be more than 5% of her overall position. Or she can look for another coin with a great market structure that has not taken of yet and in the reload zone and invest there and set new doubles.
These are my ideas only.

SNXBTCHello Dears; Another trading position that I think has very strong hands behind it and the stop trading is also shown in the picture.you can buy it in usdt but the analysis is in BTC. Good luck

💡 SNX/BTC💡 Hello everyone, if you like my idea, follow me with likes and comments, I will also try to share the best ideas with you, Always do your own research before opening positions and always put stop limit.
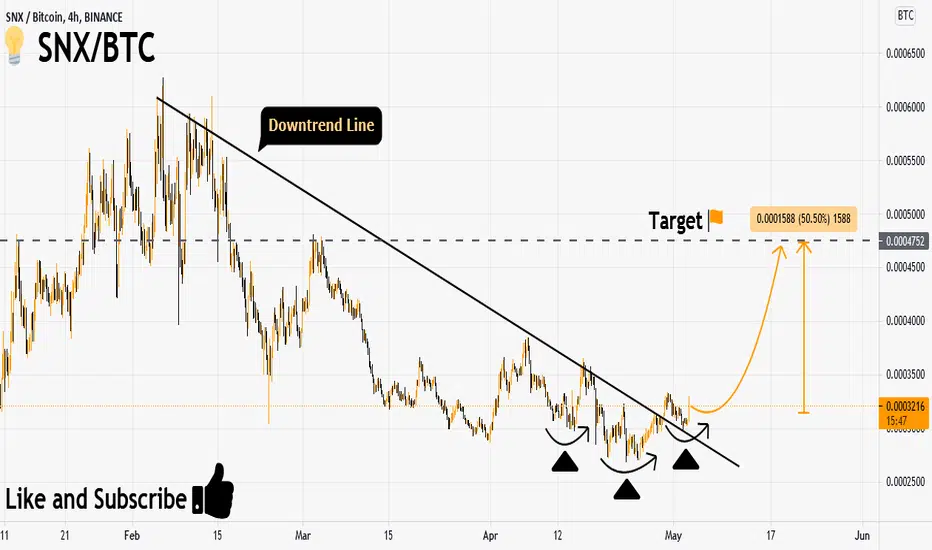

SYNTHETICS WILL BLAST a huge triangle formation in the snx/btc chart , breaking upside is more likely ,leading to a huge breakout , with a 3x from its current price

Crypto|SNX/BTC|LongLong SNX/BTC
Activation of the transaction only when the blue zone is fixed/broken.
The author recommends the use of anchoring fixed the blue zone, this variation is less risky.
If there is increased volatility in the market and the price is held for more than 2-3 minutes behind the activation zone after the breakdown, then the activation of the idea occurs at the prices behind the activation zone.
The idea is to work out the resistance level .
* Possible closing of a trade before reaching the take/stop zone. The author can close the deal for subjective reasons, this does not completely cancel the idea and is not a call to the same action, you can continue working out the idea according to your data, but without the support of the author.
+ Maybe right now we will go even lower, then it's okay, the idea is not activated and simply canceled.
+ ! - zone highlighted by the ellipse is a zone of increased resistance, in this area there is a possible reversal for a correction, please take this factor into account in this transaction.
The "forecast" tool is used for more noticeable display of % (for the place of the usual % scale) of the price change, I do not put the date and time of the transaction, only %.
Blue zones - activation zones, 2 activation zones are indicated ( A1 and A2).
Green zones - take zones.
Red zone - stop zone, 2 stop zones are indicated (A1- "L-SL1", A2-"L-SL2").
Working out the stop when the price returns to the level after activation + fixing in the red zone.
Orange arrow - the direction of take.
The red arrow - the direction of the stop.
SUM PNL: This parameter displays the total % of all closed ideas of the "new" format (according to the author) for this sector at the time of publication of the idea. The calculation is very "clumsy" just the sum of the profits of all the ideas, based on this indicator, you can more accurately assess the risks when working with my ideas of this sector. I present you the construction of the idea, you can use it yourself as you like based on your subjective view and risks, the calculation of the PNL indicator is carried out only on transactions that the author closed on TV in manual mode or by take.
P.S Please use RM (risk management) and MM (money management) if you decide to use my ideas, there will always be unprofitable ideas, this will definitely happen, the goal of the system is that there will be more profitable ideas at a distance.

