5 Crypto Investment Firms Investing in these altcoins Expect coins backed by real utility, visible treasuries, and regulated investment products to capture the bulk of the next wave.
Read More: www.cointrust.com
SOL trade ideas

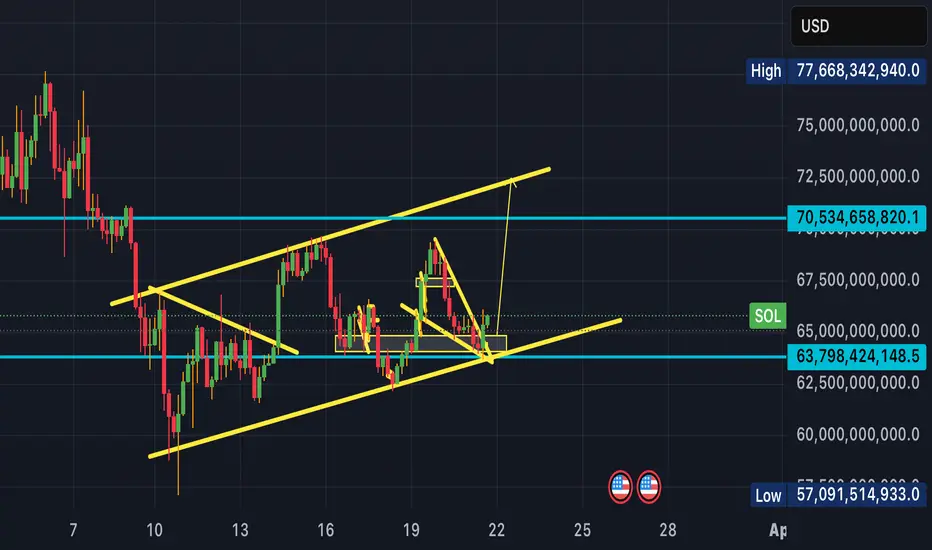
SOLANA MARKETCAP LOOKS COOKEDIs that a Head and Shoulder's top?
Is #crypto about to endure a Iron dome penetration event?

W$J Meme Index – Live Market Cap Tracker for DegensThe W$J Meme Index is a market-cap–weighted chart of the top 14 meme coins in circulation. Built by degenerates, for degenerates. This is your daily source of truth when the timeline is pure hopium.
No fluff. No TA wizardry. Just raw, unfiltered meme market data for the financially unwell.
Coins included: DOGE, SHIB, PEPE, WIF, BONK, FLOKI, BOME, MEME, MYRO, TOSHI, SPX6900, MOG, GIGA, POPCAT.
Tag it. Trade it. Cry with it.

"SOL Market Cap Breakdown Setup| Bearish Retest Targeting 83.3B"SOL Market Cap is showing signs of a potential breakdown after a series of lower highs and a bearish retest of previous support. Price is currently retesting the breakdown level. If confirmed, the next support zone is near 83.3B.
This is a technical analysis-based observation, not financial advice. Always manage risk and confirm with your own strategy before making any decisions.

$SOL / $BTC Inverse Head and Shoulders BREAKOUT!!CRYPTOCAP:SOL / CRYPTOCAP:BTC Inverse Head and Shoulders reversal pattern confirmed 🥳
PA has also reclaimed the 50DMA
Bullish Divergence on RSI
So many signs indicators aligning across the market.
IS IT REALLY TIME !!?!?

SOL Market Cap – Bearish Rejection Expected from Resistance ZoneSolana's market cap is approaching a **major resistance zone** near $77.8B, aligning with an ascending trendline. The market is showing signs of exhaustion as price nears this confluence of **horizontal and trendline resistance**.
A bearish reaction is expected from this zone, potentially forming a **lower high** and offering a short opportunity toward the demand zone around $69.6B.
🔻 **Bearish Setup Highlights:
- Resistance Zone: $75.5B – $77.8B
- Entry Idea: On bearish rejection or confirmation near resistance
- Target: $69.6B support zone
- Stop Loss: Above $77.8B (invalidate setup)
A clean retest and rejection can offer a **high-probability short**, with the risk/reward skewed favorably.

$SOL ?!Here we have CRYPTOCAP:SOL America’s top pick over CRYPTOCAP:ETH .
I smell a bullish reversal and it seems like this time could be a lot different maybe because of volume and volatility… who knows ?

solana bullish biasafter the recent tariff wars , which mostly began in america , most asset classes plumeted, so my anticipation is that solana will pick up an upward trajectory from the key zones i have highlited.

$SOL Here we have CRYPTOCAP:SOL ,a very famous coin for American investors who trade meme coins etc.
People around the world are also trading meme coins on Salona . Salona is not only good for meme coins but great for tokenization in general. The banks have their own system of tokenization for their transactions and so. What’s your thoughts? Like comment below 👇
SOLANA and Elliott Wave.Marked in Blue is the Main Wave. This wave expressed itself in 5 Waves. Though incomplete at the moment, we can see that Wave 4 is completed and a lunge to the upside would complete Wave 5(Red), hence Wave 3(Blue) of the Main Wave. After 3(Blue) is complete, a Wave A would begin for the Flat as a Wave 4(Blue). How do I know it would be a Flat? Because Wave 2(Blue) was a Zigzag.

Solana Bird's eye viewSolana to me is showing basic high volume crypto chart patterns, to be just a bunch of breaks and retest with easy r:r, pump.fun and these crazy kinda criminal events happening onchain non the less id say much higher but thats just in due time

Decision time for SOL/ETH!Many are bullish on Solana and many are bearish on Ethereum. I think many people will be surprised if SOL/ETH is going to crash (despite the SOL memo hype). The graph speaks for itself. There is also a bearish RSI divergence.

$SOL longCRYPTOCAP:SOL will move to its next point of resistance, in around 13%. If it breaks that we'll go up another 17%. Falling wedge has been formed. It's gonna take off.

$SOL 13% - 30% upside, Long We've hit support, and price bounced, next resistance level is after price goes up 13%, if we break this we have another 17% to go untill next resistance level. Long on $SOL. Happy investing!

Solana: Speed and power, every crypto hour!Solana has emerged as a prominent player in the cryptocurrency space, experiencing notable growth and adoption due to its combination of innovative technology and user-centric features. Here’s why Solana is performing well in the crypto market:
High Transaction Throughput: Solana's blockchain is designed to handle thousands of transactions per second (TPS) with minimal latency. This high throughput is a result of its unique Proof-of-History (PoH) consensus mechanism, which allows transactions to be processed more efficiently compared to traditional blockchains like Ethereum.
Low Transaction Costs: Solana offers significantly lower transaction fees compared to many other blockchains, making it an attractive platform for developers and users, especially in areas like decentralized finance (DeFi) and non-fungible tokens (NFTs).
Developer-Friendly Ecosystem: Solana has invested heavily in building a robust and scalable infrastructure, which has attracted a growing number of developers. Its ecosystem supports a wide range of decentralized applications (dApps) and projects, fostering innovation and community growth.
Strong Backing and Partnerships: Solana has received support from influential investors and has formed strategic partnerships with leading companies in the blockchain and tech industries. This backing has boosted its credibility and adoption.
Vibrant NFT and DeFi Ecosystems: Solana has become a hub for NFT marketplaces and DeFi protocols due to its low fees and high speed. Projects like Magic Eden and Serum have contributed to its ecosystem's growth and popularity.
Focus on Scalability and Innovation: Unlike some blockchains that face scalability issues, Solana's architecture is designed for mass adoption. It continues to prioritize technological advancements, ensuring that it can handle increasing demand without sacrificing performance.
Community and Marketing Efforts: Solana has built a strong, engaged community and implemented effective marketing strategies. Its branding as a fast and affordable blockchain resonates well with both individual users and institutional players.
Real-World Use Cases: With a diverse range of use cases, including gaming, decentralized finance, and NFTs, Solana is proving its utility in real-world applications, driving its demand and adoption.
By addressing critical challenges like scalability, speed, and cost, Solana positions itself as a leading blockchain platform capable of supporting the next generation of decentralized applications and crypto innovations. This combination of technical prowess and strategic execution is why Solana continues to thrive in the competitive crypto landscape.

SOL ChartHey,
I've shared many similar zones now such as TOTAL3..
SOL is similar but looking sooo good for a large market cap.
Due to this clean demand area being respected...
And other projects looking similar...
New ATH's is what I see.
Long-term even 200B, but that is long-term.
New highs first, soon.
Kind regards,
Max Nieveld

Everyone Should Know This: Supports and Resistence!Support and resistance levels are key concepts that help investors navigate price movements. These levels are psychological and technical markers where a coin's price tends to slow down, reverse, or consolidate. Understanding them can make the difference between a successful trade and a missed opportunity.
What Are Supports and Resistances?
Support is a price level where demand for a cryptocurrency is strong enough to prevent further decline. Think of it as a floor where prices “bounce” upward.
Resistance is the opposite— a ceiling where selling pressure prevents the price from rising further.
These levels form due to the collective actions of traders. At support levels, buyers feel the price is low enough to enter the market. At resistance levels, sellers believe the price is high enough to secure profits.
Why Don’t They Last Forever?
Support and resistance levels are not permanent because market conditions, sentiment, and external factors are constantly changing.
These shifts happen because of supply and demand imbalances or significant events, such as news about regulations, technological upgrades, or changes in market sentiment.
Avoiding the Trap of Greed
Many traders make the mistake of placing their buy or sell orders right at these levels, aiming for maximum gain. However, this approach can be risky:
Support and resistance levels are zones, not fixed lines. A coin’s price might come close but not touch your order before reversing.
Missed opportunities: Waiting for the “perfect” entry point might result in missing a profitable trade by a few cents.
A wiser strategy is to avoid being too greedy:
Place buy orders slightly above support and sell orders slightly below resistance to improve the likelihood of execution.
The Big Picture
Support and resistance levels are tools—not guarantees. Successful traders view them as part of a broader strategy.

Solana Sol usdt Daily analysis
Time frame 4hours
Risk rewards ratio =2 👈👌
2 strong resistance ( red boxes you can see in the chart) didn't permit Solana to continue its good growth
Here is a good situation to enter
Close to support lines helps us to have a 200% benefit

SOL to Heaven ! $800-1200 AheadIn my opinion SOLANA this year is the same ETH back in 2021 !
Best Layer-1 Blockchain Highly Adopted , Fast ! Cheap and easy to use and develope !
Technically it is breaking a heavy resistance level at $220 after a break it can reach to $300 sooner than you think !
Wait and see !
And Always DYOR !

Long SOL, MCAP breaking ATH What's up traders, investors, hodlrs
I am just reviewing the Market cap of some alts and holy cow. I have always known that SOL has institutional money since its inception and understood the potential...
But $108 B Market cap? Who would have thought we would be reaching these levels?
It is still climbing too. From my perspective, I believe this bull run has more to go.
Where are we to reach from here? Does SOL (long term) have the potential to even be in the $500B Mcap? Ultimately, MIL:1T ? With adoption, if it continues at this rate, it is feasible.
At those levels (it would not happen overnight) this is longer term adoption, price would be estimated at $1045, and $2090 levels.
I am a bit mind-blown if I must say. I will be monitoring SOL mainly from the perspective of Market cap, as I feel it shows SOL is here to stay and is adopting and taking its' share in the space respectively.
Just as a quick comparison, CRYPTOCAP:DOT , which is still a great project is reaching previous Market cap highs is still only $14-15B. Quite incredible when you compare the two.
There is no possible way that it would have a similar run (exponentially as it did around initial launch) but it does seem feasible for it to break out for another leg, extending through the $120B levels first. We are not far from it as we speak.
Anyway, TL;DR - CRYPTOCAP:SOL is breaking Mcap all-time highs and looks like there could be more of a run. (We project this run has the potential to run into March-June '25)
Moral of the story, we are VERY bullish on SOL.
stay disciplined, focus, spend time with the people you love.
namaste
Trade in Motions

SOL/USD: Key Levels & Trading Strategies with ConfirmationAlexGoldHunter Analysis of Solana (SOL) on a 1-hour Timeframe
Current Market Structure
Break of Structure (BOS): Significant changes in trend are indicated by BOS.
Change of Character (CHoCH): Suggests a potential trend reversal or continuation.
Fair Value Gap (FVG) and New Gap (NG): Highlight areas where the price may return to fill gaps, acting as potential support or resistance.
Fibonacci Retracement Levels:
Key Fibonacci levels are used to identify potential support and resistance areas:
0.382: 113.73
0.5: 112.37
0.618: 110.86
0.705: 109.79
0.786: 108.75
The 0.5 and 0.618 levels are particularly noteworthy as they often act as strong support or resistance zones.
Volume Profile:
The Volume Profile on the right side of the chart shows the traded volume at different price levels.
Higher volume areas indicate strong support or resistance zones.
The highest volume node around the 115 level suggests a significant resistance area.
Indicators:
Relative Strength Index (RSI): Currently at 53.84, indicating neutral market conditions.
MACD (Moving Average Convergence Divergence): The MACD lines are close to each other, suggesting a potential crossover which could indicate a change in trend.
Buy Strategy with Confirmation:
Price Action: Look for a bullish CHoCH or BOS, indicating a potential upward trend.
RSI Confirmation: RSI should be above 50 and ideally moving upwards.
MACD Confirmation: MACD line crossing above the signal line, with a positive histogram.
Volume Confirmation: Increasing volume on bullish candlesticks.
Entry Point: Enter a buy position if the price breaks above the resistance level at 114.9 with strong volume.
Stop Loss: Place a stop loss below the recent swing low at 110.86.
Take Profit: Set a take profit at the next resistance level around 116, or use a trailing stop to lock in profits as the price moves in your favor.
Sell Strategy with Confirmation:
Price Action: Look for a bearish CHoCH or BOS, indicating a potential downward trend.
RSI Confirmation: RSI should be below 50 and ideally moving downwards.
MACD Confirmation: MACD line crossing below the signal line, with a negative histogram.
Volume Confirmation: Increasing volume on bearish candlesticks.
Entry Point: Enter a sell position if the price breaks below the support level at 112.37 with strong volume.
Stop Loss: Place a stop loss above the recent swing high at 115.03.
Take Profit: Set a take profit at the next support level around 109.79, or use a trailing stop to lock in profits as the price moves in your favor.
Conclusion:
This analysis provides a comprehensive view of the current market conditions for SOL and suggests potential buy and sell strategies based on technical indicators and price action. Keeping an eye on key Fibonacci levels, volume profile, and market structure changes can help in making informed trading decisions.
If you have any further questions or need additional analysis, feel free to ask! Happy trading! 🚀✨

SOL/BTC CUP&HANDLEThere is a huge cup&handle pattern at SOL/BTC chart. I am waiting for the break of it to upside to long SOL.

Solana has made a new ATH (market cap). What's next?In crypto trading, most traders focus on price, but this approach can be misleading—especially since most coins and tokens, except Bitcoin (BTC), are inflationary.
In my view, market capitalization (market cap) is a more critical metric and should play a significant role in our analysis.
For Solana, recent optimism in the market pushed its market cap to an all-time high above $100 billion, and now it is undergoing a normal correction.
Technically, support for Solana's market cap is around $90 billion; if it holds above this level, bulls can anticipate continued growth and potentially a new ATH in both market cap and price, possibly reaching around $150 billion.
However, if Solana cannot maintain support above $90 billion, it may signal that the project’s perceived value is lower, leading to a potential decline.
In this scenario, we could see support levels at $75 billion, followed by $60 billion. Corresponding price levels might drop to around $160, then $120.
