SOL trade ideas

SOLANA 80% Up potential ?SOLANA 80% Up potential ? Cup & Handle pattern + Above the average line 150 + After BITCOIN fourth crossing event. Only an idea and not a recommendation for trading!

SOL and meme coins alt cryptos look on the ups After a slight downtrend we should see a decant gap up in the sector unless otherwoiswe DYOR NFA
Mid/Long

#SOL #BTC and others DAILYanalysis of SOLANA #BTC & OTHERS Daily CHART
have been keeping an eye on the movement on the crypto market, we see the market gapping up a bit or at least running sideways into the week.

Accumulation FractalNot to be mistaken for distribution, this has been seen before. Market cap is settling into a new accumulation base for upward continuation leg.

just found a open gap on solona MCP chart!if you open the chart of solona market cap daily one on tradingview you will notice tree gabs
two of them were field previously in 2020. i believe it will eventually be field sooner then later.
but i could be wrong.

SOLANA to FLIP ETHEREUM scenarioThis is the market cap of SOL divided by the market cap of ETH
It's important to look at the m-cap charts since the circulating of these coins are constantly changing.
Sol to flip Eth is a good bull market narrative that probably WON'T happen --- but could be still be very profitable.
The gap could close to where the pundits will start very talking about it. (This should be a take profit / topping signal when this noise becomes too loud)
As you can see. in the chart Solana has broken out of a ratio range
and appears to be setting up for an aggressive move after some more pressure being built up in that upward sloping channel.
Again this just a scenario that seems to be playing out .
No guarantees
watch and observe
look for good entries
no need to go all in
BUt having exsposure would not hurt.
I shared very early in the cycle that Solana would outperform ETH by multiples...
which has come to pass ... this would be the euphoric phase of the cycle where significant Hot and new money could pour into that particular #Blockchain casino.

Solana / SOL - Market Cap - Idea IHey guys,
Yearly closed bullish above 50%
3M = Inside Bar - lower volatility
closes bearish but still above major support lines.
-> Bullish?
1M: Inside Bar in a Triangular Formation - we are in a Neutral Market right now.
-> looking to go long from the lower end and short from the upper end of the triangle.
3D: There seems to be a bullish Setup in place on the monthly and the 3D Signal could be fired soon -> trendline must be broken, I prefer to see a retest of it before considering a long position as we might see another wash out. I will use a trading system to enter.
Thanks for reading…

$SOL $BTC #SOL #BTC CRYPTO FORE FATHERS
analysis of sol, btc, & various other crypto tickers
good luck be safe.

SOL/OTHERS Chart is MIND-BLOWINGSolana has destroyed the cumulative performance of every Altcoin by 627% since Christmas 2022.
All you had to do was buy CRYPTOCAP:SOL and chill bruh

Solana and the predictabilitySolana seems to be a pretty predictable as price moves down the bottom indicator the top usually declines with it, and if price inclines volume inclines.
This indicator measure the difference between two moving averages similar to a macd histogram. As the two moving averages become closer then the indicator retract back to its average obviously is the fast is below and a long way from its slowing average it deviates far below its average into the red. Vice versa if it where bullish. As trends loose momentum the faster deviates from its slower moving average less with each push up. Which is what you can see happening currently. If the trend where to be gaining momentum then we would see higher highs and lower lows.
Currents something out of the ordinary is happening with Solana and i can only pinpoint on other time that Volume was inclining whilst price was declining and that was previously at the high off the last bull run for a very brief moment before volume decline with price. This could mean that with volume increasing and price declining that the buyers are taking profits as the increase in volume is not supported by price action.
Find it odd as other crypto and equites usually have a drop in volume at the end of a trend then a increase in volume. I am sure on other timeframes it might be observed but on the three day it seem to decline with price action.
Made this into a IDEA as you can observer how its moving averages of volume interreact with the moving averages of price action.
Also to note usually a divergence is quite obvious before a increase in price so i will keep this idea updated.
Any break of the current trend exhaustion would be quite bullish for Solana. This normally happens at the end of a bear market.
Will not show lines drawn. By a break in the trendline i refer to the picture below

Bullish reversal pattern spotted on Sol Market Capusing Harmonics tool bullish reversal is seen on sol Market cap. price is way higher than possible entry


Using the Pink Moon as a target for the next runThis particular SOL chart tests out the moon phases. In this particular instance, we are anticipating the Pink Moon (April 23rd) will be when SOL takes off on its run.

SOLUSDT Bullish trendSOLUSDT is showing bullish trend and it is printing HH and HL.
Piercing pattern can be seen at HL.

$SOL Market Cap Long to $500B - '21 $ETH vs '24 $SOL2021 CRYPTOCAP:ETH
VS
2024 CRYPTOCAP:SOL
from: 10B Market Cap
to: 500B Market Cap
enjoy the ride, the cycle is young ✨
#SOLANA ⚡️
--- this is a study on fractals and market cycles. I have studied this '20-'21 ETH fractal in comparison with the '23-'24 CRYPTOCAP:SOL chart in great depth going back 2 years to when SOL was $8.
---REFERENCE my prior publishings to learn more. links to some of them are BELOW! GL HF NFA <3
TLDR - CRYPTOCAP:SOL is going to give CRYPTOCAP:ETH a run for its money. Enjoy the show. Been in since $8 and still just as bullish as before.
-@CryptoCurb

XAUUSD - Interim Strat For Trading Crypto PairsGreetings and salutations!
I just want to share a strat I am deploying concurrently with my XAUUSD trading.
Not sure if your aware there is new crypto trend taking place, one that entails the minting of crypto token pairs, that meets a fantastic criteria of low risk, high yield results.
The reason for this most amicable market condition are as follows,
Advantages
1.You see who is trading and how much
2. Graph only goes up with buy tickets, and down with sell tickets
(No Margin _ Just like the good ole days at the start of stock market)
3. Can start with as little money or as much as you want.
Disadvantage
1. Owners of coin can pull the coin out from underneath everyone.
2. Very very very low commissions that hardly require consideration in trade
3. Several layers of transferring from crypto to bank account
I implore you to discover this simple crypto strat, and leverage it as part of your own strat.
The indicated tokens; Hunter Biden's Laptop LAPTOP/SOL & Elmer FUDD FUDD/SOL
are traded via Jupiter exchange, at Dex Screener.
There are thousands of pairs, new pairs daily, and the PnL ratio is very sweet.
The two tokens as indicated I am trading because I have insight into the owners personally and they are making waves in the political/crypto world which is quickly engulfing the mainstream public.
Easy money, low input/ high output easy to liquidate strat. Comment for details.
Good Luck out there!
And yes still holding short from 2015! LOL

SOL.X in +3.52% UptrendSOL.X in +3.52% Uptrend, growing for three consecutive days on February 02, 2024
Moving higher for three straight days is viewed as a bullish sign. Keep an eye on this stock for future growth. Considering data from situations where SOL.X advanced for three days, in 243 of 335 cases, the price rose further within the following month. The odds of a continued upward trend are 73%.
Price Prediction Chart
Technical Analysis (Indicators)
Bullish Trend Analysis
The Momentum Indicator moved above the 0 level on January 28, 2024. You may want to consider a long position or call options on SOL.X as a result. In 71 of 108 past instances where the momentum indicator moved above 0, the stock continued to climb. The odds of a continued upward trend are 66%.
The Moving Average Convergence Divergence (MACD) for SOL.X just turned positive on January 29, 2024. Looking at past instances where SOL.X's MACD turned positive, the stock continued to rise in 35 of 53 cases over the following month. The odds of a continued upward trend are 66%.
SOL.X moved above its 50-day moving average on January 26, 2024 date and that indicates a change from a downward trend to an upward trend.
SOL.X may jump back above the lower band and head toward the middle band. Traders may consider buying the stock or exploring call options.
CRYPTOCAP:SOL
Robot factory Trading Results for last 12 months
SOL.X
AI Robots (Signals Only)
AI Robot's Name P/L
Swing Trader: Crypto Pattern Trading at Trend Reversal Points (TA) 14.01%
Day Trader: Crypto Pattern Trading in Low-Volatility Markets (TA) 4.62%
Day Trader: Crypto Pattern Trading in High-Volatility Markets (TA) 3.93%
Market Cap
The average market capitalization across the group is 43.79B. The market cap for tickers in the group ranges from 43.79B to 43.79B. SOL.X holds the highest valuation in this group at 43.79B. The lowest valued company is SOL.X at 43.79B.
High and low price notable news
The average weekly price growth across all stocks in the group was 9%. For the same group, the average monthly price growth was 2%, and the average quarterly price growth was 333%. SOL.X experienced the highest price growth at 9%, while SOL.X experienced the biggest fall at 9%.
Volume
The average weekly volume growth across all stocks in the group was 27%. For the same stocks of the group, the average monthly volume growth was -53% and the average quarterly volume growth was 703%

SOL.X in +7.86% Uptrend, rising for three consecutive days on JaMoving higher for three straight days is viewed as a bullish sign. Keep an eye on this stock for future growth. Considering data from situations where SOL.X advanced for three days, in 244 of 336 cases, the price rose further within the following month. The odds of a continued upward trend are 73%.
CRYPTOCAP:SOL
Technical Analysis (Indicators)
Bullish Trend Analysis
The Momentum Indicator moved above the 0 level on January 28, 2024. You may want to consider a long position or call options on SOL.X as a result. In 69 of 108 past instances where the momentum indicator moved above 0, the stock continued to climb. The odds of a continued upward trend are 64%.
The Moving Average Convergence Divergence (MACD) for SOL.X just turned positive on January 29, 2024. Looking at past instances where SOL.X's MACD turned positive, the stock continued to rise in 36 of 54 cases over the following month. The odds of a continued upward trend are 67%.
SOL.X moved above its 50-day moving average on January 26, 2024 date and that indicates a change from a downward trend to an upward trend.
SOL.X may jump back above the lower band and head toward the middle band. Traders may consider buying the stock or exploring call options.
Bearish Trend Analysis
The 10-day RSI Indicator for SOL.X moved out of overbought territory on December 27, 2023. This could be a bearish sign for the stock. Traders may want to consider selling the stock or buying put options. Tickeron's A.I.dvisor looked at 40 similar instances where the indicator moved out of overbought territory. In 30 of the 40 cases, the stock moved lower in the following days. This puts the odds of a move lower at 75%.
The Stochastic Oscillator entered the overbought zone. Expect a price pull-back in the foreseeable future.
The 10-day moving average for SOL.X crossed bearishly below the 50-day moving average on January 25, 2024. This indicates that the trend has shifted lower and could be considered a sell signal. In 11 of 14 past instances when the 10-day crossed below the 50-day, the stock continued to move higher over the following month. The odds of a continued downward trend are 79%.
Following a 3-day decline, the stock is projected to fall further. Considering past instances where SOL.X declined for three days, the price rose further in 50 of 62 cases within the following month. The odds of a continued downward trend are 67%.
The Aroon Indicator for SOL.X entered a downward trend on January 29, 2024. This could indicate a strong downward move is ahead for the stock. Traders may want to consider selling the stock or buying put options.

BULLISH SOLANAWhat I see right now is that Solana has harvested most of the liquidity lying south.
Right now, the most recent source of liquidity is in the North, and the market is currently at a decisive level.
Where both buyers and sellers have to make a choice, a lot of people will be selling Solana right away because they see the daily create a lower low and now an upward movement that looks like retracement, to go back south, but that is just the market engineering liquidity to take all the liquidly lying upwards.

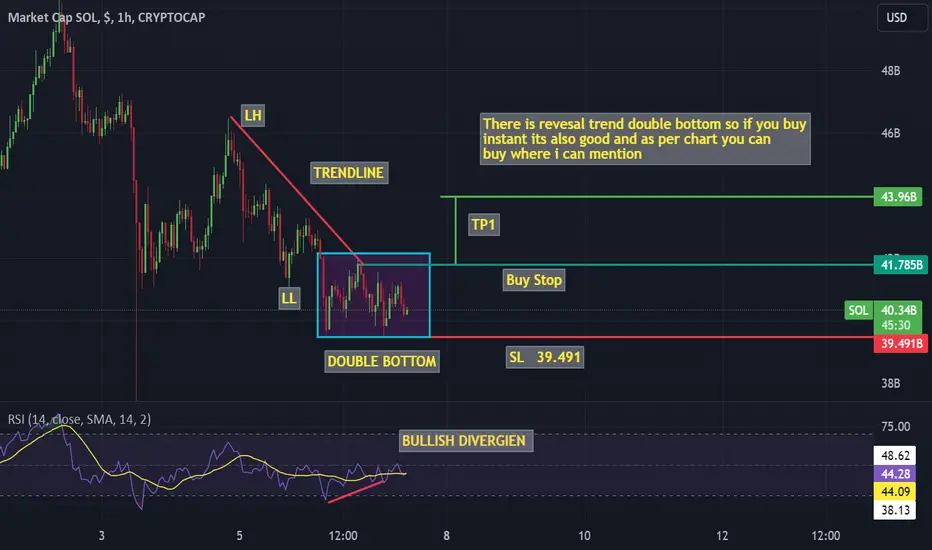
SOL REVERSAL OF THE TRENDThere is a reversal trend double bottom appears so if you buy instant it is also good as per the chart I can mention the buy-stop order and you can take the bullish ride
Solana is losing $100M per month - financial statement releasedSolana is losing at least $100M a month. Their financial statement was released to the public.
Switched to Dot
Imo, this pump is going to dump hard!
tokenterminal.com

SOLANA -- BIG HUNGRY BULLSuper Fast Block Chain 400M/S
comparative to BTC at 10 MIN
30X faster then VISA
When Sh!T hits the fan in 2025 over the gold standard when were using crypto were going to use this as our tap on our phones ECT..
