Very Bullish!!
Solana chart looks very bullish. The price is currently dropping but I think it is a very healthy correction.
Weekly chart:
1) all momentum indicators just entered the bull zone.
2) The chart is forming higher highs.
Daily:
1) EMA55 finally crossed EMA200. The last time they crossed w
Key stats
Related pairs

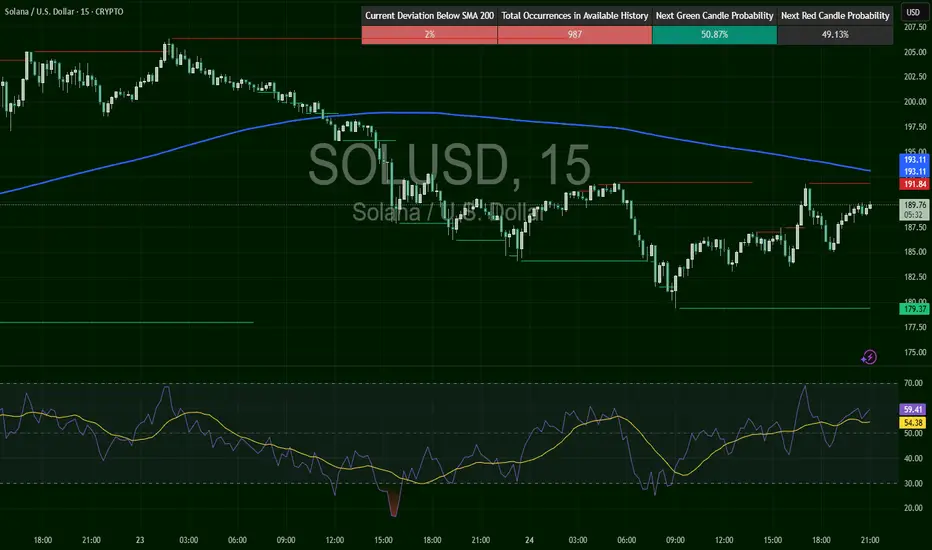
SOLUSD – Recovery Faces Wall at $193SOL broke below $198, hitting a low near $179, confirming the short trigger from the last setup. Since then, it’s building a grind-recovery, reclaiming $189 but stalling at a confluence zone ($191.84 resistance and SMA200 near $193.11). RSI at 59.41 still favors buyers — but SOL needs a clean break
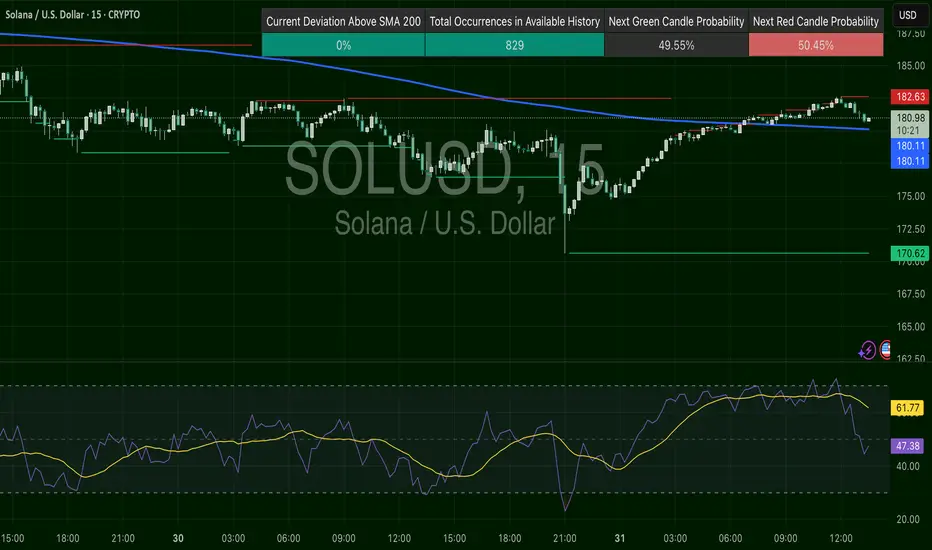
SOLUSD – Faded Highs, Now RetestingSOL recovered off the $170–172 lows and is now testing $182.63 resistance. RSI was high and now cooling off (~47), suggesting momentum is slowing. Still trading just over the 200 SMA, this is a breakout pullback zone. $180.13 is the key level to stay above.
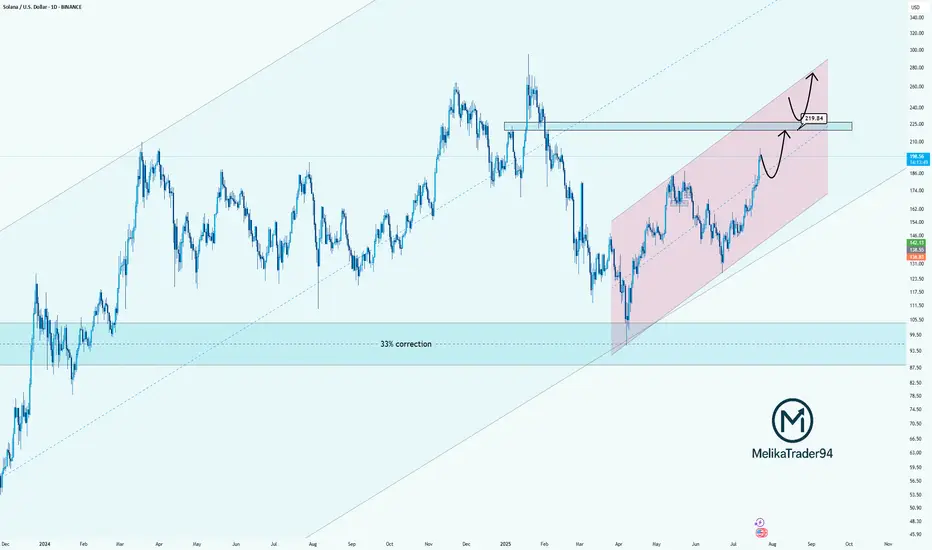
Solana Approaching Key Resistance: watch for $219Hello guys!
Solana has been trending strongly inside a rising parallel channel, recovering steadily after a significant 33% correction. The bullish momentum is clear, and the price is now approaching a key resistance zone near $219.84, which previously acted as a major turning point.
Here’s what I
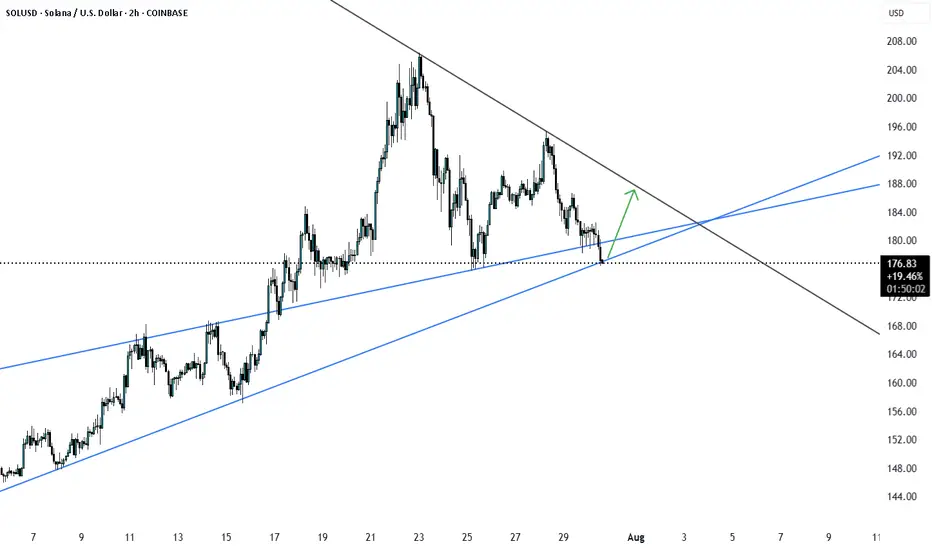
SOLUSD at Major support SOLUSD has reached major support from here we may see a good pullback. Let us see how it plays out.
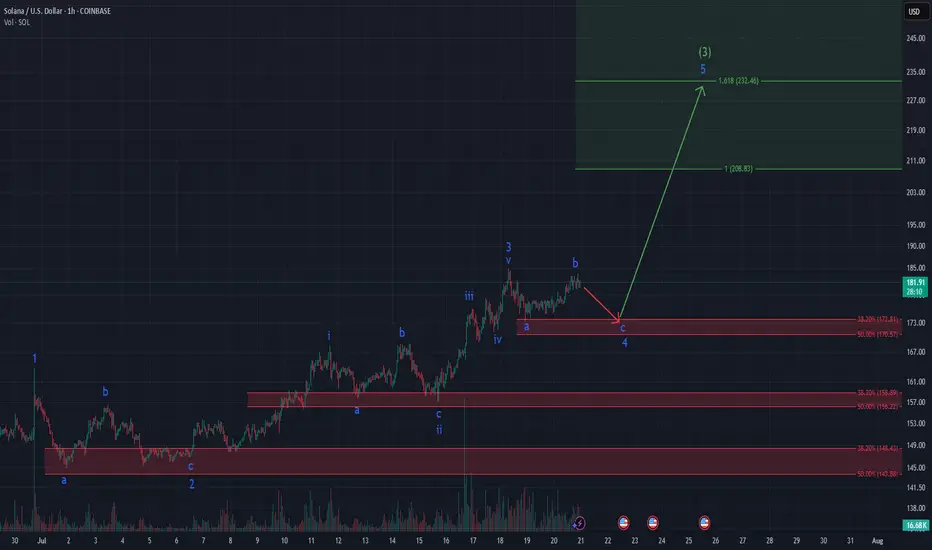
SOLANA ready for Explosion? Textbook Elliott Setup unfoldingSolana – Textbook Elliott Wave Structure Unfolding!
Clear impulsive fractals, textbook ABC corrections, and precise Fibonacci reactions – this 1h chart on CRYPTOCAP:SOL is a dream for any Elliottician.
We’re currently finishing wave C of (4) within a well-formed bullish impulse. Key support lies
SOLUSD at Strong SUPPORT SOLUSD was trading down trend the and is current at the support which was its resistance earlier and this is a strong support and expect further growth or up movement of for SOL. 2010-215.

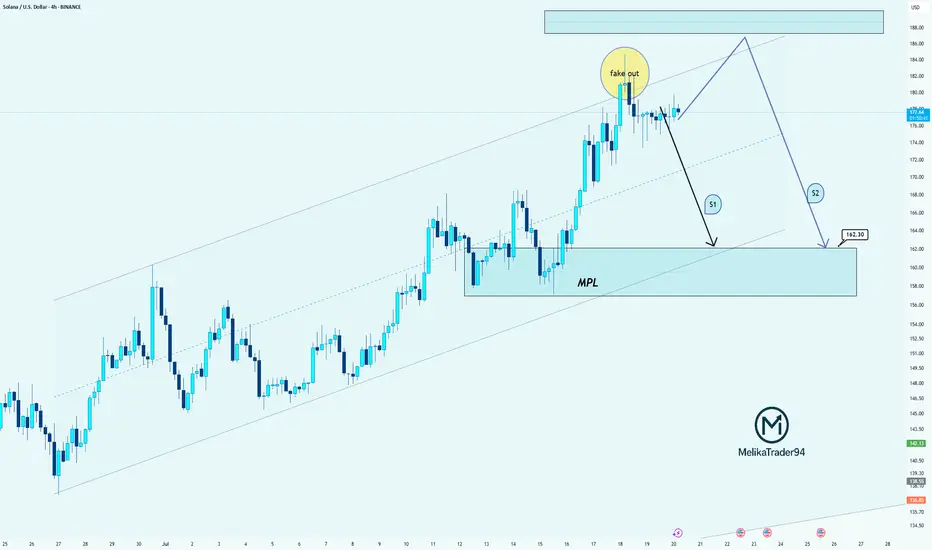
SOL: Clean Fakeout & Two Bearish Scenarios AheadHello guys!
Price just created a textbook fakeout above the resistance zone, grabbing liquidity and quickly dropping back into the range!
Here’s what the chart is showing:
Price is still inside the ascending channel, but the breakout attempt failed
The MPL (maximum pain level) around $162.30 is
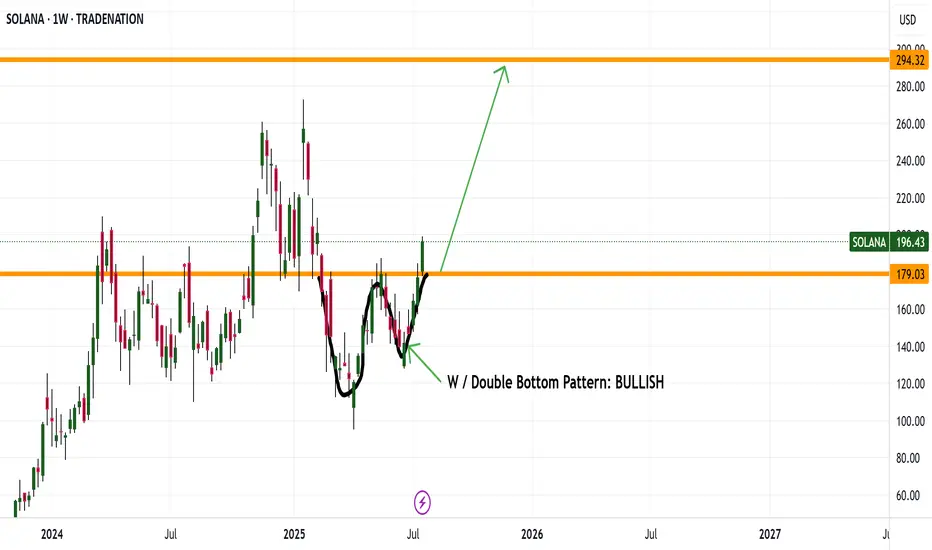
SOLANA DRIVING UP TO 294 Good evening everyone
It looks like SOL made a nice W pattern and now breaking its weekly high is driving up to 294
Enjoy happy trading this bull run
Kris/ Mindbloome Exchange
Trader Smarter Live Better
Opened longI opened a long position.
Ideally it is safe to wait for EMAs to line up for the bull trend (EMA21 > 55> 200) in the Daily chart. However, there are many indications that the price will start to move to the upside and the upside move might be quite aggressive. So I decided to open a long position

See all ideas
Displays a symbol's price movements over previous years to identify recurring trends.
Curated watchlists where SOLANA is featured.

Gen 3 crypto: A new day dawns…
25 No. of Symbols

Smart contracts: Make the smart decision
36 No. of Symbols

Staking Coins: Pick up a stake
18 No. of Symbols

Top altcoins: Choose your alternatives carefully
28 No. of Symbols

Up-and-coming crypto: New kids on the block
30 No. of Symbols
See all sparks
Frequently Asked Questions
SOLANA (SOL) reached its highest price on Jan 20, 2025 — it amounted to 272.99 USD. Find more insights on the SOL price chart.
See the list of crypto gainers and choose what best fits your strategy.
See the list of crypto gainers and choose what best fits your strategy.
SOLANA (SOL) reached the lowest price of 0.87 USD on Jul 21, 2020. View more SOLANA dynamics on the price chart.
See the list of crypto losers to find unexpected opportunities.
See the list of crypto losers to find unexpected opportunities.
The safest choice when buying SOL is to go to a well-known crypto exchange. Some of the popular names are Binance, Coinbase, Kraken. But you'll have to find a reliable broker and create an account first. You can trade SOL right from TradingView charts — just choose a broker and connect to your account.
You can discuss SOLANA (SOL) with other users in our public chats, Minds or in the comments to Ideas.