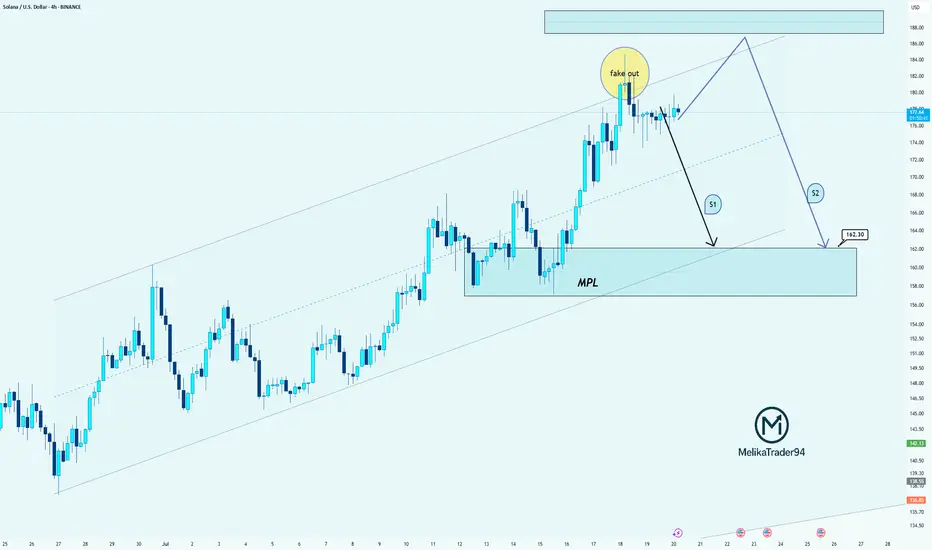
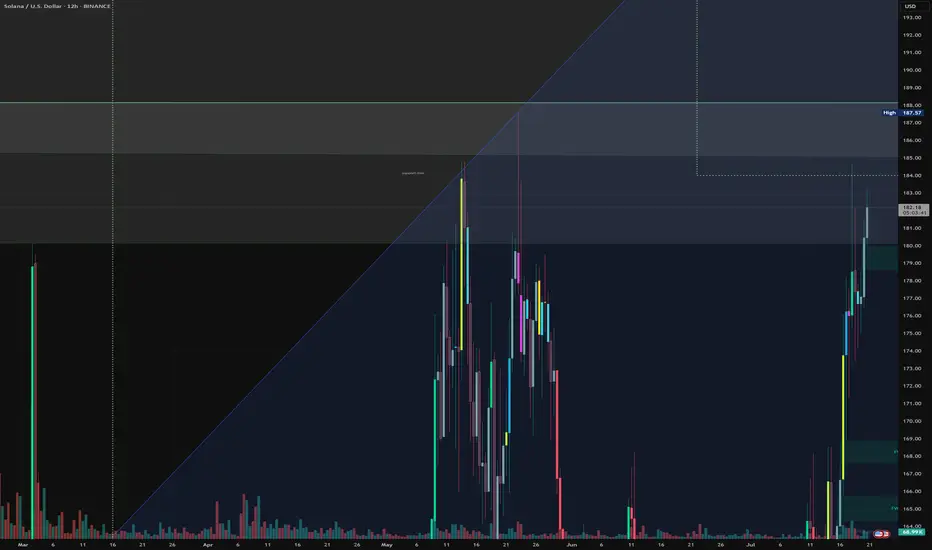
SOL: Clean Fakeout & Two Bearish Scenarios AheadHello guys!
Price just created a textbook fakeout above the resistance zone, grabbing liquidity and quickly dropping back into the range!
Here’s what the chart is showing:
Price is still inside the ascending channel, but the breakout attempt failed
The MPL (maximum pain level) around $162.30 is
Key stats
Related pairs
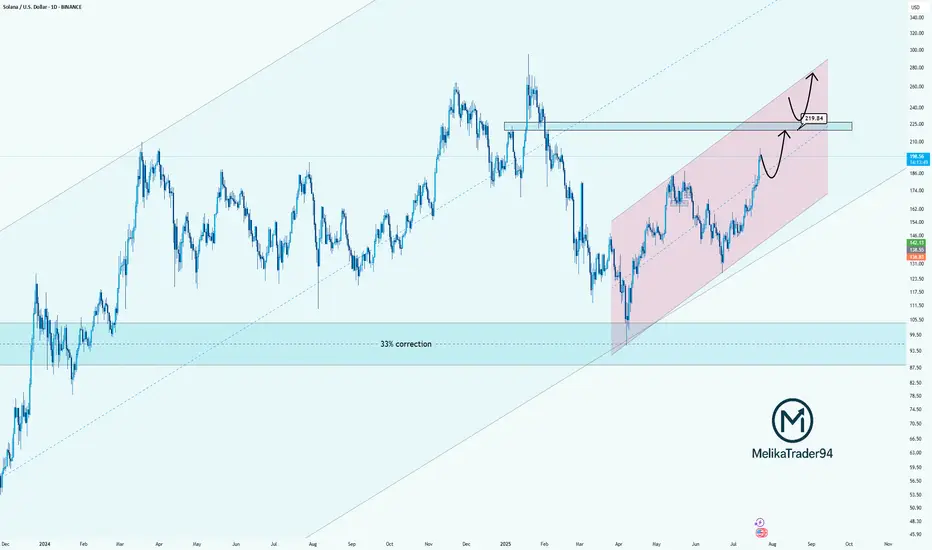
Solana Approaching Key Resistance: watch for $219Hello guys!
Solana has been trending strongly inside a rising parallel channel, recovering steadily after a significant 33% correction. The bullish momentum is clear, and the price is now approaching a key resistance zone near $219.84, which previously acted as a major turning point.
Here’s what I
Solana breakout setup: why I am watching this level closelySolana is forming a clear ascending triangle. We already saw one breakout earlier, followed by a few hard retests. Now price has stalled. This might frustrate some, but I see opportunity. A clean break could deliver 14% upside. I also discuss Bitcoin, false moves, and why time stops matter in this e

SOLUSD LongI´m looking forward to one more bullish move in this strucure fishing some liquidity. Watch out for a breakout an long confirmation
Bounce with meLooking to spring off the areas below
We are at a Major Top and playing in Supply. I don't recommend betting big here but I'll be looking to add positions based on median level bounces below. 15M and hourly bodys above median. If levels break and close I'll be looking to exit quickly.
The lower a
SOLUSDI can't say I'm a big fan of this chart setup. Sure, it's ascending triangle, but it has a lot of touches of support, and there's a huge gap to the VPVR shelf below. It's even lower than the candle support. It kind of shows you that all the action, all the volume happened way earlier in the cha

The goal when buyingWe aim to find the best opportunity when entering the market.
Based on ICT Concepts and a few other things.

SOLANA - BULLISH & BAERISH
Hello everyone,
here is my current outlook on Solana (SOL):
Personally, I am currently only watching Solana as we may already be in a correction phase. Nevertheless, there is an interesting scenario where we could still be in a green wave 5, which could potentially reach prices above USD 300.
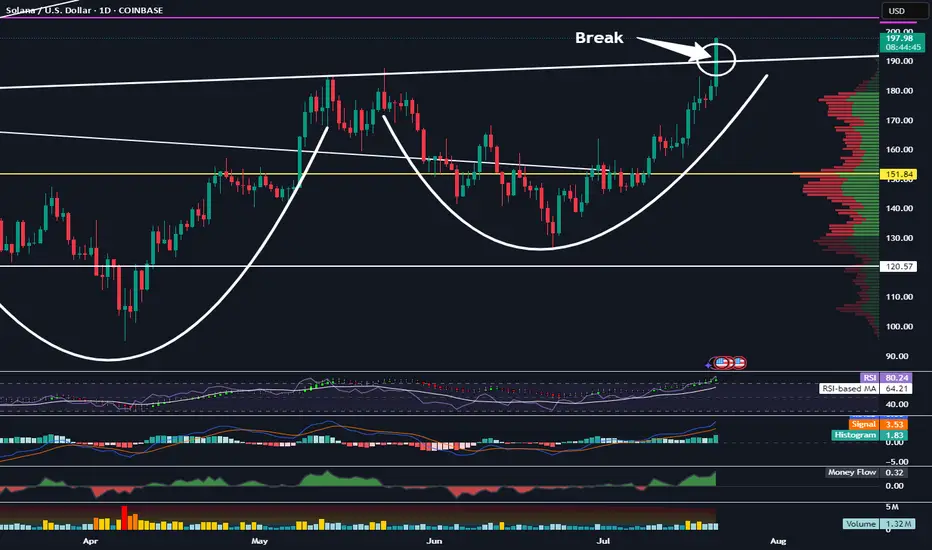
Solana Has Broken This Important Resistance LevelTrading Fam,
Things are definitely heating up in the altcoin space. Two big key movers are ETH and SOL. Right now SOL has broken a very important resistance level in the neckline of this inverse H&S pattern. Watch closely. If the body of our daily candle closes above this today and remains above it
SOL Traders Begin Taking Profits Despite Bullish RallySolana (SOL) continues to climb, but under the surface, signs of selling pressure are starting to emerge. While price action has been bullish and on-chain activity remains strong, the BBTrend indicator is flashing red — literally. For the past three days, its histogram bars have turned red and gradu
See all ideas
Displays a symbol's price movements over previous years to identify recurring trends.
Curated watchlists where SOLANA is featured.

Gen 3 crypto: A new day dawns…
25 No. of Symbols

Smart contracts: Make the smart decision
36 No. of Symbols

Staking Coins: Pick up a stake
18 No. of Symbols

Top altcoins: Choose your alternatives carefully
28 No. of Symbols

Up-and-coming crypto: New kids on the block
30 No. of Symbols
See all sparks
Frequently Asked Questions
SOLANA (SOL) reached its highest price on Jan 20, 2025 — it amounted to 272.99 USD. Find more insights on the SOL price chart.
See the list of crypto gainers and choose what best fits your strategy.
See the list of crypto gainers and choose what best fits your strategy.
SOLANA (SOL) reached the lowest price of 0.87 USD on Jul 21, 2020. View more SOLANA dynamics on the price chart.
See the list of crypto losers to find unexpected opportunities.
See the list of crypto losers to find unexpected opportunities.
The safest choice when buying SOL is to go to a well-known crypto exchange. Some of the popular names are Binance, Coinbase, Kraken. But you'll have to find a reliable broker and create an account first. You can trade SOL right from TradingView charts — just choose a broker and connect to your account.
You can discuss SOLANA (SOL) with other users in our public chats, Minds or in the comments to Ideas.