SOLUSD Daily Trend Analysis - BullishSOLUSD – Bullish Momentum Alert
Date: April 11, 2025
The Momentum indicator has confirmed a bullish signal for SOLUSD on April 11, 2025.
Entry Price: Opening price on April 12, 2025 — $120.96
Stop Loss: $94.93
Bullish Targets:
Target 1: $139.02
Target 2: $171.00
Target 3: $212.20 (Only if price breaks and closes above $171)
⚠️ Disclaimer: This is my personal market analysis and not financial advice. I may not be correct every time.
All traders are strongly advised to conduct their own technical analysis for entries, stop-loss, and exit strategies. Trading involves substantial risk — trade wisely.
SOLANA trade ideas

Solana/USD at a pivotal pointSolana has been in a downtrend since 1-19-25 creating lower lows and lower highs. Bearish death cross was confirmed in middle of March. Price is retesting major support that was broken around the $125.00 area. Only a reclaim and higher high of this area would give any indications of a possible bottom. $147.60 area would have to be broken for a break of structure to the upside and a confirmed deviation of the consolidation range.
Major resistance levels are marked on the chart and also the anchored vwaps that are anchored to important/specific price areas. These areas are points of interest where candle confirmation can lead to higher probability trades. $90.36 area looks to be wanting to be tested which is the anchor point of the vwap from the low of this entire move from late 2022.

Solana Surges Nearly 8% As Janover Pivots to Solana Treasury The price of Solana ( CRYPTOCAP:SOL ) famously known as the ethereum killer has surged nearly 8% today as Commercial property platform Janover pivots to Solana treasury strategy, stock surges 1,100% as investors rush in prior the news.
Janover has invested over $9.6 million into Solana (83,000+ SOL) as part of a new digital asset treasury strategy, with plans to stake its holdings and run validators to generate onchain revenue.
The move follows a $42 million funding round and has triggered a 1,100% surge in Janover’s stock price as the company positions itself as a transparent, publicly traded vehicle for crypto exposure.
Solana has lost grip of the $120 pivot for the past 2 weeks, but reclaimed the zone today currently trading at $120.54 per $SOL.
The daily price chart shows Solana has been trading within an enclose rectangular zone with the Resistant and support points slightly above each other. For Solana, a break above the $170 zone could pave way for a move to the $200- $270 zone. Similarly, a break below the $100 zone could be catastrophic for Solana.
However, the RSI shades a bit of a light at the end of the tunnel as it stands at 47, which is prime for a reversal.

Solana Short Term DowntrendBearish divergence on the hourly RSI. If we close below the uptrend, I see us down to first support which is, in my view, flimsy, so could result in a second leg down to the second support.
Risk profile looks nice relative to the top of the red daily fib-band.

SOLANA on its huge Bull Cycle Support.Solana / SOLUSD just hit the Rising Support that started back on the December 26th 2022 Bear Cycle Bottom.
Meanwhile, it hit for the first time in its history its 1week MA200. This is a huge Support cluster.
Having declined by -68.21% from its January All Time High, it looks identical to the last correction (also -68.21%) of the last Bull Cycle in May-June 2021.
A +1278% rally followed and it since we now enter the final phase of the Bull Cycle with the most aggressive rallies historically made, a new +1278% increase is technically possible.
Target 1200.
Follow us, like the idea and leave a comment below!!

SOL dead cat bounce?We saw a very successful bounce from the bottom of the golden pocket thanks to the 90-day tariff pause announcement, however we have stayed inside the downtrend pattern which I have highlighted. We could see a slow and steady decline back towards the golden pocket area. The theory here is that if we bounce again, we would be looking at a double bottom which is a bullish signal. Let's see how it goes. Feel free to let me know your thoughts.

Bullish or BearishDollar Weakness: Tariffs could undermine the U.S. dollar’s global dominance as trading partners seek alternatives. Analysts like Zach Pandl from Grayscale argue this creates “space for competitors like Bitcoin,” potentially driving its adoption as a hedge against a weakening dollar. If inflation spikes and the Fed pivots to looser policy (e.g., rate cuts), BTC could rally, as seen in past cycles.
Digital Gold Narrative: While BTC hasn’t fully proven itself as a safe haven (sliding alongside stocks recently), some, like Columbia’s Omid Malekan, note its “digital gold” appeal could grow if traditional systems falter. Gold has soared amid tariff news, and BTC might follow if investors shift perception.
Crypto-Friendly Policy: Trump’s pro-crypto stance—evidenced by his meme coin and regulatory reform promises—could offset tariff downsides. If his administration pushes a Bitcoin Strategic Reserve or eases regulations, institutional inflows (e.g., via ETFs) might propel BTC past its $109,000 peak from January.
Projections vary wildly. Bitwise’s Jeff Park sees BTC hitting $150,000 if tariffs spark a trade war and inflation surge. Others, like Arthur Hayes, predict $250,000 by year-end if the Fed resorts to quantitative easing. However, a bearish scenario could see BTC crash below $20,000 if tariffs trigger a recession mirroring 2008 or 2020, though this seems less likely given current resilience.
What to Expect in April 2025
For the rest of this month, BTC’s trajectory hinges on how markets digest the latest tariff fallout:
Bearish Case: If global trade fractures deepen (e.g., EU retaliates with $23 billion in tariffs, as reported), BTC could dip toward $74,000-$80,000, reflecting a broader sell-off in risk assets.
Bullish Case: If Trump softens the tariff stance (he’s hinted at pauses, like with Mexico), or if “Liberation Day” fears prove overblown, BTC might rebound to $87,000-$92,000 resistance levels, as suggested by technical analyses on TradingView.
Most Likely: Sideways movement around $80,000-$85,000 as investors recalibrate. The crypto market’s $2.75 trillion valuation suggests stability unless a major catalyst—positive or negative—emerges.
Ultimately, Trump’s tariffs introduce a mixed bag for BTC: short-term pain from volatility and risk aversion, but potential long-term gains if they destabilize traditional finance. Keep an eye on macroeconomic signals (inflation data, Fed moves) and Trump’s next policy steps—they’ll dictate whether BTC pumps or dumps this month. What’s your take—do you see tariffs as a net positive or negative for BTC?

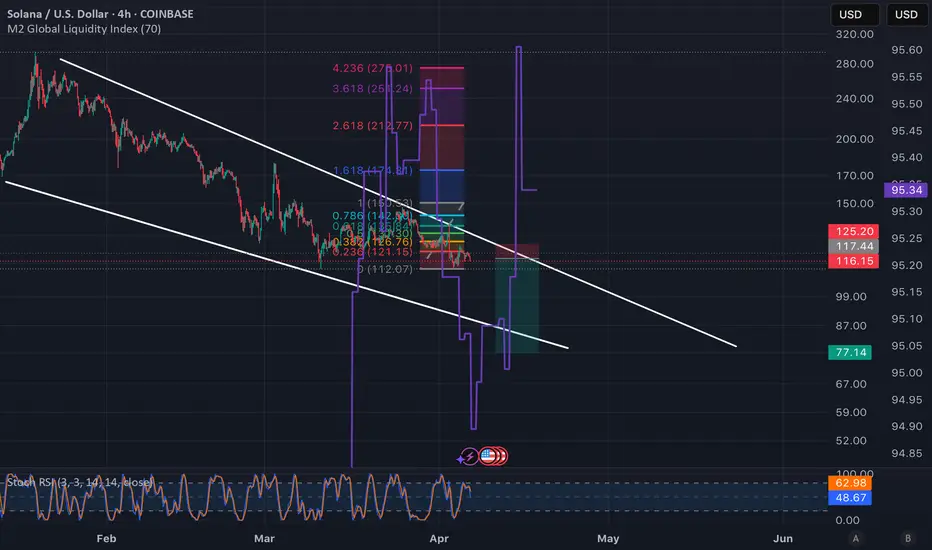
[Update SOL]: $170-->$75-->$500-->$40?Let's see some boring predictions here based on range trading and Fib extensions...lazy

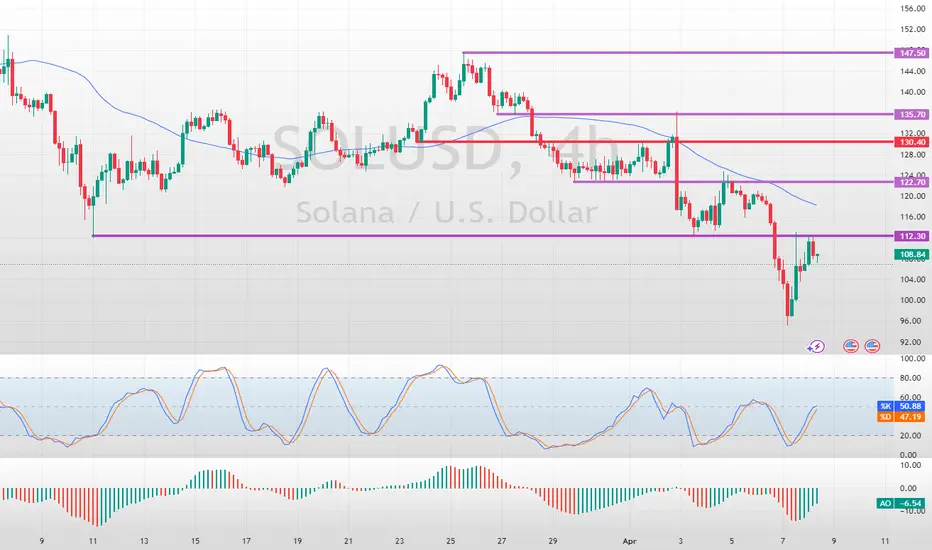
SOL/USDT Price OutlookThe cryptocurrency market continues to navigate a complex macroeconomic landscape marked by trade tensions, inflationary pressures, and shifting monetary policies. Against this backdrop, SOL/USDT is trading at 105.83, posting a modest 0.41% gain in recent sessions. However, the road ahead remains uncertain as external factors—including the U.S. dollar index (DXY) strength, rising unemployment concerns, and escalating tariff wars—could influence market sentiment.
Key Levels for SOL/USDT
- Resistance (Green Line): 122.61 – A decisive break above this level could signal a bullish resurgence.
- Immediate Support: 101.26 – Holding here is crucial to maintain upward momentum.
- Strong Support: 80.00 – A breakdown below 101.26 may trigger a deeper retracement toward this long-term floor.
Macroeconomic Risks & Crypto Impact
1. Trade Wars & Tariffs – Escalating global trade tensions could trigger risk-off sentiment, pushing investors toward stablecoins or traditional safe havens.
2. Inflation & Fed Policy – Persistent inflation may delay rate cuts, strengthening the DXY and pressuring risk assets like SOL.
3. Unemployment Data – Weak labor market reports could fuel recession fears, increasing crypto market volatility.
Next Week’s Scenarios
- Bullish Case: A sustained move above 106.60 opens the door for a rally toward 112, with 122.61 as the next major target.
- Bearish Case: Failure to hold 101.26 may lead to a drop toward 90, with 80 acting as a critical support zone.
Final Thoughts
While SOL shows short-term resilience, traders should monitor broader economic developments—particularly DXY movements, Fed statements, and geopolitical risks—for clues on the next major trend.
Disclaimer: This analysis is for informational purposes only and not financial advice. Always conduct your own research.

Sol Getting Ready For Round 3?Sol has made two massive pushes to the upside this cycle followed by a long distribution / re accumulation range. We have not quite seen a full 1/3 retrace of the cycle low but certainly in range to be watching for a momentum shift signaling seller exaustion and new intrest at the lower prices.
Current Trading Plan: DCA until a clear momentum shift occurs and trading rallies.
Targeting same $1000 area as previous long term sol chart posted early this cycle accurately forcasting the current time and range for a major sell off. Now farther in the cycle we can see a simple doubling of the current range and standard cup and handle target aligning for the potential $1000 cycle target.
Trade Well....
Your Friend,
Degen

Solana Found Resistance at $112.0FenzoFx—Solana is trading bearishly and has encountered resistance at $112.0. If this level holds, the downtrend is likely to resume, with a target of $90.0.
>>> Trade SOL/USD, swap free at FenzoFx Decentralized Broker
SOL short OP if it pumpsSOL short possibility at $125 if there's a pump. Tight stop at $130, Take profit $101

Retracting Bullish Comments About EverythingMost things are up from time of bull posts, but I do think I've got this horribly horribly wrong.
If I have - then the worse really is directly ahead.
I said a lot of bullish stuff, just want to be clear that if there's any sign of selling at all I'm out everything by trailing stop. I'll only stay in while there's small chart uptrends.
Pertains to anything bullish I've said.

WE REACHED MY LAST RESISTANCE, DO YOU THINK WE ARE GOING FURTHERGiven the current technical setup, SOL may face further downward pressure if it fails to hold above the $100 support level, FOR ME THIS IS THE LAST RESISTANCE

SOLANAsolana making low valid if liquidity take, and mybe will manipulate till above wick last, and next trending to down.
DISCLAIMER:
what I share here is just personal research, all based on my hobby and love of speculation intelligence.
The data I share does not come from financial advice.
Use controlled risk, not an invitation to buy and sell certain assets, because it all comes back to each individual.

Abundance of Risk for Bears Now: Bull trap likely. SOL recently hit major supports - ones that I've had my alerts sitting at for a while - see previous bear forecast.
Concurrent to this, we have indices hitting major supports. We have possible completion of the wave 5 part of this downtrend and we're inside the area a head and shoulder would generally form.
The odds strongly favour the bulls in alt now - for the first time in a long time.

Shoulder Time?Alts have downtrended all year and across the board show clear signals of trend failure.
But that's not to sat they might not soon rip. We have the potential for a shoulder setup, which would means alts strong up.

Roadmap for -60% in Crypto Alts The other day I posted the confluence of resistance patterns in alts. They are now down 10 - 25% depending how much of a gamble the bet was (My idea is if the price starts 0.00000 then there are numbers, this is probably a gamble).
Let's now map the typical downside break path. We're going to use the norms of breaks of 1.27 - 1.61 zone. 2.20 - 2.61 zone and a final target of 4.23.
These are typical things I see in trend development (be it bull or bear).
All updates to:

SOL in the golden pocket areaI believe that we have arrived in the golden pocket area (between 0.618 and 0.65 on the fib). This could be the most probable reversal area, however with the market turmoil, not even the lord knows. If we can hold above 96, then a reversal could be in place. DYOR and let me know what you think.

Crypto Sell-Off: Is Solana Headed for $80?Without a doubt, Solana was the hottest topic in the crypto market last year and at the start of this one—especially with the meme coin craze.
However, after peaking near $300, the price began to decline in what initially appeared to be a normal correction. But once Solana broke below the $200 mark, things turned ugly, and the price quickly dropped to the key $120 support zone—a level that held strong over the past year.
Now, it looks like Solana is on the verge of breaking below this support, which could trigger an acceleration toward $80, with the $100 psychological level as an intermediate stop.
________________________________________
Why the Downside is Likely to Continue
📉 Bulls Can’t Hold Gains – Short-term rallies are fading fast, showing a lack of real buying strength.
📉 Bearish Engulfing Candle – Yesterday’s price action printed a lower high, adding further pressure on support.
📉 $120 Breakdown Incoming? – If this level fails, expect a sharp decline toward $80.
________________________________________
Trading Plan: Selling Under $130
🔻 Sell Rallies Below $130 – Targeting a move to $80 in the medium term.
🔻 Only a Sustained Move Above $130 – Would shift Solana to a neutral stance—not bullish by any means.
For now, the bearish pressure remains, and selling rallies is the strategy to follow. 🚀

Resistance Levels in altcoins Concurrent with the indices being at major inflection points crypto has broadly also filled major inflection points.
Let's look at the different setups.
First we have SOL in the main chart. Inset is the BTC high before the 2022 bear market. Different in a few ways but both the same general idea of a nominal spike above the previous high that fits inside of a harmonic pattern.
Most of the things we're going to be looking at have extreme bullish momentum at time of writing but the patterns we're going to be looking at all forecast extreme momentum into their fills. For example, in SOL we are using a harmonic. If this was the end of a harmonic, we'd have just seen the D leg.
It is a hard set rule of all harmonics that the most aggressive part of the move is the D leg. Always. The defining characteristic of a D leg is exceptional momentum that builds to the point of looking unstoppable. So anything based on momentum, breaks of anything that's not the actionable fib levels, candle patterns etc - these are all annulled.
The D leg is defined by being exceptional by all momentum metrics.
I'm sure the other recurring point made against my ideas here will be the halving cycle break out and it's not being enough days yet etc etc. I still have my doubts about the efficacy of the halving thing. I need longer to determine 4 year cycles. Breakout did come right when predicted through. Well done to those who benefited from that.
My stance on the halving theory hasn't changed because
when people brought it up before I always just told them I don't care. I'm trading TA patterns. They'll get me out early if I am wrong. I'm going to make 1,000s of trades in my life - lots of them will be wrong. It's fine. Everything you can explain with the halving I can explain with fib breaks.
And it's still conspicuous to me that BTC and indices continue to move in tandem. Meaning we'd have to class the halving as coincidence or a driver of indices moves.
But none of that matters to me. The TA implications if the reversal patterns fail here are quite similar to the bulls halving forecasts. If we break we may end up agreeing on the same thing for different reasons. Or if this is just stop gaming / FOMO inducing, we should be at or very near the end of it now.
I like the fibs.
Here's some other patterns;

KEEP TRADING SIMPLE - BTCGood Afternoon,
Hope all is well. We are trading in a downtrend so please be careful, these need to be quick and calculated moves before determining if there is a reversal.
Volume is building, so is the support, this is a good spot to focus on a short term trade.
I have bought at this support level which is forming and will exit at resistance unless I see the trend hold and continue.
Have a great night.
BTC

SOL going down to $79I'm new to this. This is my first published Idea. I think SOL is going down. Looks like a solid trade from 117.44 down to 79.00 on the Daily time frame. If you are an experienced trader please let me know what you think about this idea. Thanks!