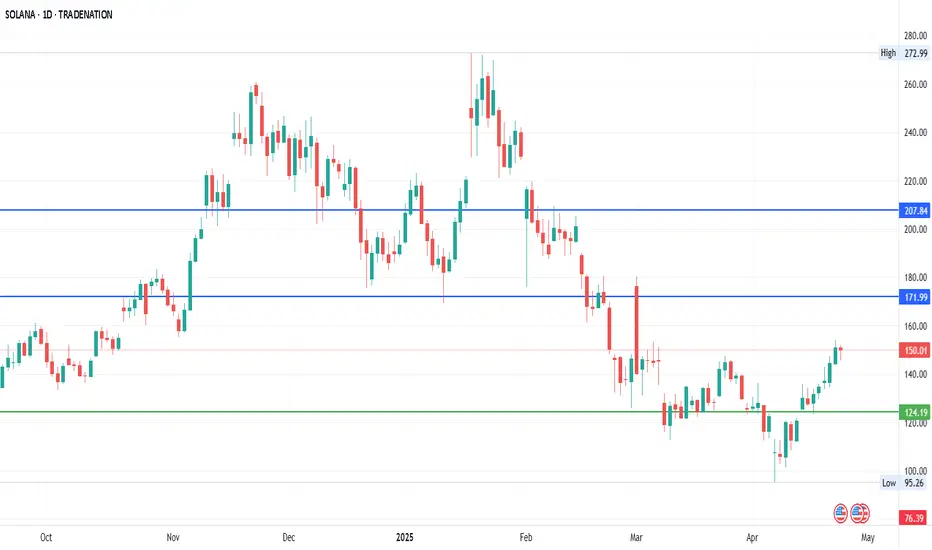
SolanaCurrent Price: 149
Upside Targets: 172 & 207.84
Downside Targets: 76.39 & 40.54
Resistance: 136.82 (It's already above this level)
Stop loss: 111.68
SOLANA trade ideas
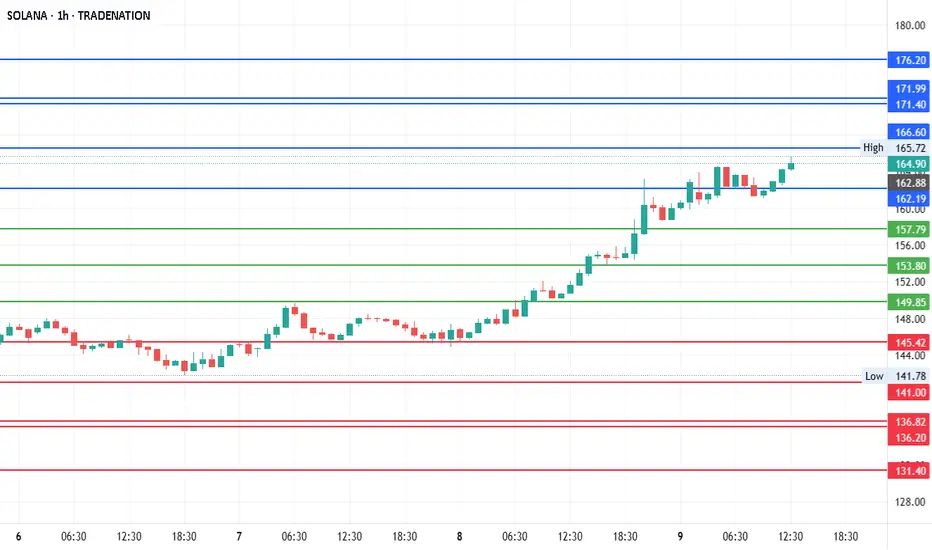
Weekly trading plan for SolanaIn this idea I marked the important levels for this week and considered a few scenarios of price performance
Locally, it is worth to consider risks in the $168-$169 zone
Write a comment with your coins & hit the like button and I will make an analysis for you
The author's opinion may differ from yours,
Consider your risks.
Wish you successful trades ! mura

Solana Found support at $169.0FenzoFx—Solana found support at $169.0, consolidating after its recent gains on Friday. The primary trend remains bullish above this level. Furthermore, the uptrend will likely resume if the price exceeds the immediate resistance level at $179.5. In this scenario, the next bullish target could be the $200.0 psychological level.
Please note that the bullish outlook should be invalidated if SOL/USD dips below $169.0.

SOLANA Hits Key Supply – Reversal or Rally? [Price Reaction ImmiSOL/USD | 1H Technical Outlook
Solana is trading inside a major supply zone (173.44 – 176), showing early signs of rejection. This level aligns with previous distribution activity. The question now: Will bulls absorb the sell pressure or get rejected hard?
Key Zones to Watch:
Supply Zone: 173.44 – 176 (current price range)
Immediate Support: 159.25 (recent breakout level)
Mid Support: 145.09 (price pivot + prior resistance)
Demand Zone: 131.33 – 126 (strong buy interest, heavy volume footprint)
Scenario Planning:
Breakout Traders: A solid close above 176 with volume could trigger an extended push higher.
Short Setup: Rejection candles or fakeouts in this range are prime short entries with targets at 159.25 and 145.
Buy the Dip: Strong reaction around 131.33 could offer a swing opportunity.
LuxAlgo Supply/Demand Zones are doing their job here—watch for a clean reaction. Plus, the U.S. economic calendar below could shake things up next week.

Solana (SOL) Breakout Alert: Technical UpdateSolana is currently confirming a bullish breakout on the 15-minute timeframe. Price action has decisively moved above the key resistance level at approximately $175.56, supported by strong volume and bullish momentum indicators.
Technical Context:
The breakout aligns with a broader macro rotation into altcoins, as indicated by declining Bitcoin dominance and a bullish ETH/BTC ratio.
On the 15-minute chart, price action is clearly above the Ichimoku Cloud, and the MACD indicator confirms bullish momentum.
RSI is currently in an overbought territory, suggesting caution and careful risk management despite the bullish breakout.
Trade Setup:
Entry: Confirmed breakout around current levels (~$175.94).
Stop-Loss: Set just below recent support at approximately $173.43 to manage downside risk effectively.
Take-Profit Targets:
Initial target at $180, corresponding to the next immediate supply zone.
Secondary extended target at the psychological resistance level of $200.
Risk Management Recommendations:
Given the overbought RSI, traders should closely monitor for potential bearish divergences or momentum exhaustion.
Consider moving the stop-loss to break-even once the price reaches the initial target ($180) to secure gains and manage risk.
This breakout presents a clear short-term bullish opportunity, but disciplined execution and vigilant risk management remain essential.
#SOL #CryptoTrading #TechnicalAnalysis #AltcoinSeason

$SOL just confirmed a perfect cup & handle breakout near $176.SOLANA: Best Setup Alert 🚨
CRYPTOCAP:SOL just confirmed a perfect cup & handle breakout near $176.
If history repeats, this could be the start of a massive rally.
Targeting $350–$500+ in the coming months.
Don’t sleep on this. ⚡📈


Very Bullish with a a clear Pullback incoming BINANCE:SOLUSDM2025
From the weekly chart we can clearly see that SOL has recovered quite nicely from the tariff scares the world markets have experienced in the last 2-3 months. We do have lowering Bullish volume over the last few weeks and we are approaching a weekly OB- (ICT Concepts) that was formed in the late February. I fully expect SOL price to spike into it, reverse for a good pullback to enter more longs and long term holdings and then continue higher from we clear $180.58 on the SOL/USD Binance chart 📈. Once that final level is cleared there is no stopping SOL until maybe the $250. If Bitcoin and the rest of the overall crypto markets remain Bullish for the rest of 2025 into January 2026 (seasonal tendency) SOL price could push to ALL Time Highs.

SOLANA... The next rising Star.Crossed the 38.2 Fib Rt . All cryptos flying. Lets see.
#Crypto
#Solana
#Bitcoin
#Trading

SOLUSD Ready for Pullback? Supply Zone Rejected Again!SOLUSD is currently trading around $171.91, testing a key supply zone marked by repeated rejections around $173.44. This area has acted as a strong resistance, and the recent wick rejection suggests potential exhaustion from buyers.
Key levels to watch:
Supply Zone: $171.50 – $173.50 (rejection zone)
Mid Support: $159.25 (potential bounce or consolidation zone)
Demand Zone: $140.50 – $145.50 (high-interest buy zone)
Bearish signs:
Price failed to close above supply range
Strong upper wick suggesting selling pressure
Momentum slowing as shown by recent candle formations
Potential Strategy:
Short from $172.50 with SL at $174.00
TP1: $159.50
TP2: $145.50 (demand re-entry zone)
Watch for a confirmed break of $159.25 with volume for stronger conviction.
This could be a short-term pullback in an overall bullish trend—trade carefully.
---
Chart Tags:
#SOLUSD #Solana #CryptoTrading #SupplyAndDemand #TechnicalAnalysis #PriceAction #TradingStrategy #BearishSignal #LuxAlgo #Crypto

$SOL - Long FractalCRYPTOCAP:SOL Fractal compared with CRYPTOCAP:BTC from 2024.
Do not fade Solana.
My top pick this cycle.
-@CryptoCurb

#Solana - Both Downside 1 and Up 1 target Hit!. What Next?
#Solana has achieved on both the sides of the initial targets and now it is moving towards the second target.
The levels marked in the chart is getting respected nicely.
Continue to watch this space.
Solana Wave Analysis – 9 May 2025- Solana is approaching the resistance level 177.50
- Likely to rise to resistance level 200.00
Solana cryptocurrency recently broke the resistance area between the resistance level 150.00 (which has been reversing the price from March) and the 61.8% Fibonacci correction of the downward impulse from the start of March.
The breakout of this resistance area accelerated the active short-term impulse wave c from the start of April, which belongs to wave B.
Solana can be expected to rise to the next resistance level 177.50 (previous monthly high from March) – the breakout of which can lead to further gains toward 200.00.

Solana: Another good buy opportunity on CryptoHello,
Another coin to look at keenly is the Solana. We see opportunity for this coin to rally also as investors begin getting the interest after the Bitcoin rally. From a technical view the coin is at the bottom of the correction as had been shown before. The MACD indicator is also close to 0 crossover further reinforcing our view.
Despite recent market volatility, Solana remains a fundamentally robust cryptocurrency. The recent announcement by President Donald Trump to establish official U.S. government cryptocurrency reserves has sparked intense discussion among industry experts. While this has contributed to short-term price fluctuations, it marks a pivotal moment for the crypto market. The formalization of U.S. crypto reserves signals growing governmental acceptance of digital assets, likely encouraging other nations to follow suit. This global shift is expected to drive substantial institutional capital into the market, boosting demand for high-quality assets like Solana.
For investors, now is the time to pay close attention to Solana. The combination of a fundamentally strong ecosystem, favorable technical indicators, and a shifting macroeconomic landscape creates a unique opportunity.
Disclosure: I am part of Trade Nation's Influencer program and receive a monthly fee for using their TradingView charts in my analysis.

Solana - Here Comes The Bullish Reversal!Solana ( CRYPTO:SOLUSD ) might head for new all time highs:
Click chart above to see the detailed analysis👆🏻
Just a couple of months ago, Solana perfectly retested the previous all time high and created an expected short term rejection. However, with the current major support area and a potential bullish reversal, Solana remains in a strong market, potentially heading for new all time highs.
Levels to watch: $120, $250
Keep your long term vision,
Philip (BasicTrading)

Solana Price Target: Expert Predicts $180–$200 BreakoutSolana Price Target: Expert Predicts $180–$200 BreakoutSolana (SOL), one of the most prominent blockchain platforms in the cryptocurrency market, has been on a tear recently, with its price rallying significantly. As of today, Solana’s bullish momentum has caught the attention of investors and analysts alike, with many predicting a breakout to the $180–$200 price range. This optimistic outlook comes on the back of strong technical indicators, increasing adoption, and improving fundamentals.
In this article, we’ll explore the key factors driving Solana’s price rally, analyze expert predictions, and assess whether SOL can sustain its upward trajectory to hit the $200 mark.
________________________________________
Solana’s Recent Rally: A Snapshot
Solana has seen a remarkable recovery in recent weeks, with its price climbing steadily after periods of consolidation and minor corrections. The blockchain platform, known for its high-speed transactions and low fees, is once again making waves as it captures investor interest.
Key Highlights of the Rally:
1. Price Momentum: Solana’s price surged by over 30% in the last week, breaking past key resistance levels and positioning itself for further gains.
2. High Trading Volumes: The rally has been accompanied by a significant increase in trading volumes, indicating strong market participation.
3. On-Chain Activity: Solana’s on-chain activity has also spiked, with rising transaction counts and growing usage of decentralized applications (dApps) on its network.
These developments underscore the growing confidence among investors and the sustained demand for Solana’s ecosystem.
________________________________________
What’s Driving Solana’s Price Surge?
The ongoing rally in Solana's price is being fueled by a combination of technical, fundamental, and macroeconomic factors. Let’s take a closer look at these drivers:
1. Strong Technical Indicators
Technical analysis suggests that Solana’s price is in a bullish breakout phase. Analysts have pointed to several key technical patterns that support the prediction of a move toward $200:
• Ascending Triangle Pattern: Solana’s price chart shows an ascending triangle formation, a bullish continuation pattern that typically signals a breakout to higher levels.
• Support and Resistance Levels: SOL recently broke through the $150 resistance level, which had previously acted as a key barrier. With this resistance now flipped into support, the path to $180–$200 becomes more feasible.
• Moving Averages: Solana’s price is trading well above its 50-day and 200-day moving averages, a classic bullish signal that indicates strong upward momentum.
2. Ecosystem Growth
Solana’s ecosystem has been expanding rapidly, with an increasing number of developers and projects choosing its blockchain for their applications. Key areas of growth include:
• DeFi Expansion: Solana has become a hub for decentralized finance (DeFi) projects, with platforms such as Raydium, Serum, and Marinade gaining traction.
• NFT Boom: The Solana blockchain has also emerged as a major player in the non-fungible token (NFT) space, hosting popular marketplaces like Magic Eden and SolSea.
• Gaming and Web3: Solana’s high-speed, low-cost infrastructure makes it an ideal platform for blockchain-based gaming and Web3 applications.
This growing ecosystem contributes to increased demand for SOL tokens, driving up their value.
3. Institutional Interest
Institutional investors have been steadily increasing their exposure to Solana. This trend is evident from the inflows into Solana-based investment products and the growing number of hedge funds and venture capital firms backing Solana projects.
Notably, Solana’s ability to process thousands of transactions per second at a fraction of the cost of Ethereum has made it an attractive alternative for institutional use cases.
4. Favorable Market Conditions
The broader cryptocurrency market has also been in a recovery phase, with Bitcoin, Ethereum, and other major cryptocurrencies rallying. This positive market sentiment has spilled over into Solana, amplifying its price gains.
Additionally, the macroeconomic environment—characterized by easing inflation concerns and renewed interest in risk assets—has created a conducive environment for cryptocurrencies to thrive.
________________________________________
Expert Predictions: $180–$200 Breakout
Several experts and analysts have weighed in on Solana’s price trajectory, with many predicting a move to $180–$200 in the near term. Here are some of the most notable predictions:
Technical Analysts See Bullish Patterns
Prominent cryptocurrency analysts have pointed to bullish technical patterns that suggest Solana could soon reach $200. For instance:
• Ascending Triangle Target: Based on the ascending triangle pattern, the measured move suggests a price target of $190–$200.
• Fibonacci Retracement Levels: Analysts using Fibonacci retracement levels have identified $180 and $200 as key levels of interest.
Institutional Analysts Eye $200
Institutional analysts have also expressed optimism about Solana’s price potential. A recent report by a leading investment firm highlighted the following factors supporting a $200 price target:
• Increasing adoption in the DeFi and NFT sectors.
• Strong developer activity on the Solana blockchain.
• Growing institutional inflows into Solana-based products.
Community Sentiment
The Solana community remains highly bullish, with many investors and enthusiasts sharing optimistic price targets on social media platforms. This positive sentiment often serves as a self-reinforcing mechanism, attracting more buyers and driving up the price.
________________________________________
Challenges and Risks
While the outlook for Solana appears promising, it’s important to consider the potential challenges and risks that could impact its price trajectory:
1. Competition from Ethereum and Layer-2 Solutions
Ethereum’s transition to Proof of Stake (PoS) and the rise of Layer-2 scaling solutions like Arbitrum and Optimism could pose challenges to Solana’s market share. These competitors are addressing scalability issues, reducing the competitive advantage that Solana has traditionally enjoyed.
2. Network Outages
Solana has faced criticism for network outages in the past, which have raised concerns about its reliability. Any future outages could undermine investor confidence and slow adoption.
3. Regulatory Uncertainty
The cryptocurrency market remains highly sensitive to regulatory developments. Unfavorable regulations targeting DeFi, NFTs, or blockchain technology could negatively impact Solana and the broader market.
4. Market Volatility
Cryptocurrencies are inherently volatile, and Solana is no exception. While the current rally is encouraging, sharp corrections are always a possibility, particularly if external factors such as macroeconomic events or market sentiment shift.
________________________________________
Can Solana Sustain Its Momentum?
For Solana to sustain its momentum and achieve the $200 price target, several factors need to align:
• Continued Ecosystem Growth: Solana must maintain its position as a leading platform for DeFi, NFTs, and Web3 applications. This requires ongoing innovation and developer support.
• Institutional Adoption: Increased participation from institutional investors will be critical to sustaining demand for SOL tokens.
• Positive Market Sentiment: The broader cryptocurrency market needs to remain in a bullish phase, providing a favorable backdrop for Solana’s price growth.
• Resolving Network Issues: Addressing concerns about network reliability and scalability will be key to maintaining investor confidence.
________________________________________
Conclusion
Solana’s recent rally and the expert predictions of a $180–$200 breakout highlight the growing confidence in its ecosystem and price potential. Driven by strong technical indicators, ecosystem expansion, institutional interest, and favorable market conditions, Solana appears well-positioned for further gains.
However, challenges such as competition, network reliability, regulatory risks, and market volatility remain. Investors should approach Solana with cautious optimism, balancing the bullish outlook with an awareness of the risks involved.
As Solana continues its upward trajectory, the $200 milestone could mark a significant achievement for the blockchain platform, solidifying its status as one of the leading players in the cryptocurrency space. Whether this rally leads to sustained growth or faces temporary setbacks, one thing is clear: Solana’s growing ecosystem and innovative technology make it a force to be reckoned with in the world of blockchain and decentralized applications.

solana to the moon let's see how potentieal solana is, following the bitcoin bullish trend and creating a new peak at the 155

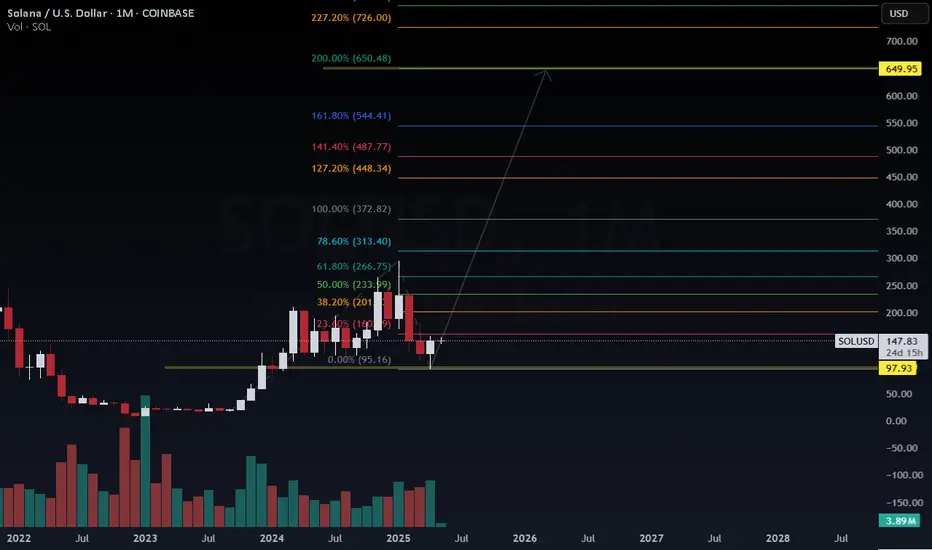
Long SOL : Fibonacci Expansion Suggests Massive Upside📈 Technical Analysis:
I’ve initiated a long position on COINBASE:SOLUSD after observing a clean monthly higher low forming near the 23.6% retracement level ($120), bouncing off the key support zone at $97.93, which also aligns with the prior base from mid-2023. The Fibonacci levels drawn from the swing low ($95.16) to the swing high (~$267) suggest the following:
Golden Pocket Zone: $233 – $266 (50%–61.8%)
Major Expansion Targets:
100%: $372
161.8%: $544
200%: $650
227.2%: $726
🔍 Volume shows accumulation in the lower range, and the recent rejection wick hints at demand absorption. A monthly close above $150 could trigger further upside momentum.
📊 Risk/Reward is asymmetric here with downside risk capped near $95 and potential upside of 3x–4x. Monitoring for a breakout above $201 (38.2% level) to add more.
🧠 Narrative: As institutional interest grows in Layer 1 altcoins and ETH’s dominance plateaus, SOL could outperform in the next macro cycle. The chart suggests bullish continuation over the next 6–18 months.
💼 Position Disclosure: Long from $147, targeting $372–$650 range in the coming cycles.
Elliott wave corrections simple impulsive move after a deep correction
Gunning for the liquidity above. Similar move to last impulse.
2 potential setups for FVGs maybe tight pullbacks and ripping over next 12hrs
NFA / Trade at your own risk with your own analysis and never trade more than you can stomach.


AI Prediction SOL/USD Trading Plan 24 hours!💰 May 4, 2025 8:52 pm. SOL/USD Trading Plan
Long Scenario
- Entry: Breakout above 148.50 (volume >8,000).
- Stop-Loss (SL): 145.50 (below support).
- Take-Profit (TP): 149.50 (below resistance).
- Trailing Stop: 1.5x ATR ($0.77).
- Confirmation: Supertrend (long), MACD bullish crossover, RSI >50.
Short Scenario
- Entry: Breakdown below 146.50 (volume >12,000).
- SL: 147.50 (above resistance).
- TP: 145.50 (above support).
- Trailing Stop: 1x ATR ($0.51).
- Confirmation: Supertrend flips short, MACD bearish, CMF <0.

Is $130 next target for Solana ?In this idea I marked the important levels for this week and considered a few scenarios of price performance
At the moment the price is under Pivot Points, the longer the price will be lower the more chances to see a breakdown of the local bottom
Write a comment with your coins & hit the like button and I will make an analysis for you
The author's opinion may differ from yours,
Consider your risks.
Wish you successful trades! MURA

SOLANA 4H - Rejection From Supply Zone | Bearish Move Loading? Solana is showing signs of weakness after repeated rejections from the $150.60 Supply Zone, a key area highlighted by the LuxAlgo Supply and Demand Visible Range. Price has failed to break above this resistance multiple times, forming a strong distribution pattern.
Bearish Signals:
Rejection from supply zone around $150 - $151.
Strong resistance confirmed by visible volume profile.
Current price action is compressing under resistance, signaling potential bearish breakout.
Red arrows point to key bearish targets at:
$126.68 – previous structure support.
$104.37 – high-volume node and demand zone.
If price breaks below the short-term range (around $145), expect acceleration towards these downside targets.
Watch for:
Break and retest of $145 level for confirmation.
Increased volume on breakdown = stronger momentum.
Macro support area between $100 – $105 could offer a bullish bounce later.
Bias: Bearish short-term | Neutral to Bullish long-term (above $100 support zone)
What's Your Plan?
Short traders: look for break & retest setups with tight SLs.
Long-term holders: dollar-cost average near demand zone if tested.
