"SOL/USD BULLISH HEIST! Steal Profits Like a Pro"🏆 "SOLANA HEIST ALERT! 🚨 Bullish Loot Ahead – Thief Trading Style (SOL/USD)" 🏆
💸 Steal Profits Like a Pro – Day/Swing Trade Plan 💸
🌟 Greetings, Market Pirates & Profit Raiders! 🌟
Hola! Bonjour! Hallo! Marhaba! 🤑 Dear Thieves & Trend Snipers, the SOL/USD vault is WIDE OPEN! Time to execute the heist with precision.
🔥 THIEF TRADING MASTER PLAN 🔥
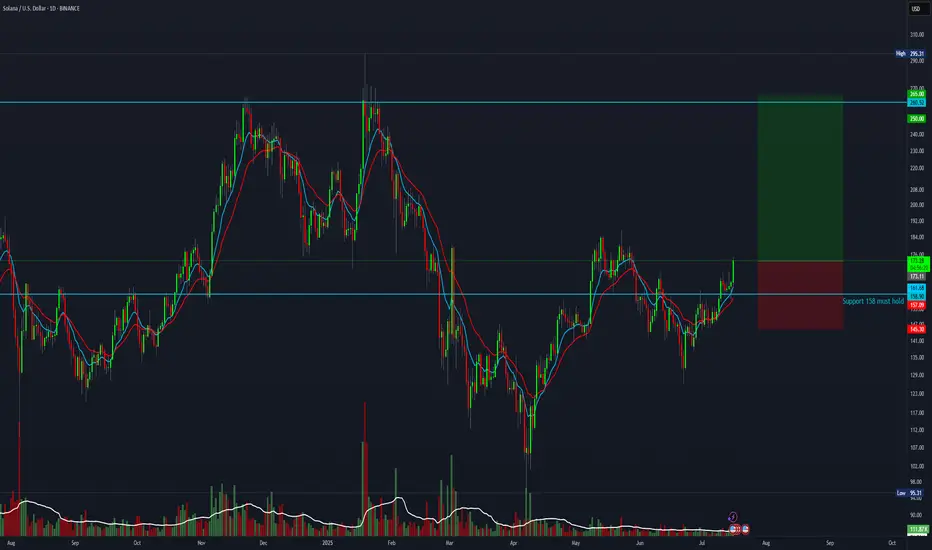
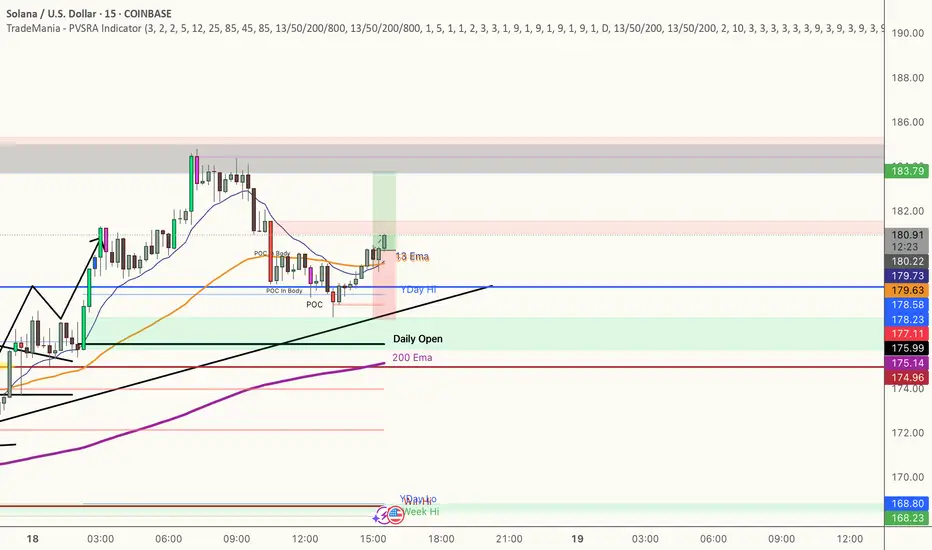
🎯 Mission: LONG SOLANA (Escape Near Blue ATR Line)
⚠️ Danger Zone: Overbought | Consolidation | Bear Trap Ahead
🏆 Rule: "Take Profit & Treat Yourself – You’ve Earned It!" 💪💰
📈 ENTRY STRATEGY (The Heist Begins!)
"SWIPE THE BULLISH LOOT!" – Enter at any price, but smart thieves use:
Buy Limit Orders (15-30min timeframe)
Swing Low/High Pullbacks for optimal entry
DCA/Layering Strategy (Multiple limit orders for max loot)
🛑 STOP-LOSS (Escape Plan)
📍 Thief SL: Below nearest low (Daily MA @ $160.00)
⚠️ Adjust SL based on: Risk tolerance, lot size, & DCA layers.
Pro Tip: Tighten SL if market flips bearish!
🎯 TARGETS (Profit Escape Routes)
🎯 Main Take-Profit: $220.00 (or exit earlier if momentum fades)
🧲 Scalpers: Only LONG! Use trailing SL to lock gains.
💰 Big Bank Thieves: Go all-in. Smaller Raiders: Join swing traders.
📰 WHY SOLANA? (Fundamental Boosters)
Bullish Momentum (Tech + Sentiment Driving Price)
Macro Trends, On-Chain Signals 👉 Check Liinkss 🔗
Intermarket Analysis: Crypto & equities syncing for gains!
⚠️ TRADING ALERTS (News & Risk Control)
🚨 News = VOLATILITY! Avoid new trades during major releases.
🔒 Protect Running Trades: Use trailing stops to secure profits.
💥 SUPPORT THE HEIST! (Boost & Win Together) 💥
🔥 Hit the "LIKE" & "BOOST" button to strengthen our Thief Trading Squad!
🚀 More Heist Plans Coming Soon – Stay Tuned! 🤑🎉
📌 Reminder: This is NOT financial advice – DYOR & manage risk!
SOLUSD.P trade ideas

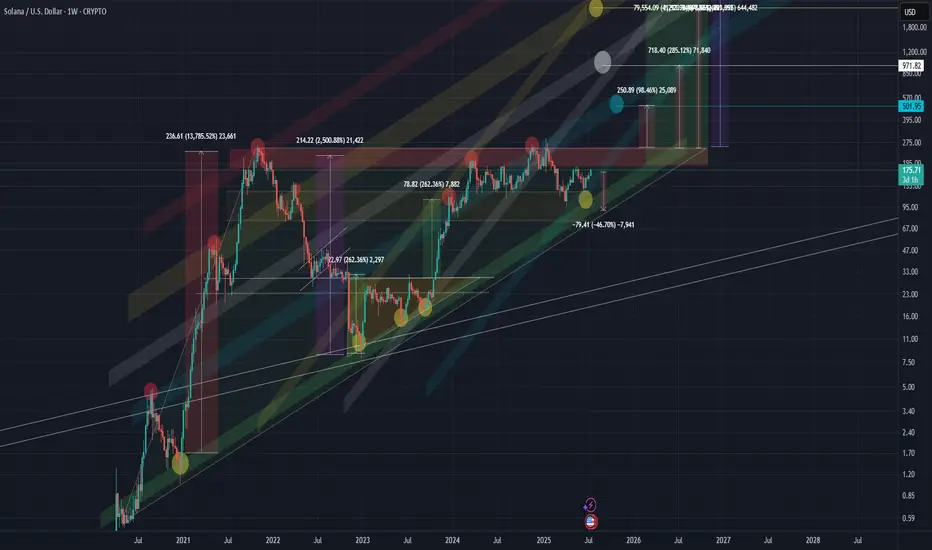
SOLANA SOL 1WThis coin is showing very interesting development, and the market maker seems to be painting clear structural patterns.
🔷 Macro Structure: Rising Triangle
On the higher timeframes, we can clearly see a rising triangle formation taking shape. If this pattern breaks out to the upside, the potential measured move suggests a target of up to ~2,500% from current levels.
📊 Chart Overview
Wide zones = key support and resistance
Former resistance often becomes support after a breakout
All target levels and zones are clearly marked on the chart
⚠️ Risk Warning & Realistic Scenario
Be mindful of market behavior:
Often before a bullish breakout, we see a fake breakdown — a trap to liquidate early longs — followed by a return into the triangle and a strong move upward. Don’t rush. Let the pattern confirm itself.
💡 Plan Accordingly
If you're already in, consider protecting your position with a stop-loss
Don’t overleverage, and take profit partially on strong levels
Solana breakout setup: why I am watching this level closelySolana is forming a clear ascending triangle. We already saw one breakout earlier, followed by a few hard retests. Now price has stalled. This might frustrate some, but I see opportunity. A clean break could deliver 14% upside. I also discuss Bitcoin, false moves, and why time stops matter in this environment. Watch closely.

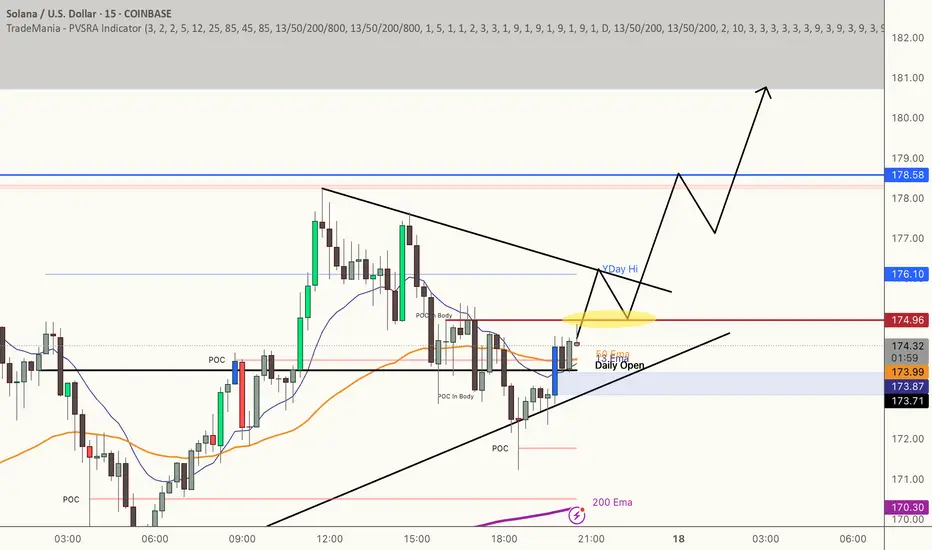
Bounce with meLooking to spring off the areas below
We are at a Major Top and playing in Supply. I don't recommend betting big here but I'll be looking to add positions based on median level bounces below. 15M and hourly bodys above median. If levels break and close I'll be looking to exit quickly.
The lower area has better odds of bounce off of a major level and I would expect more impact here.
I'm overly bullish and we could see a massive move come in so play smart.
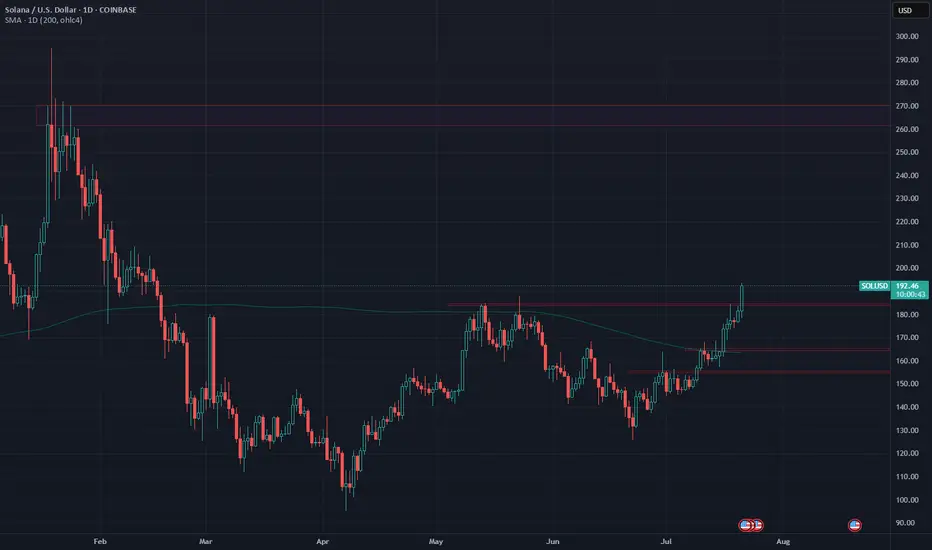
Solana Enters Bullish TerritorySOL has been showing strength since it reclaimed the 1D 200MA last week.
Currently trading around $192 - above May's highs - continued bullish momentum could see price test Jan highs around $270.
Until then, any retracement could be a buying opportunity.
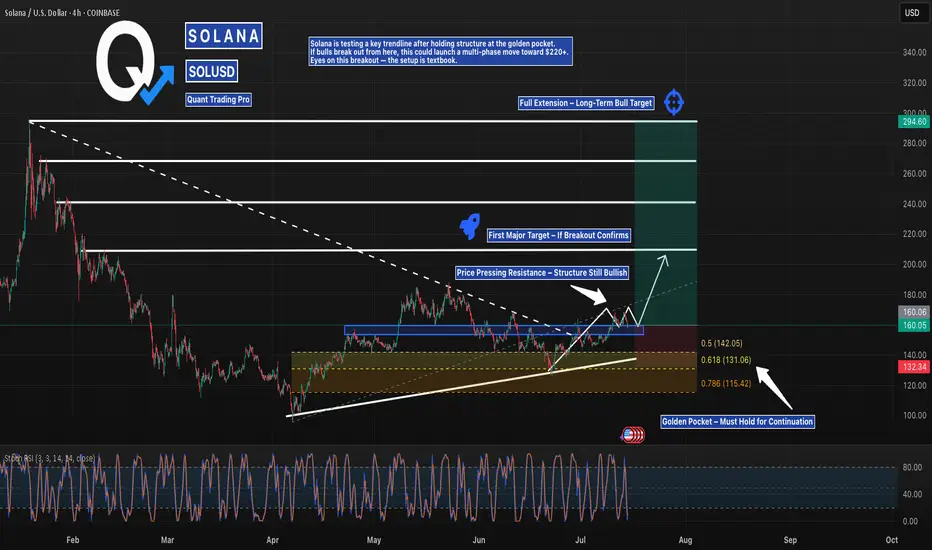
Solana’s Breakout Setup is Loaded — Bullish Structure IntactSolana is pressing into key resistance after holding its higher low structure and climbing out of the golden pocket. With a breakout forming just under the descending trendline, bulls are watching for confirmation to ignite a move toward $220 — and potentially $290+.
Momentum is coiled, and the chart is clean. If price holds above $142, this could be the beginning of a multi-leg run.
#SOLUSD #SolanaBreakout #CryptoTrading #QuantTradingPro #BacktestYourEdge #TradingView #AltcoinSetup
SOLANA - BULLISH & BAERISH
Hello everyone,
here is my current outlook on Solana (SOL):
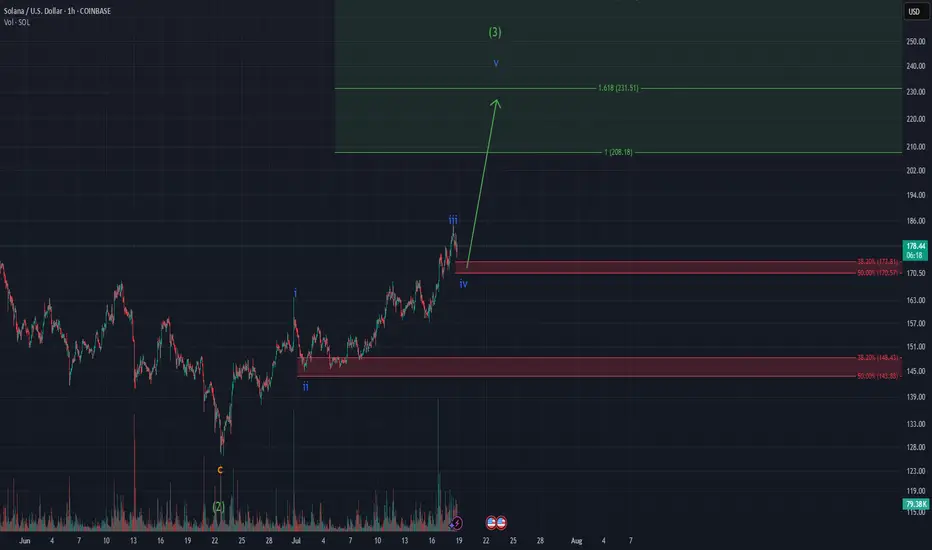
Personally, I am currently only watching Solana as we may already be in a correction phase. Nevertheless, there is an interesting scenario where we could still be in a green wave 5, which could potentially reach prices above USD 300.
Possible course:
In April 2025, the bottom may have been found following an ABC formation.
Wave 1 (yellow) could be completed in May 2025.
Wave 2 (yellow) could end in June 2025.
We could currently be in wave 3 (yellow).
Important point to watch:
If the price does not make it sustainably above the yellow wave 1 (approx. USD 190), the probability increases strongly that we are still in a B wave.
This would mean that we are still in a major correction, which could theoretically take us back to around USD 60. In this scenario, wave 1 would have already ended in January 2025 and we would still be in the correction of wave 2.
Conclusion:
The indicators are particularly important in this phase. Keep a close eye on them to better understand the structure.
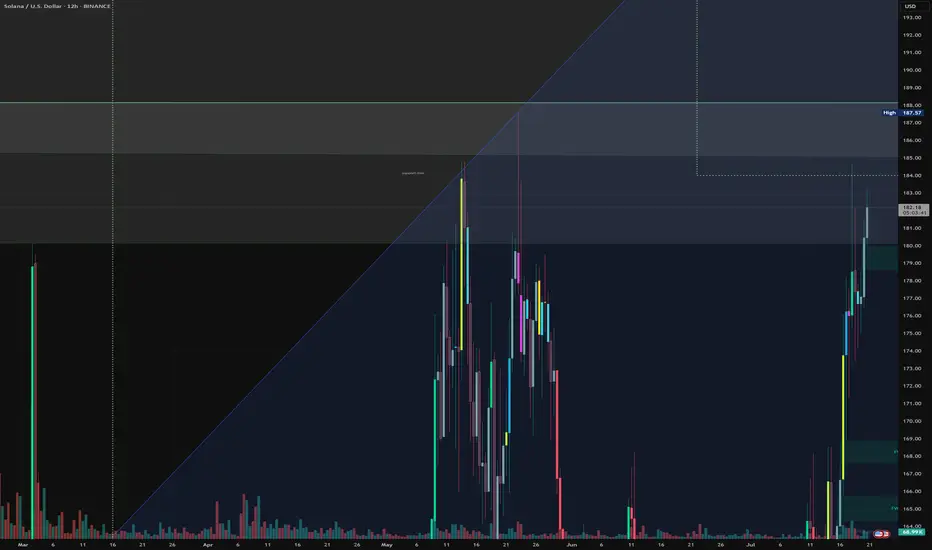
Solana Price ReversalYou can check the Solana price rebound from the history of market liquidity increases. This support range is still active, and since the daily chart needs time for the price to rebound, we can consider one to two months for Solana to increase in the future.
Sasha Charkhchian

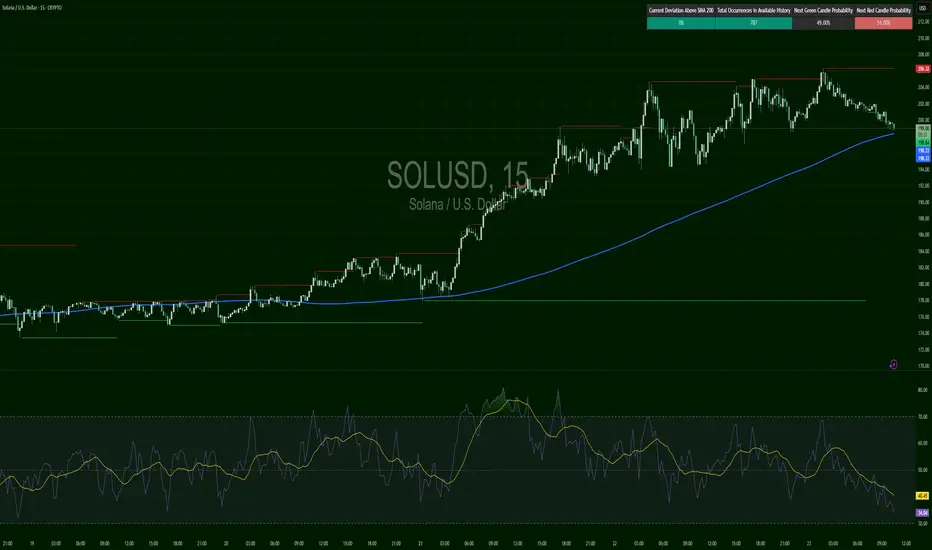
SOLUSDTSOL/USD (Solana):
○ Trend: Very strong uptrend (exponential increase).
○ Current Conditions: Price has reached a new high above $180 after a very rapid and significant rise.
○ Entry Recommendation: Entry is strongly discouraged at this time. The risk of a deep correction is very high. Ideally, wait for a significant correction to a strong support area (e.g., $158-$162 or $148-$152) and look for a bullish reversal signal.
Cryptocurrency Futures Market Disclaimer 🚨🚨🚨
Trading cryptocurrency futures involves high risks and is not suitable for all investors.
Cryptocurrency prices are highly volatile, which can lead to significant gains or losses in a short period.
Before engaging in crypto futures trading, consider your risk tolerance, experience, and financial situation.
Risk of Loss: You may lose more than your initial capital due to the leveraged nature of futures. You are fully responsible for any losses incurred.
Market Volatility: Crypto prices can fluctuate significantly due to factors such as market sentiment, regulations, or unforeseen events.
Leverage Risk: The use of leverage can amplify profits but also increases the risk of total loss.
Regulatory Uncertainty: Regulations related to cryptocurrencies vary by jurisdiction and may change, affecting the value or legality of trading.
Technical Risks: Platform disruptions, hacking, or technical issues may result in losses.
This information is not financial, investment, or trading advice. Consult a professional financial advisor before making decisions. We are not liable for any losses or damages arising from cryptocurrency futures trading.
Note: Ensure compliance with local regulations regarding cryptocurrency trading in your region.
thanks for like and follow @ydnldn to have more information outlook and free signal.
About me :
"I am a passionate swing trader focused on analyzing financial markets to capture profit opportunities from medium-term price movements. With a disciplined approach and in-depth technical analysis, I concentrate on identifying trends, support-resistance levels, and price patterns to make informed trading decisions. I prioritize strict risk management to protect capital while maximizing profit potential. Always learning and adapting to market dynamics, I enjoy the process of refining strategies to achieve consistency in trading."

SOLUSD LongI´m looking forward to one more bullish move in this strucure fishing some liquidity. Watch out for a breakout an long confirmation
The goal when buyingWe aim to find the best opportunity when entering the market.
Based on ICT Concepts and a few other things.

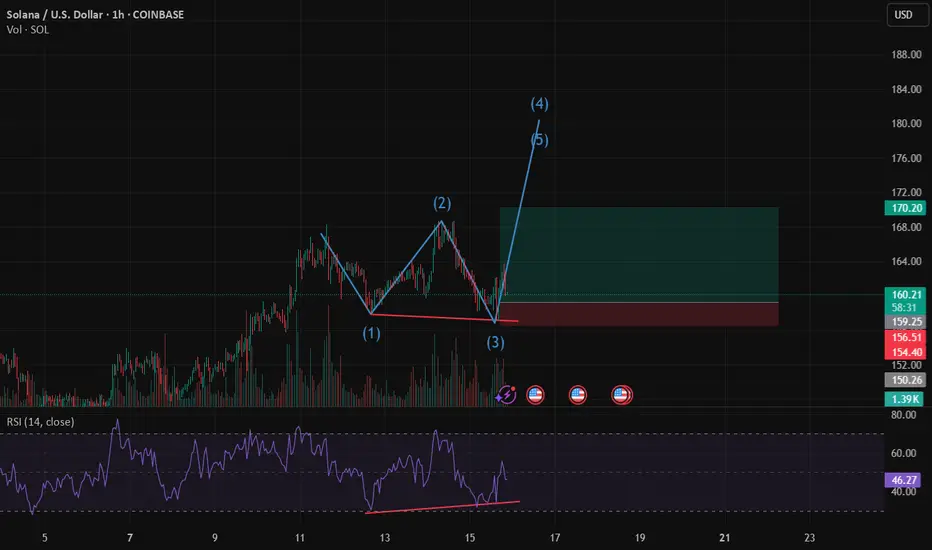
Elliot Wave Solana Chart 4h (Searching for opinions)I am a Elliot-Beginner and trying my best after reading several lecture. I would appreciate tips and meaning about my chart. I want to improve my forecasts.
Thanks in advance!
Double bottom on the way up!Solana seems to still have more breath to push the price up the page from this double bottom after a strong push up with good volume! It has a good chance to push the price to 180 if you have the stomach to ride it!
SOL trade setup with a 3.3:1 risk-to-reward ratioThis trade setup offers a 3.3:1 R:R
Entry: 174
Stop Loss: 145
Target: 265
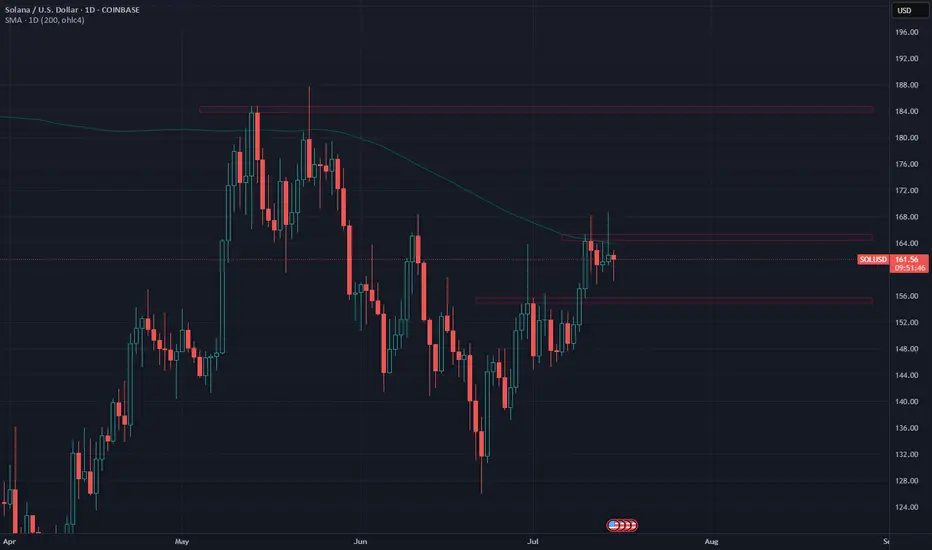
Solana's battle continues. But for how long?The battle for Solana to overcome the 1D 200MA continues.
A daily closed above $166 could signal a push towards May Hs around $185.
The last time SOL traded above 1D 200MA was in Feb. Since then, the daily 200MA has been acting as resistance.
If Solana can finally start trading above the 200MA and reclaim $185, it could signal higher prices and a test of January Hs around $270.
In the short term, support can be expected around $156 should price start to show some weakness... Losing it wouldn't be nice...
What do you expect from Solana in the short term?
SOLUSD – Coil in DeclineSOL rallied fiercely from $146 into $170, then sold off aggressively. The chart shows a classic mid-trend distribution, followed by lower highs forming into a descending wedge. Support at $158 has held for now. A breakout over $161–162 could shift structure, but below $157 = trouble.

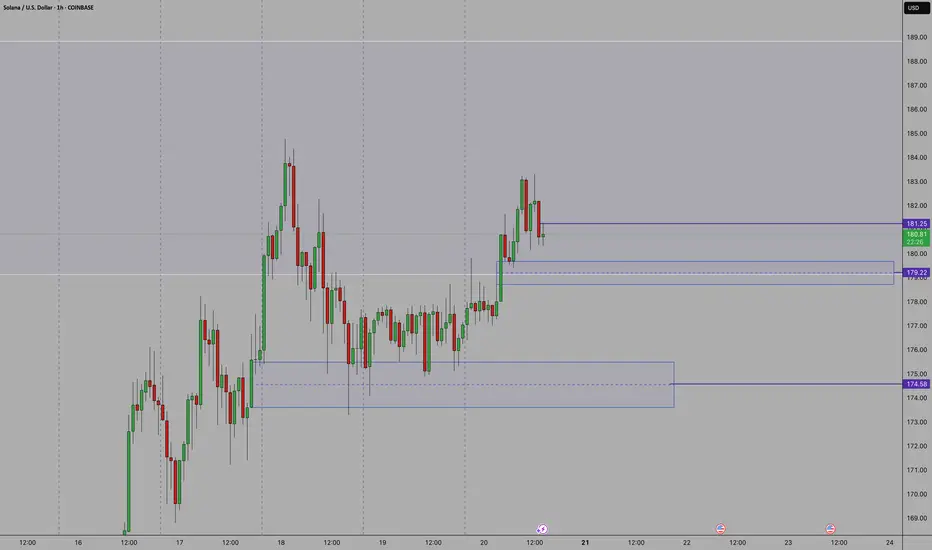
SOL/USD 4H📉 Price
Current price: approximately $183–$184
We see a decline from the resistance zone around $194.56. The price has broken through support at $187.31 and is heading towards lower support at:
🔴 $183.18 – local support (being tested now),
🔴 $175.58 – key support (potential target if current support breaks).
📊 Market structure
Short-term trend: Downtrend (lower highs and lower lows after a rebound from $194.56).
Volume: Increased volume on bearish candles – confirming supply pressure.
Previous trend: Uptrend with strong momentum from July 18th to July 21st.
🔁 Technical Levels
Resistance:
🟢 USD 187.31 – last broken support, now acting as resistance.
🟢 USD 194.56 – strong resistance (tested twice).
🟢 USD 206.43 – local high, strong resistance level from higher timeframes.
Support:
🔴 USD 183.18 – currently being tested.
🔴 USD 175.58 – stronger support from lower swing highs.
📉 Stochastic RSI
Located in the oversold zone (<20) and pointing down.
No upside crossover yet → no buy signal yet.
If a reversal occurs, a technical rebound is possible.
📌 Conclusions and Scenarios
🔻 Downside scenario (more likely currently):
Breakthrough of support at $183.18 ➜ further decline to $175.58.
Potential entry into a correction of the entire upward movement from July 18-21.
🔺 Upside scenario (alternative):
Support at $183.18 held + Stoch RSI signal ➜ rebound to $187.31.
If buying volume increases, a retest of resistance at $194.56 is possible.

SOLUSD – Topped Out or Holding ThinSOL topped out at $206 and now coils near the 200 SMA at $198. RSI at 36.38 is heavy but not diverging. Structure turning from trend to distribution unless $200+ gets reclaimed quickly. $198 is the last line of support. Break below and short trigger confirms.
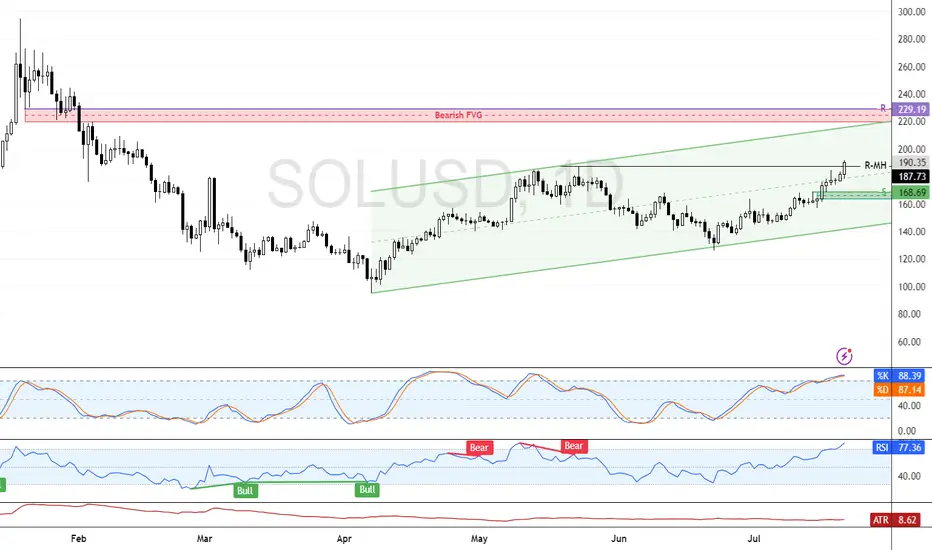
Solana Pullback May Offer Discounted Bull EntryFenzoFx—Solana exceeded the previous month's high at 187.7, while momentum indicators warn of an overbought market. The trend is bullish, but we expect a consolidation toward $168.6. This level can offer a discount price to join the bull market.
Solana/Ethereum Pair Flipping?$SOL/ CRYPTOCAP:ETH ratio may soon decline as Ethereum shows relative strength. ETH's new upgrade on scaling solutions and DeFi dominance could outpace Solana's momentum. Watch for ETH outperformance! #Crypto #Ethereum #Solana
Chart pattern is now showing a classic Elliot wave bearish ending diagonal pattern which will be confirmed when ratio breaks back below the prior all time high of 2022


SOLUSD longBullish Scalp trade. After Market opening I expect Price for another Bullish move after respecting the 50EMA
SOLANA Smart Money Breakdown 🔍 SOLANA (SOL/USD) Technical Analysis – July 18, 2025
Solana (SOLUSD) is currently reacting to a major resistance zone around the $185–$190 level, as shown in the chart. Price has rallied strongly from the support area near $130, breaking several market structures (BOS – Break of Structure) on its way up.
🧠 Smart Money Insight:
Multiple BOS events indicate strong bullish momentum that pushed price into a premium zone.
Current price action shows exhaustion near resistance, suggesting possible distribution.
🧱 Key Levels:
Resistance Zone: $185 – $190
Support Zone: $125 – $135 (untapped liquidity beneath)
Target Zone: $155 – $160 (where liquidity likely rests)
⚠️ Expectation:
A potential short-term retracement or pullback is expected toward the target area, as indicated by the downward arrow.
This aligns with a classic liquidity sweep setup, where smart money often engineers a false breakout before reversing.
📌 Conclusion:
If SOL fails to close strongly above the resistance zone, it could signal a reversal pattern toward lower support, offering an opportunity for short-term swing traders.
