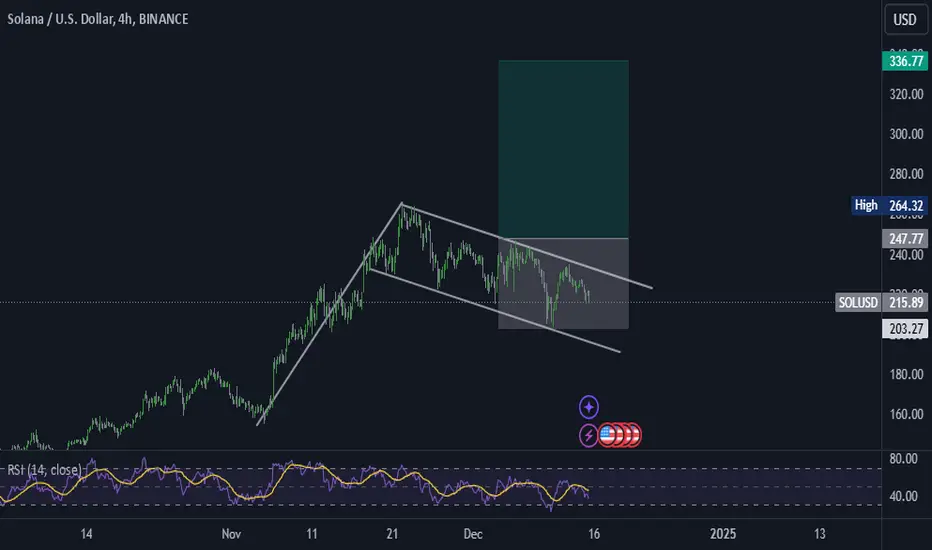
My Solana Idea in Bearish Scenario - Simple, Not ComplicatedHello there, this is a simple drawing which does have a bearish bias.
I wanted to draw the horizontal support and resistance levels given price history, identify any meaningful trend lines, and identify some criteria for invalidation of the bearish scenario.
I want Solana to pump as much as we all do - but I needed to try and validate my feelings here that getting out above $200 may be wise.
Enjoy.
SOLUSD.P trade ideas

SOLUSD – Bounce or Breakdown? Time to ChooseCurrently trading at 204.52, Solana’s sitting just above a key white box support zone between 193–203, which is shaping up as a strong bounce location. The upward trendline remains intact, keeping the bull thesis alive, but here’s the deal: lose support at 193, and things could get ugly fast. That 193 area aligns perfectly with the 0.236 Fibonacci retracement, making it a do-or-die level for the short-term bulls.
Right now, the setup is giving double-top vibes, and we need to see strength here. A breakout and close above the weekly ATH is the green light we’ve all been waiting for. Stay focused—SOL still has the fundamentals: a thriving ecosystem, killer tech, loads of users, and insanely low costs. Long-term, the outlook is solid as the blockchain itself. 🌱
But let’s not sugarcoat it—if we break 193, brace for impact. Expect aggressive downward pressure, with price likely testing the trendline and possibly wicking down to 157 (the 0.382 Fib retracement). That’s where buyers could step back in.
TL;DR:
Support: 193–203 (white box, 0.236 Fib).
Resistance: Weekly ATH needs snapping for continuation.
Bear Scenario: Below 193 → pressure to trendline, potential wicks to 157.
Bull Target: 411 long-term with an R:R of 5.4.
The uptrend is alive, but this is where SOL needs to show it’s got legs. Don’t sleep on the bounce, but manage your risk—because if it breaks, the fallout could be real. Keep your stops tight and your conviction tighter. 🧠📈

SOL Daily Downtrend Woes CRYPTOCAP:SOL BINANCE:SOLBTC CRYPTO:SOLUSD 50% retracement from ATH is around $132ish range.

Solana Solana two levels, I think 600 in q1-2
Then
200 in summer
Then
888 in q4
May the odds be in your favor.

SOLANA // idea for both directionsThe daily short countertrend is valid, and the market has reached the correction fibo 50 level.
The question is: will it reach 61.8?
If the market can significantly break the last clear H4 breakout significantly, it may have a chance.
If it turns up, and there is a significant (trigger) candle in the long trigger zone, my target is the weekly target fibo 200.
———
We may not know what will happen, but we can prepare ourselves to respond effectively to whatever unfolds.
Stay grounded, stay present. 🏄🏼♂️
Your comments and support are appreciated! 👊🏼

the market has sold!this is a perfect example on why we should not only focus on a strategy but also on fundementals

UptrendThe current uptrend has been retraced by over 25%. I see it as a possibility to buy back into the trend.
Perhaps the coin will fall back until the March high. But the trend will be still valid then.


FUBAR SOLWill Darthmaul unleash his poer on the SOL chart? IMO the whole markets looking week and SOL being the most used coin of the cycle topped and has been in a distribution phase. This is what my

SOL/USD: Will Solana Blast to $400 or Dive to $70?Hey Mindbloome Family, let’s talk about Solana—it’s at an important spot right now. Here’s how I see it playing out:
If Solana gets to $202, it could really take off and head for $400 or more.
If it dips to $155–$160, there’s still a chance it bounces back from there.
But if $155 doesn’t hold, we might see a deeper drop to $65–$70.
Wellness Tip: Remember, it’s not just about trading—taking a short break or stepping outside for some fresh air can help you stay sharp and focused.
If you’ve got questions or want to chat more about this setup or trading in general, check out my profile or send me a DM. I’m here to help and share what I’ve learned.
Kris/Mindbloome Exchange
Trade What You See

SOL broke out of descending channelSOL broke out of the descending channel a few weeks ago but failed. However it’s now breaking out again and using the top of the descending channel as support. We should see higher lows from here

SOL - Falling Wedge BreakoutPlease Refer to our previous post:
After we broke the previous high on the line chart we drew a yellow line at $202 and said long any retests of this line. On the altcoin flash crash, SOL perfectly retested our yellow line and is up almost 15% from the retest!
Now we can see price has been squeezing in between a falling wedge pattern. Right now SOL is testing the top of the trendline. If we can start seeing 12H candles close above this top line, SOL will have broken out and will be visiting new all time highs.

$SOL Breakout could be soon, 3 Opportunities SOL Has been consolidating since Mid-December, and now it could be gearing up for a bullish continuation to the upside.
I have provided three potential paths for the chart, red being most degenerate, and green being the best long opportunity in my eyes. If SOL was to retest the range lows, it would be a beautiful setup for a long, but I don't think it is likely to happen, nor do I expect the red path to happen. Yellow, a breakout and retest of the current channel, would set us up well in the macro timeframe, with a potential scalp short when we near the POC at $240.3 USD
Key Points:
- 50D SMA- SOL is pushing to reclaim the 50D SMA, ~$228, if it gets to $228 I think one could go long with a stop loss at $223
- 100D SMA- $233, given the momentum on the short term, I think if SOL reclaims the 50D, it is likely to take the 100 as well as potentially push to range highs near $263 with a potential short scalp at the POC @$237.2
NFA DYOR Let me know your thoughts

sol short term tradeCOINBASE:SOLUSD According to my analysis sol is going up towards all time high .
what do you all think about this trade

SOLANA is forming a nice pattern!SOLANA is forming a nice pattern on the Daily chart and will break out soon!

Is Solana entering bearish mode? Let's find out!After marking itself as one of the top chains, Solana has gained huge attention, which has now become the home for developers too. This has made the investors more confident and optimistic about the SOL price. As per some data, Solana’s long-term asset retention rates have increased notably. With this, the market participants now expect a significant rise in the token’s value in the months ahead.
The SOL price is holding one of the pivotal levels around $216 as support, which has offered a strong base throughout the past week. Although the bulls are trying to keep up the rally, the growing upward pressure is weakening them. Hence, defending these levels could be extremely crucial, which may help the tokens to close the yearly trade on a bullish note.
In the larger timeframe, the SOL price has completed a massive cup & handle pattern and also a retest after breaking the neckline. Therefore, now it appears to be pretty obvious that the token may now trigger a strong rebound. However, the drop in the buying pressure, as indicated by MACD, raises some concerns as the volume has also dropped to some extent. Moreover, the levels display a potential bearish crossover, which could worsen the SOL price rally by dragging it below the crucial support.
On the other hand, the +Di & -Di of DMI were heading towards a bearish crossover, but both have halted and are trying for a bullish reversal. Besides, the ADX, which records the strength of the rally, is rising. Therefore, the price is believed to hold support at $216 and trigger a rebound, which could pave the way for a new ATH above $400. In case of a failure, then the Solana (SOL) is feared to drop below $200, which is unlikely with the growing bullish sentiments within the markets.

SOLANA BULL FLAG BULLISH MOMENTUM!!!!The Solana (SOL/USD) chart shows a Bullish Flag pattern, which is a continuation signal that forms after a strong upward move (flagpole) followed by a short period of consolidation in a downward-sloping channel (flag). The yellow trendlines mark this consolidation area, and if the price breaks out above the resistance line, there's a solid chance for a big move up. The target is calculated based on the length of the flagpole, with a potential gain of 58.68%, aiming for around $311.17 (Fibonacci 161.80%). If the bullish momentum continues, the next target is $366.55 (Fibonacci 224.00%). The green zone highlights the reward potential, while the stop-loss at $182.64 limits risk to 6.62%, giving a solid risk-to-reward setup. With the main trend still bullish and strong support near $195.59, a breakout could signal the continuation of Solana's uptrend. 🚀 #Solana #BullishFlag #CryptoAnalysis #SOLUSD #Trading

Solana LongNice channel has been forming lately , a breakout from this range ,and solana starts climbing towards 400$ region to 500$ .
Things looking good lately , especially with dominance which soon will start going down and this will be a perfect play.
Long and strong .
Nothing is over .
We have just started.

SOL/USD "SOLANA" Crypto Market Heist Plan on Bearish Side🌟Ola! Bonjour! Hi! Hallo!🌟
Dear Money Makers & Robbers, 🤑 💰
Based on 🔥Thief Trading style technical analysis🔥, here is our master plan to heist the SOL/USD "SOLANA" Crypto market. Please adhere to the strategy I've outlined in the chart, which emphasizes short entry. Our aim is the high-risk Green Zone. Risky level, oversold market, consolidation, trend reversal, trap at the level where traders and bullish robbers are stronger. 👀 So Be Careful, wealthy and safe trade.💪🏆🎉
Entry 📉 : You can enter a trade anywhere,
however I advise placing sell limit orders within a 15 or 30 minute timeframe. Entry from the most recent or closest high level should be in retreat.
Stop Loss 🛑: Using the 2H period, the recent / nearest high level.
Goal 🎯: 192.00
Scalpers, take note : only scalp on the Short side. If you have a lot of money, you can go straight away; if not, you can join swing traders and carry out the robbery plan. Use trailing SL to safeguard your money 💰.
Warning⚠️ : Our heist strategy is incompatible with Fundamental Analysis news 📰 🗞️. We'll wreck our plan by smashing the Stop Loss 🚫🚏. Avoid entering the market right after the news release.
Take advantage of the target and get away 🎯 Swing Traders Please reserve the half amount of money and watch for the next dynamic level or order block breakout. Once it is resolved, we can go on to the next new target in our heist plan.
💖Supporting our robbery plan will enable us to effortlessly make and steal money 💰💵 Tell your friends, Colleagues and family to follow, like, and share. Boost the strength of our robbery team. Every day in this market make money with ease by using the Thief Trading Style.🏆💪🤝❤️🎉🚀
I'll see you soon with another heist plan, so stay tuned 🫂

Solana: Bullish Flag Formation Signals Potential RallySolana is exhibiting a bullish flag formation, indicating potential for an upward rally. Additionally, a bullish divergence is observed on the 1-hour time frame, further supporting the likelihood of a price increase.
SOLSomeone come look at this.... Have you seen the SOL/BTC.. After looking at this, go look at that.. Your welcome.. Its like ETH in 2020/2021.... NOT ADVICE..

SOL_The chart speaks for itselfYou know what to do.
Just be patient for a confirmed breakout.
TP levels are on the chart.
NFA

What should we do with $SOLCRYPTOCAP:SOL has now completely completed its correction after possibly 3x an upward wave.
Together with the correction and bull flag resistance was found on the demand zone. I also expect a definitive breakout for the bull flag and a retest from this.
After this, we may be ready for an attack on a new ATH.
Although Bitcoin may make a small correction, I don't think CRYPTOCAP:SOL will really respond to this. Always be careful with your trade.
Be kind to the world and each other.
