SOLUSD.P trade ideas

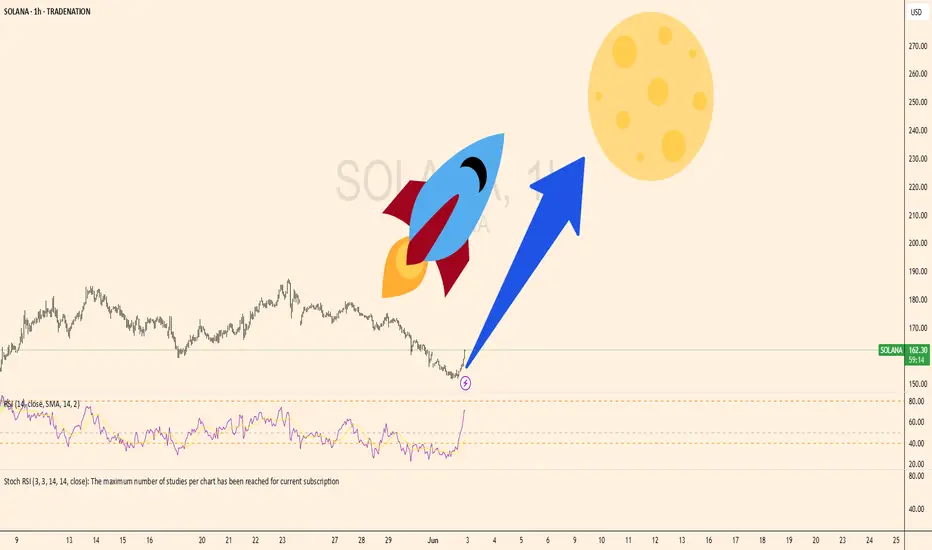
Solana to the moonfor taday's position , i went long on soalana, as it shows a key level at this price 158 ;
the profit percentage for the TP1 is way begiier that my risk; willing to have a 5 to 1
and if the trend continue, i will raise the lot until 187 as a TP3

SOLUSD 162 TargetMACD histogram has flipped green → early strength. bearish divergence, 162-167 possible.

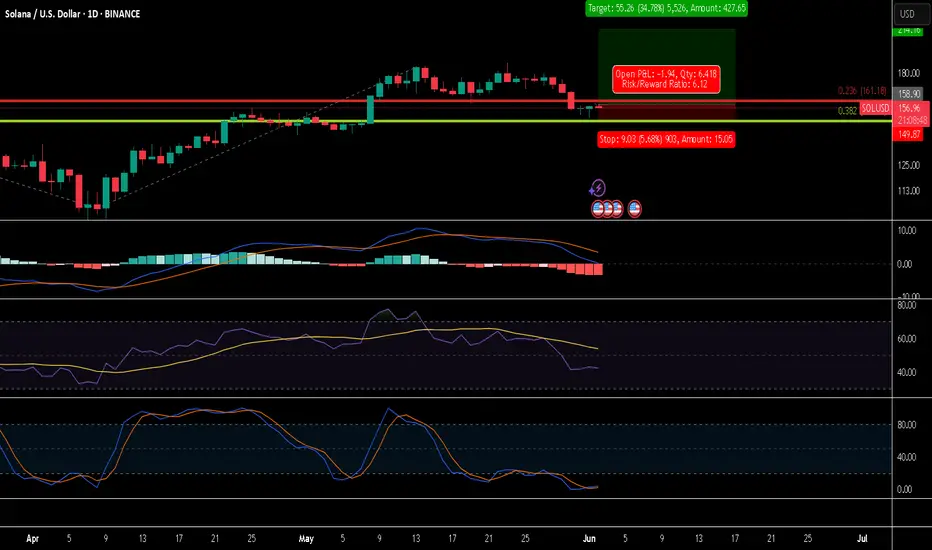
Open long when this happens...My bias for Solana is very bullish. But the current price set up is very similar to April 2022 when the price started to have a major downside move. (See blue vertical line in the chart)
Similarities between April 2022 and today's chart set up in the daily chart:
1) The price moved from the peak (Historical all time high) to trough in the descending parallel channel over four months.
2) The price finally moved out of the the channel and decisively moved up to the major support resistance line (see red horizontal line)
3) Both RSI and MACD have moved way above the overbought territory and the lines are crossed to the downside.
4) EMA21 has crossed above EMA 55, but the EMA200 is still above EMA21 and 55.5) The price has moved and closed above all EMAs but it is pulling back.
I have already finished spot buying at a much lower price point, but I am now looking for a long trading opportunity if the parabolic run is going to happen.
The set-ups for a long trade that I am waiting for are:
1) EMA 22 and EMA 55 are to move above EMA 200.
2) The price to pull back to EMAs and move up and close above EMA 21.
3) RSI and MACD to come back to at least 0 if not below 0 and start to move to the upside.
The set up where the orange vertical line in the chart is a good example of a sort of entry set up described above.

How low can Solana go?SOL is potentially creating a local low around $150. If buyers step in and price holds these levels, we could see a reversal, reclaiming previous support around $160.
A rejection from $160 and breaking this week's lows ($150) could signal a retest of previous levels from $130 - $140.
My personal instinct is still weary of the fact that price has been rejected twice from the 1D 200MA, potentially signaling even further weakness for SOL.

Will Solana continue to grow?I am definitely admittedly late to the party with Solana. Though I was very correct about the ride down to $8 and did not own any Solana for that. I was also wrong about The Return of Solana.
During the ride down from ~$300 to ~$100 I was able to get some Solana. Though most of it is liquid staked Solana now.
As seen in the image I think currently what makes the most sense is this being a pullback of the last rally in Solana.
I think focusing on daily Stoch RSI is more interesting currently then MACD and RSI. Looking to stay above 0.382 FIB above while also seeing Stoch RSI move up. If either of those fail then my current thinking must be reconsidered. As I am looking at typically weekly/daily spot moves the risks are different then people using leverage. Even if I use really small amounts of leverage to get 1.01, 1.10, etc. returns but not 10x leverage as an example.
Pros
Solana is seeing a lot of use
VC investors are likely try and push Solana to their peers, friends, etc.
Drift seems to have more feature as a DEX then most of what I have seen on Ethereum and ETH L2's. Especially spot Pro Orders is really interesting feature that I don't see anywhere else.
Solscan was total garbage previously but it seems better then Etherscan now. Like the kept adding feature and Etherscan did not change much. Look at Analytics and Portfolio tabs.
Raydium is another interesting DEX. Portfolio page has nice UI.
Focus on working products rather then design theory and posturing about ideal world setup.
If retail feels like they missed out on Bitcoin buying Solana seems like a likely path.
Cons
Pump fun was a lot of the network activity
Not seeing enough content on using Solana Apps
Does not have the same decentralization and other crypto principles built into the community that Ethereum has. While short term it's a pro long term if your not careful where your going you can end up where you don't want to be.
Not financial advice. DYOR.
Solana Stock Chart Fibonacci Analysis 060125Trading Idea
1) Find a FIBO slingshot
2) Check FIBO 61.80% level
3) Entry Point > 153/61.80%
Chart time frame:B
A) 15 min(1W-3M)
B) 1 hr(3M-6M)
C) 4 hr(6M-1year)
D) 1 day(1-3years)
Stock progress:A
A) Keep rising over 61.80% resistance
B) 61.80% resistance
C) 61.80% support
D) Hit the bottom
E) Hit the top
Stocks rise as they rise from support and fall from resistance. Our goal is to find a low support point and enter. It can be referred to as buying at the pullback point. The pullback point can be found with a Fibonacci extension of 61.80%. This is a step to find entry level. 1) Find a triangle (Fibonacci Speed Fan Line) that connects the high (resistance) and low (support) points of the stock in progress, where it is continuously expressed as a Slingshot, 2) and create a Fibonacci extension level for the first rising wave from the start point of slingshot pattern.
When the current price goes over 61.80% level , that can be a good entry point, especially if the SMA 100 and 200 curves are gathered together at 61.80%, it is a very good entry point.
As a great help, tradingview provides these Fibonacci speed fan lines and extension levels with ease. So if you use the Fibonacci fan line, the extension level, and the SMA 100/200 curve well, you can find an entry point for the stock market. At least you have to enter at this low point to avoid trading failure, and if you are skilled at entering this low point, with fibonacci6180 technique, your reading skill to chart will be greatly improved.
If you want to do day trading, please set the time frame to 5 minutes or 15 minutes, and you will see many of the low point of rising stocks.
If want to prefer long term range trading, you can set the time frame to 1 hr or 1 day.

Solana Long entry After a 100% move to the upside Solana is slowly cooling off its run and heading back down to some key areas of support .
In this video I highlight where I think those reaction zones are and what I expect to see Long term from Solana .
Set alerts and be sure to monitor BTC which will give you the additional confluence of understanding why the alt coins are behaving Bearish/bullish.
Tools used in this video TR Pocket / Fibs / Volume Profile /
Any Questions feel free to ask in the comments

SOL Local Elliot Wave ii UnderwaySolana appears to have completed a motif wave 1 after finding a bottom at the major support high volume node (HVN) macro wave 4.
Wave 2 has not retraced as deep as other alt coins showing strength in the move up. The downside target is the HVN at $140 at the 0.5 Fibonacci Retracement.
Wave 3 should be a powerful move up taking price into all time high.
Failure to hold this support could see price heading back to fresh lows and testing the $90 HVN once more.
Safe trading

SOL/USD – Solana is Sitting on a Major Decision Point! Solana just tapped into a high-volume demand zone between $152 – $160, where buyers previously defended price. Volume is rising as we test this key area again. This could be the final flush before a move higher.
---
🔍 What’s Likely Next?
🔼 Bullish Outlook:
If SOL holds above $152.86, watch for a bounce to $168.51, followed by a potential break toward $183.18 where the supply zone is waiting.
🔻 Bearish Breakdown:
A close below $152.86 could trigger more selling, especially with USD-based volatility ahead (watch the macro events between June 3–7).
---
🧠 Market Psychology:
We’ve seen multiple rejections near $183, but also strong accumulation on dips. This looks like a textbook Wyckoff-style accumulation phase. Smart money could be loading up before the next leg.
---
🎯 My Trading Plan:
✅ Entering long at demand zone
🎯 Targets: $168.5 and $183+
❌ Stop loss: Just below $152
---
💬 Your Turn!
Do you see a bounce coming or will SOL drop further from here?
👇 Share your analysis in the comments!
🔁 Like & Follow @FrankFx14 for more powerful setups like this one daily!
---
#SOL #Solana #Altcoins #CryptoTrading #TradingView #TechnicalAnalysis #LuxAlgo #PriceAction #BuyTheDip #CryptoSignals

Technical analysis of Solana/USDCurrent Price and Trend:
* The current price is $154.84, which is a decrease of $1.38 or -0.88%.
* The chart shows a clear symmetrical triangle formation in the price action. This typically indicates a period of consolidation and indecision before a significant move in either direction.
Key Levels and Potential Scenarios:
Bullish Scenario (Breakout to the Upside):
* Buy Zone: The "BUY" button is currently at $154.84, indicating a potential entry for a long position around this level if the price breaks above the triangle's upper resistance.
* Resistance: The upper trendline of the symmetrical triangle acts as immediate resistance.
* Target: A potential "Target" is marked at approximately $157.58. This target is derived by projecting the height of the triangle from the breakout point. This suggests a significant upward move is anticipated if the breakout occurs.
Bearish Scenario (Breakdown to the Downside):
* Sell Zone: The "SELL" button is also at $154.84, suggesting a potential entry for a short position if the price breaks below the triangle's lower support.
* Support: The lower trendline of the symmetrical triangle acts as immediate support.
* Stop Loss: A stop-loss zone is indicated between approximately $154.61 and $154.91 (marked in red). This is a crucial level to protect against further losses if the trade goes against the intended direction.
* Target: A potential "Target" is marked at approximately $152.13. This target is derived by projecting the height of the triangle downwards from the breakdown point. This implies a notable downward move is expected if a breakdown occurs.

Red Sea as Sellers Overcomes Buyers pishing price downUS has been seeing momentum through this Trade War fueled by Trump,Solana Coin has fallen as Predicted 💯💰

Quick Short expected until reaching the support areaHi Family. Here is a quick Short expectation from my perspective, until reaching the support area arount 165-164.
Please trade carefully using stop loss
Big up, no financial advice ! Make your own decision and risk management

Technical InsightsAnalysts have identified a potential "cup-and-handle" pattern in SOL's price chart, suggesting a possible rally towards $4,500 if the pattern completes successfully.

SOL/USDT - Bullish setup signal (Multi-Timeframe-Confluence)Bullish bias for SOL based on falling wedge breakout potential supported by favorable multi-timeframe EMA alignment
Falling Wedge pattern detected on the weekly chart
✅ EMA (20) Levels
Daily EMA(20): 170.17
Weekly EMA(20): 162.80
Monthly EMA(20): 144.53
✅ RSI crossing/holding above 50 on daily
🎯 Trade Plan Idea:
Entry: Around 170.17
Stop-loss: Below wedge low or under 162.80 (Weekly EMA)
Target Zones:
179-180 — first key resistance
190.00–200.00 — wedge measured move target
Not financial advice.

SOL/USD 4H – Rejection Zone Confirmed?Solana is currently testing a key supply zone around $174-$175, with repeated rejection signals forming at this level. This range coincides with a visible range high-volume node, indicating strong resistance from previous price memory.
---
🔑 Key Levels:
🔵 Resistance Zone: $173.80 – $175.30 (heavy supply)
🟦 Mid-Range Support: $141.50 – previously a strong flip zone
🟫 Demand Zone: $103 – $116 (historical demand, strong buying interest)
---
🔁 Market Structure:
Price has rallied significantly from March lows near $100.
The current price action is consolidating below resistance, with bearish wicks suggesting exhaustion.
A potential double top may be forming at this resistance.
---
📉 Bearish Scenario:
If SOL breaks below $170 with strong volume: ➡️ First Target: $141.50 (previous support)
➡️ Second Target: $116.40
➡️ Final Support: $103 demand zone
---
🔍 Watch For:
✅ Bearish confirmation candle closing under $170
✅ Increase in sell volume
✅ MACD/RSI divergence (check your indicators)
✅ Economic catalysts (FOMC, CPI, etc. due in early June as shown with US flags)
---
🔄 Bullish Invalidation:
A clean breakout and close above $175.50 with volume could invalidate this short thesis and potentially lead to a continuation toward $190+.
---
📢 What do you think? Will SOL dump or pump from here?
🧠 Drop your thoughts and setups in the comments!
❤️ Like & Follow for more TA like this every week!
#Solana #SOLUSD #CryptoTrading #SupplyAndDemand #LuxAlgo #BearishReversal #PriceAction #SwingTrading #Altcoins #TradingView

SOLUSD : Update Using 30 min chart. 🔍 Solana (SOLUSD) – Confluence Analysis (30-Min Chart)
This chart represents a bullish confluence zone backed by Smart Money Concepts (SMC), Fibonacci levels, Fair Value Gaps (FVGs), and Order Blocks. Here's a detailed breakdown of the confluence logic:
🔑 Key Confluences:
1. FVG and OB Reclaim in Premium Zone
Price reclaimed a premium FVG zone (between ~$175.70 and $177.30).
This reclaim, combined with the Bullish CHoCH and BOS structure, signals institutional interest.
A retest of this zone is likely to act as a springboard toward the next premium levels.
2. Fibonacci Confluence
Multiple Fibonacci levels are stacked:
0.618 - 0.786 retracement zone aligned with equilibrium near $176–177.
1.618 extension target at $187.53.
2.618–4.236 long-term extensions project a move toward $205.06–$211.85.
This supports a measured move projection of:
🎯 Target 1: $184
🎯 Target 2: $205–211 (21.83% gain from current level)
3. Equilibrium & Discount Zone
Price bounced from the discount zone and retested the equilibrium.
Indicates ideal entry area from Smart Money Concepts (where institutions load up).
Yellow box ($168.51–$175.70) marks optimal risk-reward entries.
4. Volume Confirmation
Rising volume beneath the bullish candle structure adds validity to the breakout potential.
5. ORB (Opening Range Breakout) Bias
Label "ORB (15, 0930-0945)" implies a bullish ORB setup, likely used to structure intraday momentum.
If today’s open maintains above $175.70, the ORB bias confirms upside continuation.
🧠 Summary:
Component Value
Current Price $177.32
Entry Zone $175.70–$177.30 (Equilibrium/FVG)
Invalidated Below $168.51 (OB/SMC invalidation)
Target 1 (TP1) $184.00
Target 2 (TP2) $205.06–211.85 (Fib/SMC)
Reward:Risk (est.) 5.3R (if SL near 168.5, TP near 205)
✅ Trade Plan (Hypothetical)
Entry: $175.70–$177.30
Stop Loss: $168.00 (below OB + structural invalidation)
Take Profit:
TP1: $184
TP2: $205.06
TP3 (Fib 4.236): $211.85
📘 Macro Note:
If BTC maintains risk-on momentum and SOL holds above $175, this setup has high confluence for continuation into mid-$180s, with $200+ psychological magnet likely if macro liquidity improves.

2 Year Pivot PongSOL and many other crypto coins often react at pivot points. I use 1-year (Thinnest), 2-year (medium), and 3-year (Thickest) pivot points for trade entries and targets.
For this trade, the negative linear regression trend on the 2-day is ending as the yellow line at the bottom of the linear regression trend has terminated as it approaches the middle moving average in the Fibonacci Bollinger band. Typically, I would enter trades in the bottom half of the Bollinger band area but SOL is in such demand it rarely ever gets below the mid point.
You can see that SOL heavily reacts to the 2-year pivots as indicated in the circled areas. I am using the current price for a long entry.
The target price is $267, which is the next resistance level of the 2-year pivot points. At $267, a trailing stop will trigger, which will allow the price to run further while locking in gains we've already made when there are retracements.
Risk management:
I am setting a stop loss at $150, just below the 3-year pivot and the Bollinger MA, which are both acting as support and should move the price upward on any retracement from current levels.

Weekly trading plan for Solana In this idea I marked the important levels for this week and considered a few scenarios of price performance
The price is near the Pivot point, we can also see a trend line from which the price has already bounced, so if it is broken, we can expect a deep correction
Write a comment with your coins & hit the like button and I will make an analysis for you
The author's opinion may differ from yours,
Consider your risks.
Wish you successful trades ! mura

compression at Demand KRAKEN:SOLUSD The 3Drive approach on our Demand Managed to push price up to our supply. THE buyers momentum seems significant that we might anticipate A breakout to the top on our Hourly Supply

Solana(based on NEowave)I consider this as a triangle but under the price zone which is 139 it tells us its going to make a diamond diametrical.

When will Solana breakout? SOL is holding above support around $166, potentially heading for a test of local highs around $185. A strong break and close above could signal a push towards $190 - $200.
For the time being, Solana has also yet to reclaim its 1D 200MA which could also be signalling some weakness, or lack of strength rather, in the short-term.
Reclaiming $166 on 21 May could've confirmed it as support for a push towards higher prices.
Considering that SOL is nowhere near its ATHs and assuming continued bullish market momentum, one could be very optimistic about its potential.
However, from being a market leader to lagging so far behind BTC, I fear that it might not make a significant ATH in this cycle - assuming this year is all we have left.
I hope I'm wrong about that, haha.
