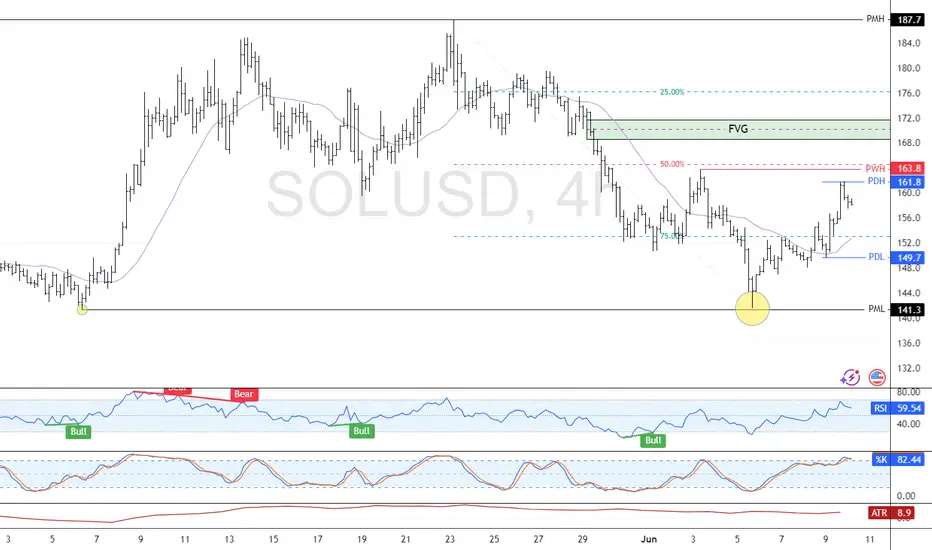
Solana: Bearish Outlook Between $163.8 and $170.FenzoFx—Solana formed a double bottom at $141.3, making this level a target. We are bearish on Solana between the $163.8 and $170.0 resistance.
The target is $149.7, followed by $141.3.
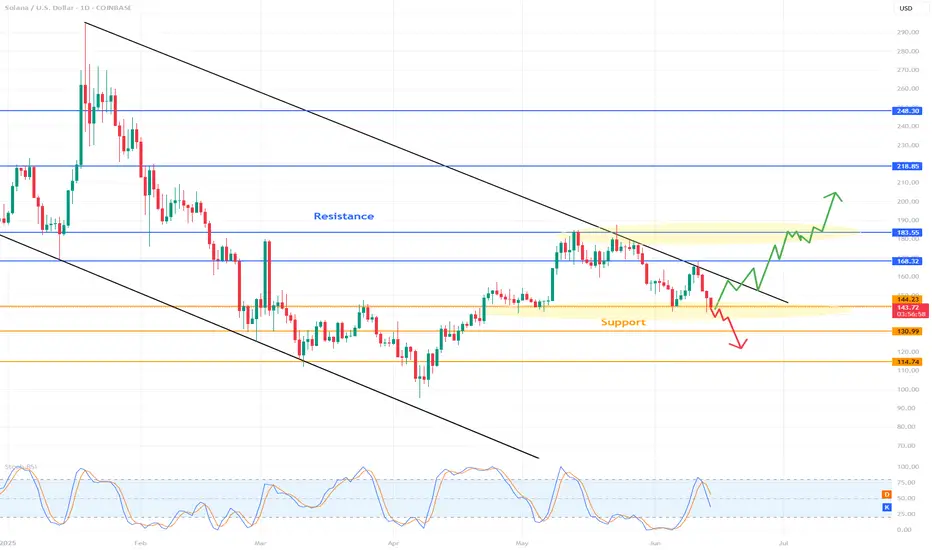
SOLUSD 1D Chart Review1. Main Trend
Downward Channel: Price moving in wide, downward channels (black trend lines), which means that the medium and long term remains bearish.
The upper trend line is a strong dynamic resistance, the lower one – support.
2. Key Horizontal
Resistance (Resistance):
$168.32: Strong resistanc
Solana H4 | Potential bounce off 50% Fibonacci supportSolana (SOL/USD) is falling towards an overlap support and could potentially bounce off this level to climb higher.
Buy entry is at 140.92 which is an overlap support that aligns with the 50.0% Fibonacci retracement.
Stop loss is at 122.00 which is a level that lies underneath an overlap support.

SOLUSD AnalysisFollowing the recent geopolitical tensions between Israel and Iran, we saw a sharp sell-off, which broke down from a key support zone. Currently, price action is consolidating within a rising wedge (bearish structure) on declining volume.
The trend remains bearish overall. I expect a potential reli

Solana reversalCurrently, the stochastic oscillator shows an oversold situation for Solana, despite the price reversal. The price is moving on a curved support line with a short-term target of $180.

Weekly trading plan for Solana Solana looks weaker against BTC & ETH, but still the price is above PP and we can expect continued growth either now or after a local correction as long as the price is above PP
Write a comment with your coins & hit the like button and I will make an analysis for you
The author's opinion may diffe

BULLISH SOLANAI am Bullish From $147.00 with stop loss at $110.
Price has retraced 50% from 7 April LOW to 23 May High Fibo Levels. With A good fundamental backing from the US jobs/Labour reports it seems that we might have a bottom in play an also good buy entries for solana. (RISK APPETITE)
My view on solana

Solana Wave Analysis – 9 June 2025
Solana: ⬆️ Buy
- Solana reversed from the support zone
- Likely to rise to the resistance level 163.80
Solana cryptocurrency recently reversed up from the support zone between the key support level 141.65 (which has been reversing the price from April), lower daily Bollinger Band and the 50% Fib

Boom📉 SOLUSD Reversion Entry – Capturing the Recovery
This chart shows a textbook example of how the ELFIEDT RSI + Reversion Strategy can help identify panic-driven lows and offer early reversal signals for a clean intraday recovery.
⸻
🟢 Signal Breakdown:
1. Sharp Drop into Oversold Territory
Solana

SOLANA SOL/USD Here's an important fan which shows me all the supports and resistances. Depends on the short-term move we'll realize the future. Ok thanks I'll try and call me back in time to see what the sho and I have no clue I think we

See all ideas
Summarizing what the indicators are suggesting.
Oscillators
Neutral
SellBuy
Strong sellStrong buy
Strong sellSellNeutralBuyStrong buy
Oscillators
Neutral
SellBuy
Strong sellStrong buy
Strong sellSellNeutralBuyStrong buy
Summary
Neutral
SellBuy
Strong sellStrong buy
Strong sellSellNeutralBuyStrong buy
Summary
Neutral
SellBuy
Strong sellStrong buy
Strong sellSellNeutralBuyStrong buy
Summary
Neutral
SellBuy
Strong sellStrong buy
Strong sellSellNeutralBuyStrong buy
Moving Averages
Neutral
SellBuy
Strong sellStrong buy
Strong sellSellNeutralBuyStrong buy
Moving Averages
Neutral
SellBuy
Strong sellStrong buy
Strong sellSellNeutralBuyStrong buy
Displays a symbol's price movements over previous years to identify recurring trends.
Curated watchlists where SOLUSD.PM is featured.

Gen 3 crypto: A new day dawns…
25 No. of Symbols

Smart contracts: Make the smart decision
36 No. of Symbols

Staking Coins: Pick up a stake
18 No. of Symbols

Top altcoins: Choose your alternatives carefully
28 No. of Symbols

Up-and-coming crypto: New kids on the block
30 No. of Symbols
See all sparks