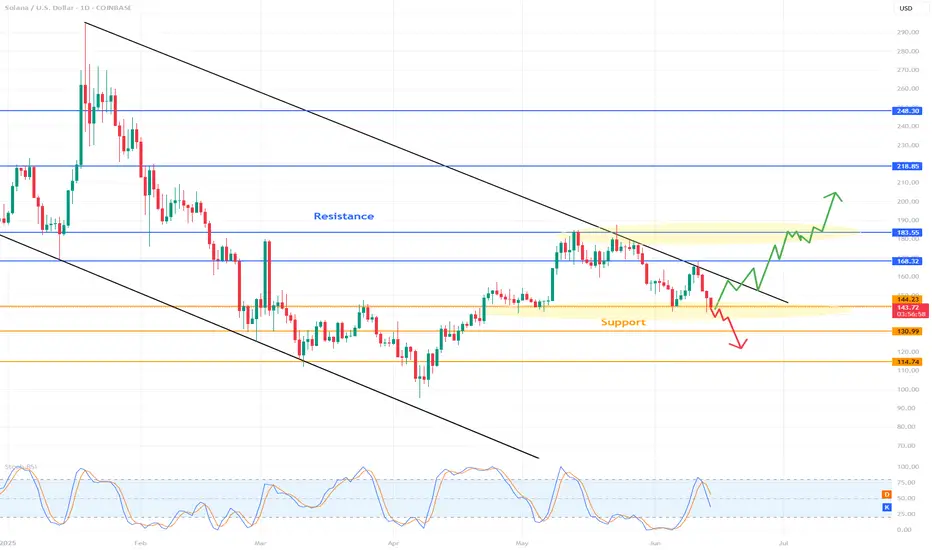
SOLUSD 1D Chart Review1. Main Trend
Downward Channel: Price moving in wide, downward channels (black trend lines), which means that the medium and long term remains bearish.
The upper trend line is a strong dynamic resistance, the lower one – support.
2. Key Horizontal
Resistance (Resistance):
$168.32: Strong resistanc
Key facts today
Key stats
About Solana
Solana is a blockchain fairly new to the crypto game, but that's not to say it's not a serious player. Attempting to rival smart-contract titan Ethereum for the NFT and web3 crown, Solana has a strong focus on scalability through its hybrid proof-of-history/proof-of-stake consensus that aims to accommodate a flourishing dApp ecosystem. Its native token SOL has enjoyed the successes of Solana-based NFTs and dApps, but since its inception has also felt the strain of the network’s tendency to experience outages. Although that hasn't stopped it from reaching the top 15 coins by market cap.
Related pairs
SOL/USDT at Key Inflection Point – Breakout or Rejection?Solana (SOL) is trading at a pivotal zone where price structure, harmonic patterns, and key technical indicators converge. This setup outlines three potential scenarios, guided by fib levels, auto trendlines, and momentum indicators.
Orange Scenario (Moderate Bullish):
Price has recently bounced of

Solana (SOLUSD) 4H Analysis – Rejection From Demand ZoneSolana is showing strong signs of accumulation after tapping a key 4H demand zone. Price is now stabilizing above $146 and may be preparing for a bullish push toward key resistance levels.
📌 Key Technical Highlights:
🔸 Strong Demand Zone – $146.92 to $140.00:
This orange zone has served as a launc

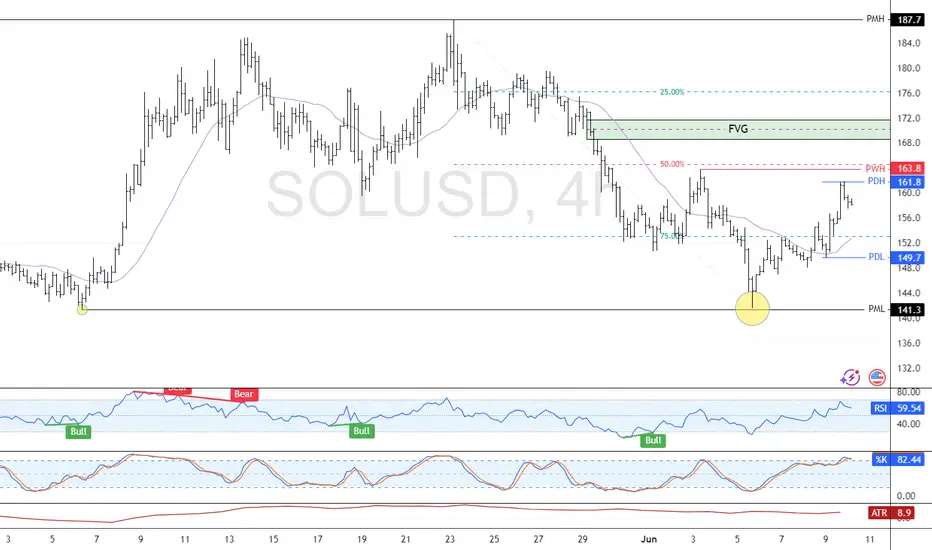
Solana: Bearish Outlook Between $163.8 and $170.FenzoFx—Solana formed a double bottom at $141.3, making this level a target. We are bearish on Solana between the $163.8 and $170.0 resistance.
The target is $149.7, followed by $141.3.
SOLUSD AnalysisFollowing the recent geopolitical tensions between Israel and Iran, we saw a sharp sell-off, which broke down from a key support zone. Currently, price action is consolidating within a rising wedge (bearish structure) on declining volume.
The trend remains bearish overall. I expect a potential reli

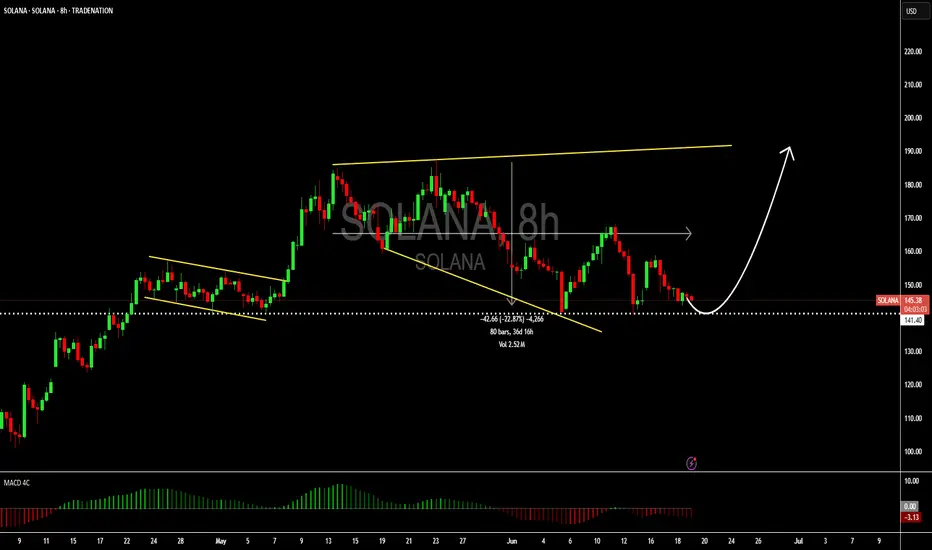
Solana: Still bullish about this cryptoHello,
I see the current price is at a great value price for Solana investors. The market has corrected by over 22% over the recent 36 days. The MACD is also showing signs of bullish zero crossover further reinforcing that the price is at a good place for bullish investors to begin coming in.
We u
Daily EMA 55 needs to move above EMA 200!!
My general bias for Solana is bullish. However, the current setup is very similar to the setup in Feb-Apr 2022 before Solana started a macro bear trend. (see blue rectangular box)
I am still waiting for a long trade opportunity. I am not looking for a short trade. I just need to sit tight an

SOLUSD – Eroding Support, Soft Fade ModeSolana rejected from just above $150 and has been sliding gradually. Price is forming a descending channel, and intraday momentum remains weak. Support near $145 is being tested frequently, suggesting that buyers are losing strength. Expect either a breakdown below $145 or a bounce that will be crit

SOL/USDT at Key Inflection Point – Breakout or Rejection? Part 2Solana (SOL) is trading at a pivotal zone where price structure, harmonic patterns, and key technical indicators converge. This setup outlines three potential scenarios, guided by Fibonacci levels, auto trendlines, and momentum indicators.
Green Scenario (Confirmed Bullish Continuation)
A sustained

Boom📉 SOLUSD Reversion Entry – Capturing the Recovery
This chart shows a textbook example of how the ELFIEDT RSI + Reversion Strategy can help identify panic-driven lows and offer early reversal signals for a clean intraday recovery.
⸻
🟢 Signal Breakdown:
1. Sharp Drop into Oversold Territory
Solana

See all ideas
Displays a symbol's price movements over previous years to identify recurring trends.
Curated watchlists where SOLUSD is featured.

Gen 3 crypto: A new day dawns…
25 No. of Symbols

Smart contracts: Make the smart decision
36 No. of Symbols

Staking Coins: Pick up a stake
18 No. of Symbols

Top altcoins: Choose your alternatives carefully
28 No. of Symbols

Up-and-coming crypto: New kids on the block
30 No. of Symbols
See all sparks
Frequently Asked Questions
Solana (SOL) reached its highest price on Jan 20, 2025 — it amounted to 272.141 USD. Find more insights on the SOL price chart.
See the list of crypto gainers and choose what best fits your strategy.
See the list of crypto gainers and choose what best fits your strategy.
Solana (SOL) reached the lowest price of 7.447 USD on Dec 28, 2022. View more Solana dynamics on the price chart.
See the list of crypto losers to find unexpected opportunities.
See the list of crypto losers to find unexpected opportunities.
The safest choice when buying SOL is to go to a well-known crypto exchange. Some of the popular names are Binance, Coinbase, Kraken. But you'll have to find a reliable broker and create an account first. You can trade SOL right from TradingView charts — just choose a broker and connect to your account.
You can discuss Solana (SOL) with other users in our public chats, Minds or in the comments to Ideas.