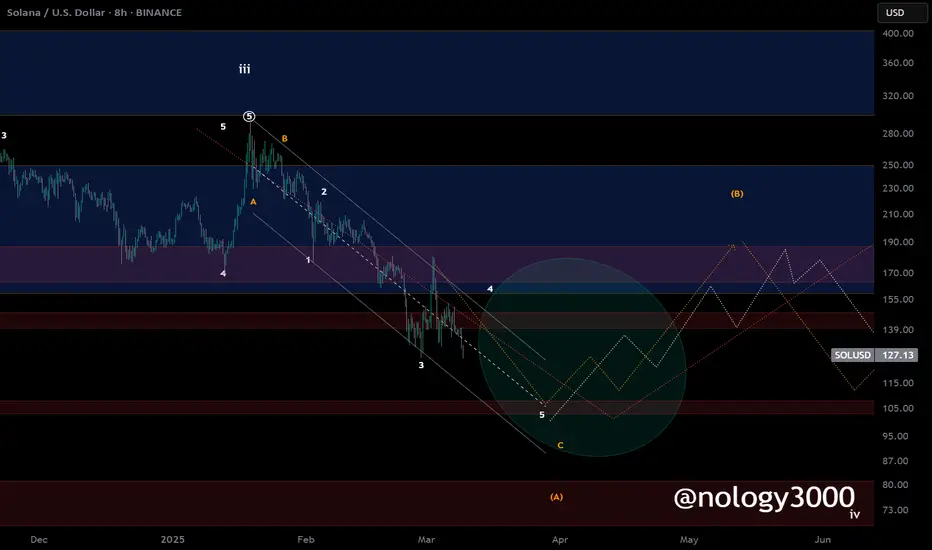
What’s in store for $SOL?CRYPTOCAP:SOL can see $15 again just like CRYPTOCAP:BTC saw $15k then went to $100k …
SOLUSD trade ideas

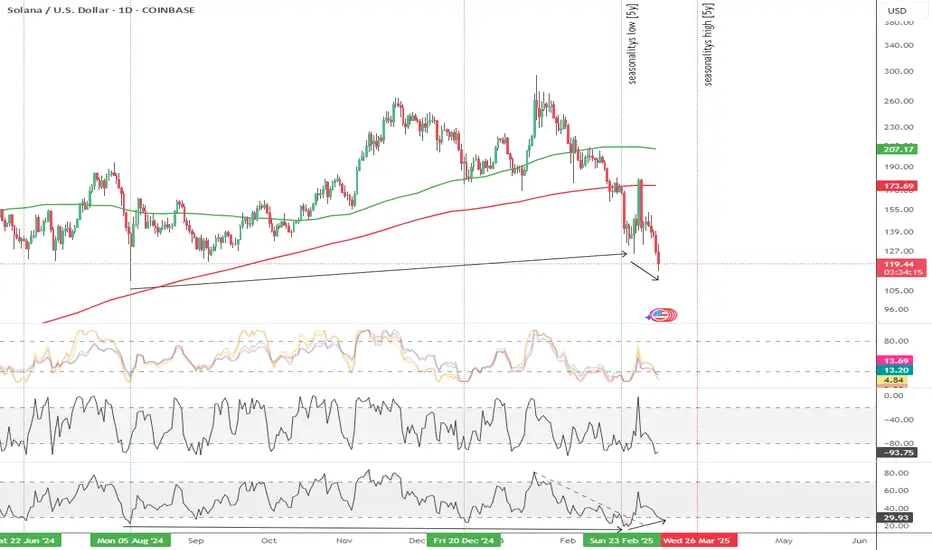
If SOL crosses this last area (1D) It'll be a really big problem
If SOL crosses down the last green area, we're done.
It's on daily timeframe, each candle = 1 day
Today's candle should close above the price 118, if it closes below, then there's a big chance of a big fall.

Major Solana support - Final shakeout We have seen major support for SOL at around $110-130 on the weekly chart, which could indicate a turn to the upside in the next few days. DONT GET SHAKEN OUT 📈📈

SOLUSD Bullish OutlookBullish Post Description for TradingView
Title: Bullish Setup on SOL/USD - Potential Bounce Opportunity!
Hey traders, let’s break down this Solana (SOL) to USD chart (1D timeframe, COINBASE: SOLUSD) published by FairValueBuffet on TradingView (Mar 10, 2025, 21:18 UTC). Despite the recent downtrend, there are signs that SOL might be gearing up for a bullish reversal—here’s why:
Potential Support at Fair Value Gap (FVG): The price has dropped to 119.70 USD, aligning with a red FVG at this level. FVGs often act as magnets for price, and with the next unfilled FVG at 103.41 USD, we might see buyers stepping in to defend this zone, potentially triggering a bounce.
Momentum Indicator Oversold: The momentum indicator (top middle, likely RSI) has plummeted into oversold territory after the sharp decline from the 340 USD peak. This oversold condition often precedes a reversal, suggesting that selling pressure may be nearing exhaustion.
Moving Averages Convergence: The green (shorter-term, likely 20-day) and red (longer-term, likely 50-day) moving averages are starting to converge after the bearish crossover in early 2025. A flattening or potential bullish crossover could signal a shift in momentum.
COT Data Shift: The Commitment of Traders (COT) data shows large speculators’ net positions (red line) at -18.5K and commercial hedgers (blue line) at -20K, indicating extreme bearish sentiment. Historically, such extremes can mark turning points as the market becomes oversold, setting the stage for a bullish reversal.
With SOL at 119.70 USD and showing signs of stabilization near a key FVG, this could be a prime spot for a bounce. Keep an eye on the 119.70-120 USD level—holding above this could see SOL targeting the next FVG at 176.69 USD. Consider long positions or scaling in if we see increased buying volume and a break above the black descending trendline. Stay tuned for confirmation!
Bullish Case for Solana - Fundamental Perspective
While the SOL/USD chart indicates a recent bearish trend, the broader fundamentals for Solana as of March 10, 2025, present a compelling bullish case. Here’s why we might see upside potential in the longer term:
Ecosystem Growth: Solana continues to see strong adoption in decentralized finance (DeFi) and NFT markets, with transaction volumes and developer activity remaining robust despite the price correction. New projects launching on the network could drive renewed interest.
Market Sentiment Recovery: The broader crypto market often sees rotational buying after sharp corrections. With Bitcoin and Ethereum potentially stabilizing (as implied by general market trends), SOL could benefit from a risk-on sentiment as investors seek high-growth altcoins.
Technological Advantages: Solana’s high throughput and low transaction costs remain competitive advantages, especially as layer-1 solutions gain traction in a recovering market. This could attract institutional interest over time.
Macro Environment: A dovish Federal Reserve stance, with potential rate cuts signaled in early 2025, typically supports risk assets like cryptocurrencies. Lower interest rates could drive capital inflows into high-growth assets like SOL.
Given these fundamentals, Solana might be poised for a bullish recovery, especially if technical indicators confirm a reversal at the current price levels. The oversold momentum and alignment with an FVG suggest a potential bottoming pattern. Consider accumulating on dips or watching for a breakout above key resistance levels like 130 USD to confirm bullish momentum. Stay tuned for further developments!
Note: This analysis is based on the provided chart and my knowledge up to March 10, 2025. For the latest updates or to validate these trends, I can perform a web search or analyze additional X posts if requested!
Not Financial Advice
#Solana is not done? CRYPTOCAP:SOL
#Solana will be interesting around $103.
It just needs to get through this correction.
Like most things I think corrections will finish mid March.
SOLANA ? "BOTTOM of the Market if "Bulls on Parade"Hello Solana Traders
We're at my "POINT of CONTENTION" Triangle and WEEKLY LEVEL
$130 to 147 . Look at the history, this price level is a make or break.
at 3min Chart
Price must hold at 139.15 for further upside or 134.58 for some short scalp
Today might be the "BOTTOM of the Market if "Bulls on Parade"

Solona Pattern: The price action is forming a "W" pattern (double-bottom reversal), signaling potential bullish momentum in the near term.
Near-Term Target: The formation is expected to test 180 (Est. 180) as an initial upside objective.
Resistance Level: A key hurdle lies at 228.62; a breakout above this level could confirm stronger bullish continuation.
Support Level: Critical downside protection is seen at 127, which must hold to maintain the bullish structure.

SOLUSD BUYThis analysis is based on the provided image and must not be taken as financial advice. Trading involves risks, so conducting your own research and consulting with a financial advisor before making any trading decisions is crucial.

$SOL Trying For W Patter ReversalTHE MARKET REALLY WANTS TO GO UP.
Stronger coins, such as CRYPTOCAP:SOL
keep putting in higher lows.
If we close above the EMA9 on the Daily that will be really telling.
A bit premature to call a reversal, but I’ve been speculating on this W reversal pattern forming since Trump announced the Crypto Strategic Reserve.
Perfect setup for that.
The lack of liquidity is the only thing holding back the reversal and reason for the pump n dumps on every bit of news.

SOlUSD Analysis
Recent Low & Bounce: Price found support around 127 and has been climbing within a short-term rising channel.
Fib Levels in Play: From the swing high near 153 down to 127, key retracements cluster around 139–145, with 149.6 (78.6% Fib) acting as a major ceiling.
EMA Ribbon & 200 MA: The EMA ribbons are near the current price, signaling consolidation. The 200 MA (turquoise) sits around 158, which could be a stronger resistance if price rallies further.
Key Resistance: Watch 146–150. A decisive break above 149–150 could open the door to retest the 153 swing high and potentially push toward 158.
Support Levels: If SOL loses momentum and falls below 139–136, a retest of 127 support becomes likely. A close beneath 127 could accelerate downside pressure.
Bottom Line: SOL is attempting a recovery off 127, but it must clear the 146–150 resistance zone to build meaningful bullish momentum. Failure to hold above 139–136 risks a deeper pullback toward recent lows. Keep an eye on volume and candle closes around these critical levels.

SOLANA SOL/USDWait for this breakout..... it'll take a few days.... but you'll see a nice climb.
Institutions shorting gold futures around 2930 marker. Gc1!

solonaSolana is consolidating near 143.58 USD, with 144.08 USD and 142.65 USD acting as immediate directional triggers. A sustained move above 145.49 USD would signal bullish intent, while failure to hold 142.65 USD risks a drop to 140.46 USD.

The Art of the Dick-n-Balls Setup A.K.A. Head & ShouldersTL;DR: This is a textbook Head & Shoulders pattern, but let’s be real—it also resembles something more… anatomical. Regardless of how you see it, the market structure is screaming impending breakdown as we gear up for a possible move toward $125-$130.
1️⃣ The Left Shoulder → Initial rally followed by a pullback, setting the first high.
2️⃣ The Head → A euphoric breakout attempt, swiftly rejected, forming the highest peak.
3️⃣ The Right Shoulder → A weak push upward, failing to reclaim the highs, signaling distribution.
💀 Neckline Break = Confirmation: Price is slicing through key levels, rejecting off moving averages, and forming lower highs.
📉 Target Zone:
Fibonacci extension and previous liquidity pools align around $125-$130, making this the next logical support zone.
📊 Additional Confluence:
Volume Profile: Decreasing volume on right shoulder = buyers losing steam.
EMA Rejection: Price struggling below key moving averages.
Liquidity Grab: Stop hunts above the head indicate smart money distribution.
🚨 Final Take:
If this setup plays out, the move down could be swift. While it may look like a "Dick-n-Balls" to the untrained eye, the market only cares about order flow, liquidity, and psychology—all of which suggest a bearish continuation.
Stay sharp, trade smart. 🔥💎

Im SOLd on this. Solana SOLUSD reviewno explanation...can see if anyone gets it on how these two work together or what the rules may be to operate the bottom one effectively
guess right or try and ill explain in detail using those callouts
try your luck down below

Solonaexpect Solana to surge to 152.00–154.50 USD, assuming sustained buying pressure. Monitor volume and resistance at 150.00 USD for confirmation.

SOL initial target 400 USDCrypto being crypto I do not know how it will progress afterwards.
Note on weekly it hasn't closed beneath the light blue bull flag. Therefore still valid on that time frame. I expect NFP will be the trigger. Weak jobs?
Not financial advice
SOLANA: watch out for $160 & $174 zonesSOLANA: watch out for $160 & $174 zones.
The first-ever White House crypto summit hosted by President Donald J. Trump will likely act as a catalyst to pump crypto/Solana in the interim.
$160 may be achieved before or on that day. Also, there is the possibility of this asset hitting $174 to $180.
Trade with care as the whole markets are volatile.

PLAN FOR THE TOP 20 COINS (95% OF TOTAL MARKET CAP)PLAN FOR THE TOP 20 COINS (95% OF TOTAL MARKET CAP)
BTC’s steadily climbing into the 9x range—so where’s SOL headed?
The market’s green right now, but this green flags an adjustment coming soon, likely mid-to-late March. Let’s break down the plan for the top 20 coins, which hold 95% of the total cap. Starting with SOL:
SOL’s current trend is downward, tracking the weekly (W) cycle. Once the bottom’s signaled, it’ll resume growth on the monthly (M) cycle.
The recent pullback brought SOL close to its target zone at 115 USD—but the W hasn’t fully bottomed out yet.
Over the next 1-2 weeks, the W will kick off another decline.
SOL’s potential zones: a high of 186 USD, a lower 164 USD—watch here for the next downward trigger on the W cycle.
Stay tuned, fam!
What’s next: ADAUSDT

SOLUSD SELLThis analysis is based on the provided image and must not be taken as financial advice. Trading involves risks, so conducting your own research and consulting with a financial advisor before making any trading decisions is crucial.

Will SOL start growing now that Trump has announced the reserve?Hi everyone, let's look at the 1D SOL to USD chart, in this situation we can see how the price is moving in an ascending channel where it is currently struggling to stay in the lower part of the channel.
Let's start by defining the targets for the near future that the price has to face:
T1 = 172.96 USD
T2 = 202.57 USD
Т3 = 223.84 USD
Т4 = 250.58 USD
Now let's move on to the stop-loss in case the market continues to fall:
SL1 = 139.90 USD
SL2 = 114.89 USD
SL3 = 94.76 USD
SL4 = 74.35 USD
It is worth looking at the MACD indicator where we can see how low we have gone much lower than during the previous declines, which could potentially indicate that the price will try to go up if the ongoing bullish trend is maintained.

analise gpt SOL/USD Technical Analysis – 4H Chart 📊
Currently, SOL/USD is testing a strong support zone around $140, which has previously acted as a key level for price reactions. This area is crucial for determining the next move in the market.
🔹 Current Market Overview:
Support: $140
Resistance Levels: Next key resistance at $150-$155
RSI: Monitoring if it enters the oversold region (<30)
Moving Averages: Checking interaction with the 21/50 EMAs
🔥 Possible Scenarios:
1️⃣ If the $140 support holds 📈
A bullish reaction could push the price towards $150-$155.
Best entry if we see strong rejection and increasing volume.
2️⃣ If $140 support breaks 📉
The price might seek lower liquidity zones, potentially testing $135 or even $130.
In this case, waiting for a new confirmation would be safer.
🎯 Trading Strategy:
📍 Entry: If there is a strong rejection at $140 with rising buying volume.
📍 Stop Loss: Below $138 to minimize risk.
📍 Target: $150-$155 in the short term.
Monitoring volume and market strength is crucial to confirm the best entry. Interesting opportunity, but caution is needed in case of a support breakdown!
Updated SOLUSDT Analysis March 06, 2025 (Based on Latest Data)Using data from Hyblock Capital, Exocharts, Volume Profile, and Order Flow, I've identified key liquidity zones and market behavior shifts.
🔹 Updated Resistance Levels (Short Zones)
1️⃣ $145 - $147 → Strong sell absorption, reduced bids, high-risk zone for longs.
2️⃣ $158 - $162 → Prior high volume area + liquidation cluster.
3️⃣ $178 - $184 → Breakdown point, potential shorting opportunity.
4️⃣ $198 - $205 → Critical area where liquidity may be absorbed for a larger drop.
🚨 If SOL fails to break these levels with strong volume and positive CVD, shorts remain the safer option.
🔹 Updated Support Levels (Long Zones)
1️⃣ $139 - $141 → Buy absorption detected in footprint data.
2️⃣ $134 - $136 → Key point of control (POC), bids still active.
3️⃣ $128 - $130 → Last strong defense before deeper downside risks.
4️⃣ $120 - $122 → Historical liquidity area with significant past volume.
5️⃣ $100 - $105 → Long-term support, strong liquidity concentration.
✅ If absorption occurs and CVD turns positive at these levels, long entries could be favorable.
📊 Technical Confirmations
🔹 CVD & Delta → Sellers are still dominant, but buy absorption is forming around $139 - $141.
🔹 Footprint & Volume Profile → Buying activity has increased at $134 - $136.
🔹 DOM (Order Book) → Strong selling pressure defending $145 - $147, making it a tough resistance.
📌 If SOL holds above $139 and CVD turns positive, we might see a retest of $145-$146. If it loses $134, $128-$130 is the next downside target.
📈 Updated Trade Setups
🔻 SHORT at $146 (Strong Resistance)
📍 Pair: SOLUSDT
📍 Direction: SHORT
📍 Estimated Success Rate: 82%
🎯 Entry:
🔴 $144
🟠 $145
🟢 $146
🎯 Take-Profit Targets:
✔️ TP1: $139 (+4.79%)
✔️ TP2: $134 (+8.21%)
✔️ TP3: $128 (+12.32%)
⛔ Stop Loss: $150 (-2.73%)
🔺 LONG at $136 (Strong Support)
📍 Pair: SOLUSDT
📍 Direction: LONG
📍 Estimated Success Rate: 80%
🎯 Entry:
🔴 $134
🟠 $135
🟢 $136
🎯 Take-Profit Targets:
✔️ TP1: $141 (+3.67%)
✔️ TP2: $146 (+7.35%)
✔️ TP3: $158 (+16.17%)
⛔ Stop Loss: $130 (-4.41%)
⚠️ Final Conclusion
🔹 $145 - $147 remains a key resistance, and $136 is absorbing well based on fresh liquidity data.
🔹 Losing $134 could trigger a move towards $128 - $130 support.
🔹 Order flow still favors shorts, but a reversal attempt is possible if absorption continues.
📌 This setup is ready to be automated with limit orders. 🚀📊

SOL/USD WHICH WOULD U PREFER?Price didnt make new LL's and returned...so we will be looking for a buy trade but with caution!! dont make decisions too quick! wait for confirmation, and enter AFTER the market tells you its okay! dont rush, wait for right confirmations and than enter. And never forget trend is your friend and always check higher TF's.
