SOL trade setup with a 3.3:1 risk-to-reward ratioThis trade setup offers a 3.3:1 R:R
Entry: 174
Stop Loss: 145
Target: 265
SOLUSD trade ideas
Solana breakout setup: why I am watching this level closelySolana is forming a clear ascending triangle. We already saw one breakout earlier, followed by a few hard retests. Now price has stalled. This might frustrate some, but I see opportunity. A clean break could deliver 14% upside. I also discuss Bitcoin, false moves, and why time stops matter in this environment. Watch closely.

Double bottom on the way up!Solana seems to still have more breath to push the price up the page from this double bottom after a strong push up with good volume! It has a good chance to push the price to 180 if you have the stomach to ride it!
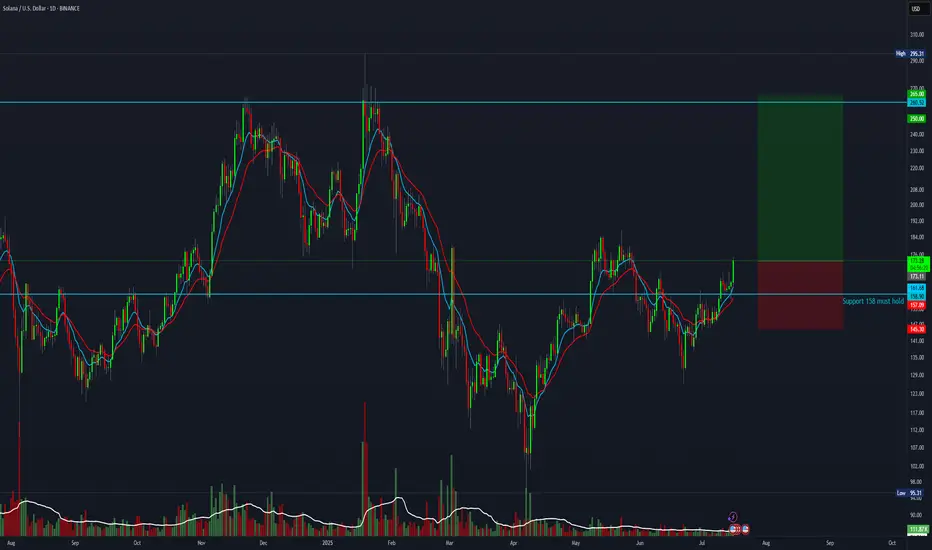
Solana's battle continues. But for how long?The battle for Solana to overcome the 1D 200MA continues.
A daily closed above $166 could signal a push towards May Hs around $185.
The last time SOL traded above 1D 200MA was in Feb. Since then, the daily 200MA has been acting as resistance.
If Solana can finally start trading above the 200MA and reclaim $185, it could signal higher prices and a test of January Hs around $270.
In the short term, support can be expected around $156 should price start to show some weakness... Losing it wouldn't be nice...
What do you expect from Solana in the short term?
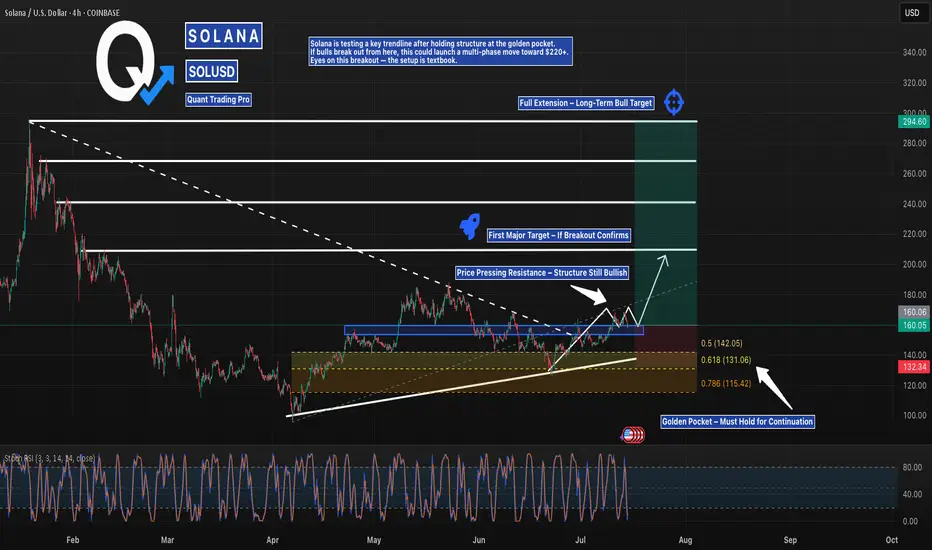
Solana’s Breakout Setup is Loaded — Bullish Structure IntactSolana is pressing into key resistance after holding its higher low structure and climbing out of the golden pocket. With a breakout forming just under the descending trendline, bulls are watching for confirmation to ignite a move toward $220 — and potentially $290+.
Momentum is coiled, and the chart is clean. If price holds above $142, this could be the beginning of a multi-leg run.
#SOLUSD #SolanaBreakout #CryptoTrading #QuantTradingPro #BacktestYourEdge #TradingView #AltcoinSetup
SOLUSD – Coil in DeclineSOL rallied fiercely from $146 into $170, then sold off aggressively. The chart shows a classic mid-trend distribution, followed by lower highs forming into a descending wedge. Support at $158 has held for now. A breakout over $161–162 could shift structure, but below $157 = trouble.

SOL DOWN TO 146 ? Is this possible? Good evening trading family
Based on what we are seeing here is a typical correcting of any good bull mark needed to sustain our movement upwards. Currently we have spotted 3 levels down to the 146 marker with a these of a bullish move upwards if they hold.
Happy trading folks
Kris/ Mindbloome Exchange
Solana looks UpsideThe Solana is consolidating on wave 2, breaking the wave 1 top would be the bullish indication with beginning of wave 3.

"Solana Heist in Progress! Will the Breakout Hold or Fake Out?"🔥🚨 "SOLANA HEIST ALERT: The Ultimate Bullish Raid Plan (Breakout or Fakeout?)" 🚨🔥
🌍👋 Greetings, Market Pirates & Profit Bandits!
(English, Spanish, Portuguese, French, German, Arabic—we speak MONEY.)
💎 STRATEGY BASED ON THIEF TRADING STYLE 💎
(High-risk, high-reward—steal the trend or get caught in consolidation!)
🎯 MISSION: SOL/USD (Solana vs. Dollar) CRYPTO HEIST
🐂 Direction: LONG (But watch for traps—cops & bears lurk nearby!)
🚀 Escape Zone: ATR line (High-Risk Profit-Taking Area)
⚠️ Warning: Overbought? Reversal? Police line at resistance? TAKE PROFITS EARLY!
📈 ENTRY: "THE BREAKOUT HEIST BEGINS!"
Trigger: Wait for candle close ABOVE 148.50 (MA)
Alternative Entry: Buy stop above MA OR buy limit on pullback (15m-30m TF)
🛎️ SET AN ALERT! Don’t miss the breakout—thieves strike fast.
🛑 STOP LOSS: "DON’T GET CAUGHT!"
Thief SL: 136.00 (2H Previous structure Swing Low) (Adjust based on your risk & lot size!)
⚠️ Warning: If you ignore this, you’re gambling—your loss, not mine.
🎯 TARGET: "LOOT & BOUNCE!"
🎯 167.00 (or escape earlier if the trend weakens!)
🧨 Scalpers: Only play LONG—use trailing stops to lock in gains!
📢 NEWS & RISK WARNING
🚨 Avoid new trades during high-impact news! (Volatility kills heists.
🔒 Use trailing stops to protect profits if the market turns.
💥 BOOST THIS HEIST! (More boosts = more profit raids!)
👉 Like ✅ | Follow 🚀 | Share 🔄
💬 Comment your take—bullish or bearish trap?
🚀 Next heist coming soon… Stay tuned, bandits! 🤑

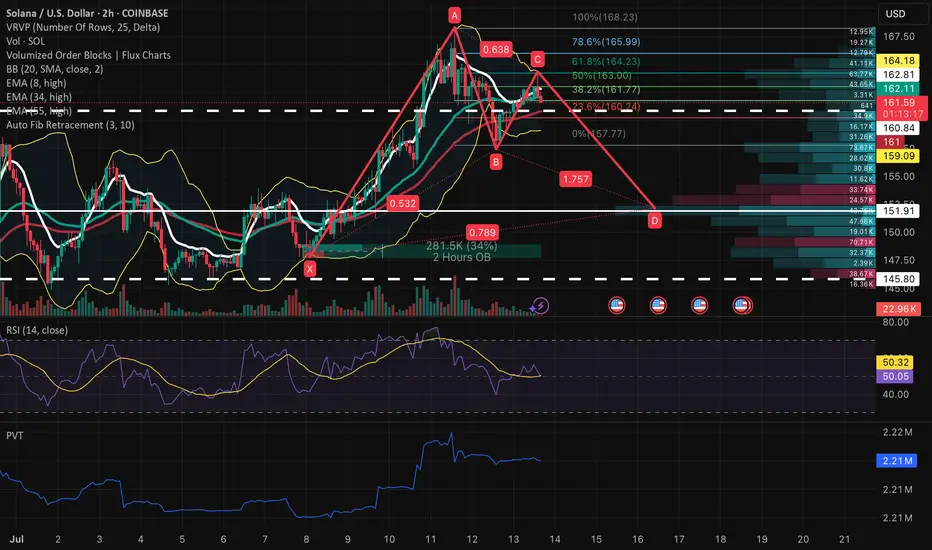
Projected Harmonic Extension Into Key Demand Zone (157–152 WatchMacro to Micro Context
SOL is currently reacting off a short-term distribution zone between 164 and 168 after an impulsive run-up from early July. While no complete harmonic has printed yet, the structure forming resembles a potential Bearish Gartley. The CD leg shown is not yet confirmed, but represents a projected path derived from the local point of value and volume geometry on the 2H chart. The area between 157 and 152 remains the primary zone of interest, given historical demand and high-volume node alignment.
Structural and Momentum Breakdown
XABCD Estimate:
XA was impulsive, AB retraced 53.2%, and BC retraced 63.8% of AB
CD projection is speculative, drawn from the confluence of the BC extension (1.757), 0.786 retrace of XA, and the local value zone around 157.5–152
Volume Profile: Substantial volume shelf aligns with projected CD completion. Above 164, volume thins out sharply, indicating inefficiency and risk of rejection
Order Blocks: 2H bullish OB from July 1–3 sits directly inside the 157–152 range, adding further structural validity to this projected leg
Momentum Signals:
RSI is stalling below mid-band (50–60), suggesting loss of buyer momentum
Price Volume Trend (PVT) shows deceleration post-surge, potentially preceding distribution
Bollinger Bands are compressing, which often leads to volatility re-expansion following trend exhaustion
Trade Plan
At this stage, the CD leg remains a hypothesis based on value structure and harmonic geometry. The trade plan focuses on preparing for potential long entries if price moves into the estimated completion zone with supportive signals.
Watch Zone for Long Setup: 157.5 to 152.5
Invalidation: Clean break below 147 suggests breakdown and invalidates harmonic idea
Take-Profit Targets on Reversal:
TP1: 161.5 to 163.0
TP2: 165.5 to 168.0
Required Confirmation:
Bullish divergence on RSI or PVT bounce
Reclaim of 2H order block zone with impulse and follow-through
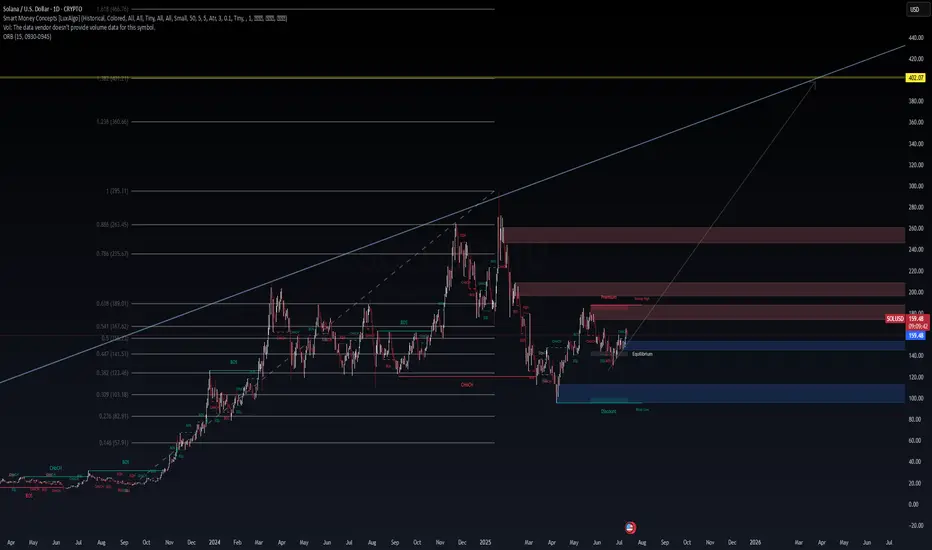
SOL/USD – The War Between Discount & Premium Zones Is Heating Up📈 SOL/USD – The War Between Discount & Premium Zones Is Heating Up
Posted by: WaverVanir_International_LLC
Date: July 12, 2025
Asset: Solana (SOL/USD) | Timeframe: 1D
Strategy Stack: SMC | Fibonacci | Volume Profile | Macro | Catalyst | VolanX DSS Protocol
🔍 Technical Summary
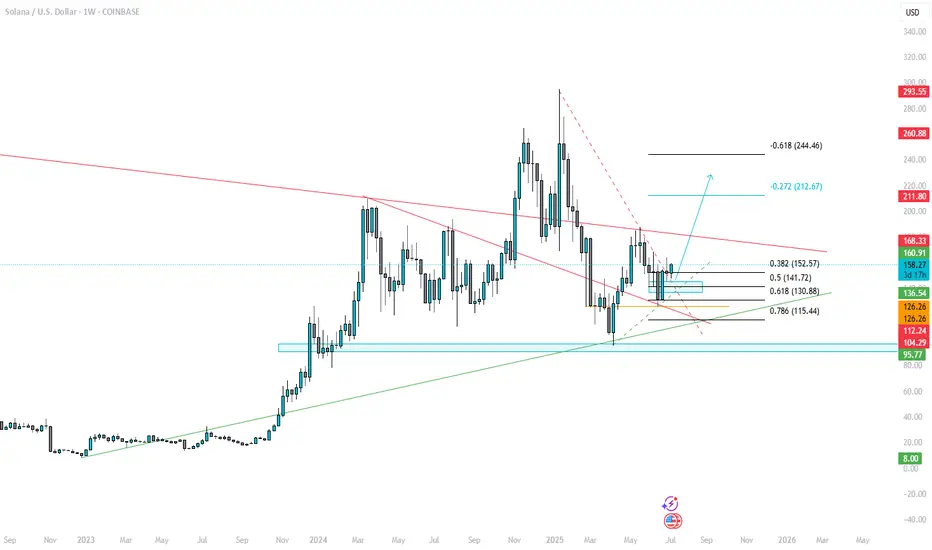
SOL is battling near the 0.5 Fib retracement (~$167), a classic inflection zone. Price is compressing within an equilibrium band bounded by $145–$175. Despite a prior break of structure (BOS) to the downside, recent CHoCH and bullish BOS patterns suggest accumulation may be underway.
Key Zones:
Support (Discount): $123.46 → $103.18 → $82.91
Resistance (Premium): $189 → $235 → $263
High-Conviction Targets:
Bullish Extension: $295 → $360 → $402
Bearish Sweep Zones: $103 → $80 (liquidity pockets)
Structure Readout:
CHoCH (Mar–Apr 2025) suggests reversal potential.
BOS (May–June 2025) confirmed demand stepping in.
Current: Price testing equilibrium mid-zone, low conviction until a clean break of $175 or a flush into $130.
🌐 Macro Context (Q3 2025)
🏦 Federal Reserve Policy
FOMC paused in June, signaling data-dependency.
Market pricing 30–50bps cut by Q4 2025.
Liquidity-sensitive assets like crypto are forward-looking, already attempting to front-run easing.
💰 Global Liquidity Shift
US M2 money supply stabilizing after 2022–2024 contraction.
Global CBs (e.g., ECB, BOJ) showing coordinated signals of easing.
Risk-on flows resurging into high-beta assets → Crypto stands to benefit on the second leg of liquidity wave.
💻 Tech/Crypto Catalysts
Solana Ecosystem rebounding on strong developer metrics, NFT integration, and institutional onboarding (Visa, Shopify integrations).
Tokenization narrative gaining momentum with TradFi firms exploring SOL-based infrastructure.
Regulatory Clarity: US & EU moving toward crypto-safe harbor legislation; positive for altcoin allocation.
⚠️ VolanX DSS Signal Matrix
Module Signal Confidence
Trend Structure Transitional (CHoCH → BOS) Moderate
Fibonacci Levels Compression (0.5–0.618) High
Volume Profile Thin above $175, HVN near $145 High
Macro Liquidity Rising global flows Moderate
Catalyst Tracker Positive (SOL-specific) Moderate
🎯 Execution Framework (2 Scenarios)
🔵 Bullish Bias (Continuation):
Entry Zone: $157–$162 (with SL below $145)
Trigger: Break + close above $175
Targets: $189 → $235 → $263
Invalidation: Daily close below $141.5 BOS zone
🔴 Bearish Bias (Rejection):
Short Zone: $175–$189
Trigger: Rejection w/ CHoCH + imbalance fill
Targets: $145 → $123 → $103
Invalidation: Clean break above $195 with volume
📜 WaverVanir Risk Advisory
This outlook is generated under the WaverVanir DSS (Decision Support System) and is shared strictly for educational and analytical purposes.
We do not manage outside capital, and none of this constitutes investment advice. All systems are probabilistic and adaptive, not deterministic.
🧠 Final Notes:
Solana is at a macro hinge point. Either the liquidity-driven expansion phase begins with force — or we get one more sweep into deeper discount zones before lift-off. With global liquidity expanding and catalysts aligning, the next few weeks will define the rest of 2025’s structure.
💬 Drop your thoughts below.
🔁 Follow @WaverVanir_International_LLC for high-conviction, system-generated macro + SMC trading insights.
🌍
SOL - Liquidity Sweeping Evening Star Plenty of rotations in altcoins with SOL rotating to weakness in this area.
This is while Bitcoin breaks the ascending line; and we'll have to see what type of dip it is...
This slightly higher high and Evening Star candle pattern is quite a bearish look.
If Bitcoin was more bearish, you could look at this and consider that it may be a major pivot before a significant downtrend.
Perhaps it will somehow recover if the overall market is bullish, but this is not at all a technical hold here.
Only hodlers need apply.
Not advice
Not advice

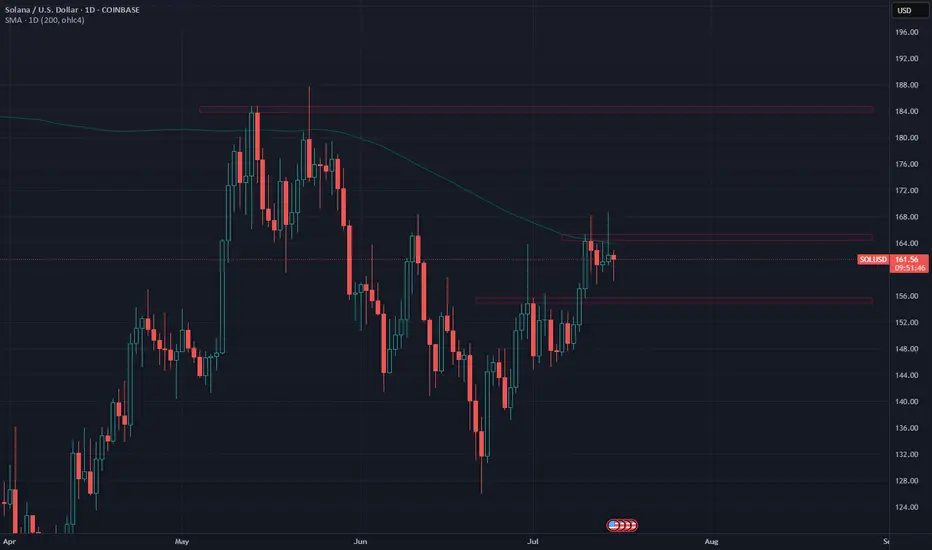
SOL wait for entrySOL has just broken the 1d trendline.
Let's wait for retest (if it happens) to have a good entry.
Disclaimer:
This analysis is based on my personnal views and is not a financial advice. Risk is under your control.
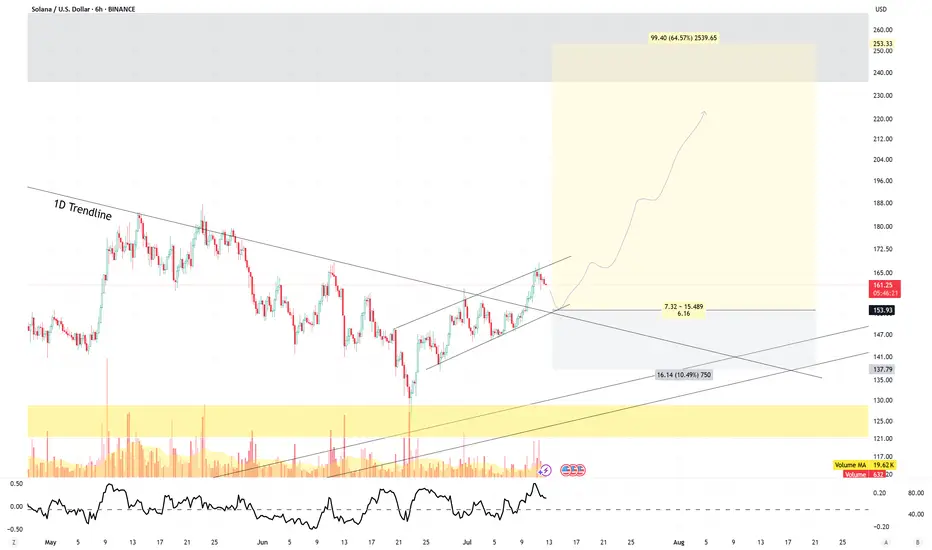
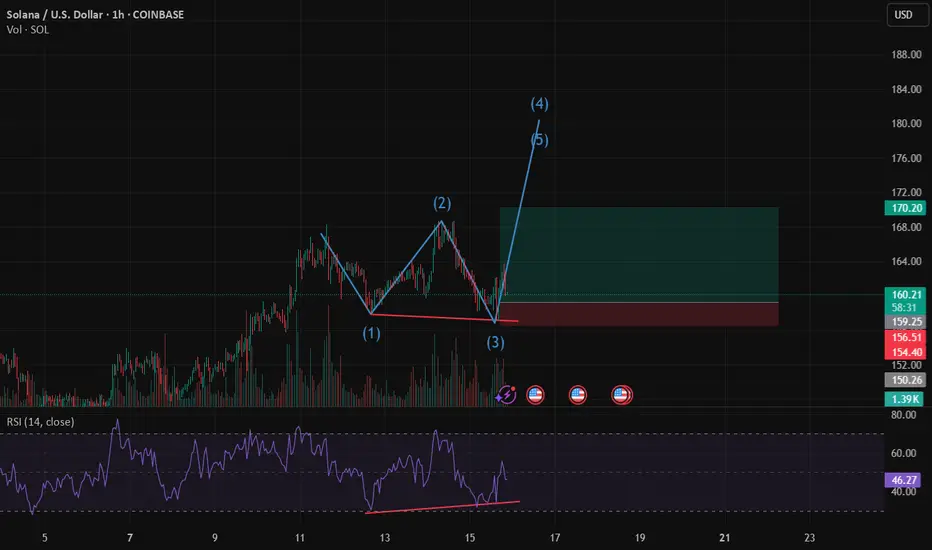
Solana Bounce Setup – Trendline + Demand Zone ConfluenceSOL is testing a confluence zone between rising trendline support and a key demand block around $161–$162. This zone has acted as a springboard for the last leg up and now overlaps with a full Stoch RSI reset on the 1H timeframe.
If price holds this structure, a continuation toward the previous supply zone at ~$166 is in play. Breakdown below $159.68 would invalidate the setup.
📉 SL: Below structural low
📈 TP: Prior high / liquidity zone
📊 Watching candle structure for entry confirmation
#SOLUSD #Solana #PriceAction #TrendlineSupport #CryptoSetup #QuantTradingPro #TradingView

SOLANA IDEA For solana traders
Price is heading to a daily supply
On the hourly we're seeing a retracement
Confirmation before entry is advised on the M30 Demand
Good luck and happy weekend trading

Solana Wave Analysis – 11 July 2025- Solana broke resistance zone
- Likely to rise to resistance level 180.00
Solana cryptocurrency recently broke the resistance zone between the resistance level 159.80 (which has been reversing the price from the start of June) and the 61.8% Fibonacci correction of the ABC correction (2) from May.
The breakout of this resistance zone should accelerate the active impulse waves 3 and (3).
Given the strongly bullish sentiment seen across the cryptocurrency markets today, Solana can be expected to rise to the next resistance level 180.00.

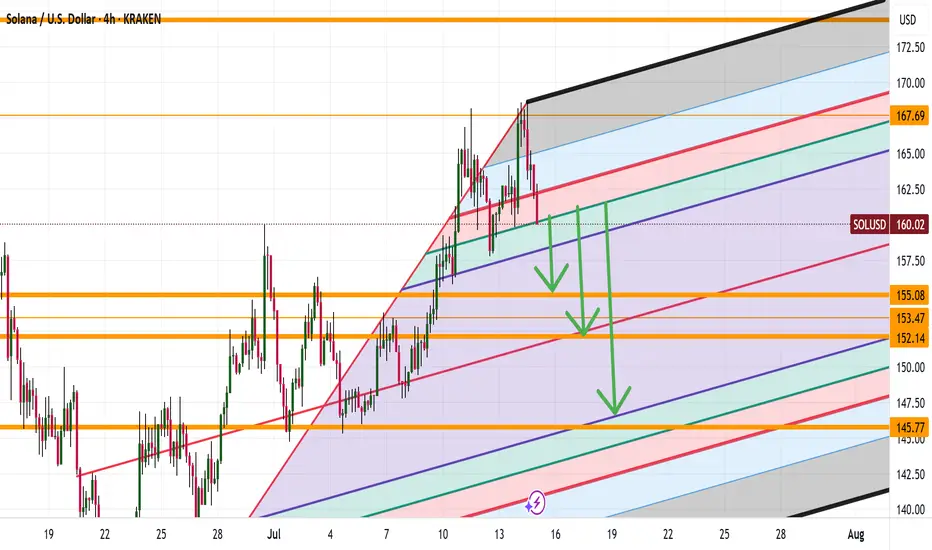
SOL TO 167?Good morning folks
so it looks like we are correcting down possibly down to 153 then seeing a drive up to 167. What are your thoughts on the market for Solana
Looks like things are heating up for Solana
Kris/Mindbloome Exchange
Trade Smarter Live Better

Solana looks ready to soarWith BTC and XRP pushing higher, it’s increasingly likely that Solana will follow, especially as an ascending triangle pattern is forming. To learn about the levels and risk management we’re considering for this setup, watch the video.

Sol Going HigherLooks likeSol is going to 240 level!
-Retest trendline made Red
-Order blok respected
-fakeout trendline Green
-Fib completion
Every thing is looking great!
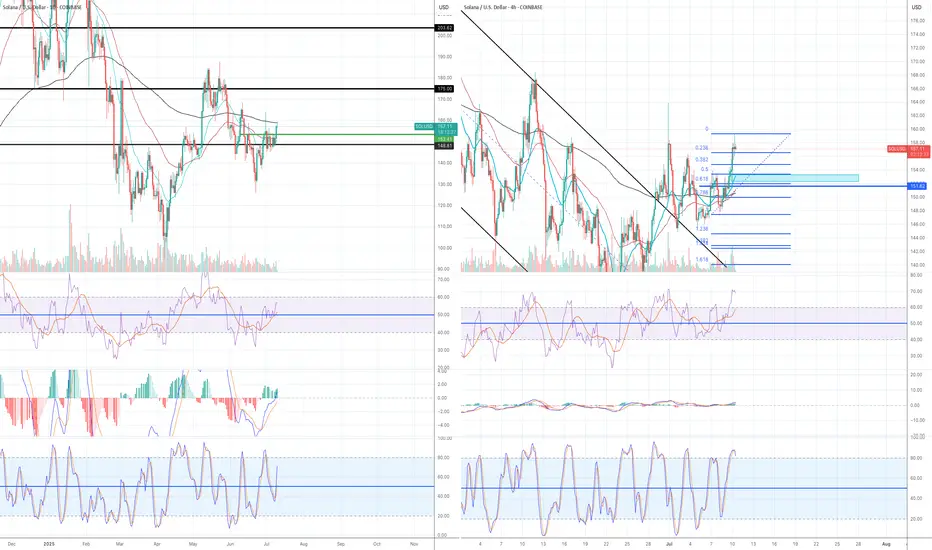
LONG - I am going to add more position when this happensI currently have a small size of long position but I am planning to add more (please see my previous article for my first trade set up), but I am waiting for a certain set up to come up:
Daily:
1) all momentum indicators are entering the bull zone, so there is a plenty of room to move to the upside.
2) The candle has crossed and closed above both EMA 21 and 55, but EMA 200 is currently working as a resistance.
3) EMAs have not crossed and lined up for the bull trend - 21> 55> 200
4H:
1) EMA55 has finally crossed above EMA200!! But when they cross, the price very often has a decent pull back before taking off.
2) Stochastic and RSI are already in the overbought territory which tells me the pull back is likely to happen.
The chart is looking really good for the bull but I am going to wait for the price to retrace to Fib0.5-0.618 zone (see blue rectangular box in 4h chart).
If the price rebounces from that zone and momentum indicators reset to move to the upside, I am prepared to go big on long.
SOL Triangle Breakout + Fib Confluence – Aiming for $190+Solana (SOLUSD) just broke out of a multi-month triangle on the 8H chart, signaling a potential reversal and continuation toward previous highs.
Key Highlights:
🔹 Break of Structure (BOS): Price broke through descending resistance, flipping momentum in the bulls’ favor.
🔹 Fibonacci Confluence: Bounce came cleanly from the 0.5–0.618 zone ($129–$140), adding high-probability support.
🔹 Triangle Apex Break: Consolidation is over — the arrow is launched.
🔹 Targeting Previous Highs: $185–$190 range is in sight, with historical resistance marked.
🔹 Risk Defined: Stop idea near the previous low and triangle base (~$115).
⚠️ Watch for confirmation candle closes and volume follow-through — the move is just beginning.

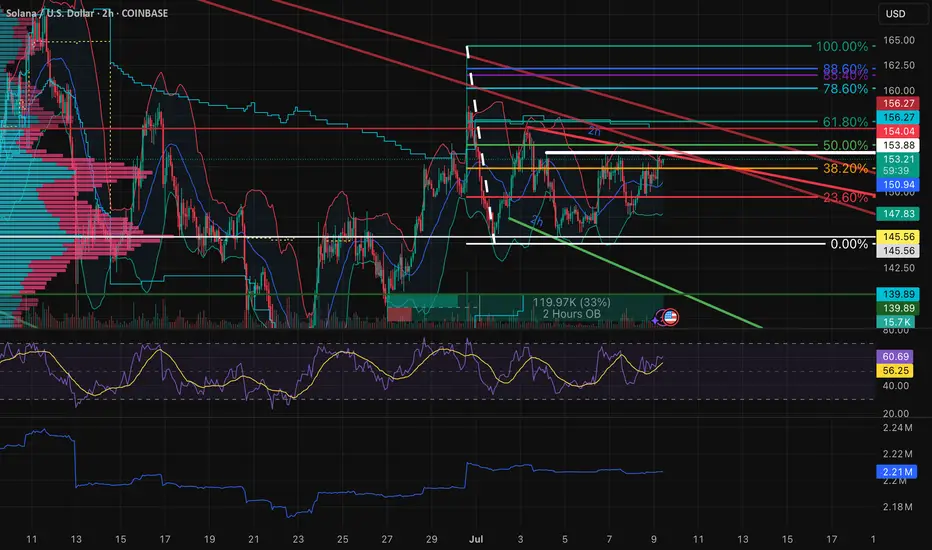
$SOL | Triple Top or Launchpad?Macro to Micro Context:
SOL is now testing a third rejection in the upper 153s, forming a textbook triple top just under a multi-month descending trendline and major Fib resistance. This ceiling has held firm since late June, despite higher lows grinding up from below. Price is now squeezed tightly between compressing demand and stacked supply, with volatility contraction apparent across the board.
The structure is coiling hard but momentum and volume must confirm resolution before positioning aggressively.
Structural & Momentum Breakdown:
Resistance Layering (Reinforced):
Triple Top: Price has repeatedly failed to break above the upper 153s.
Fib Overlap: 50%–61.8% retracement range aligns with both trendline resistance and OB stack.
Order Block Stack: Resistance from mid-153s to low-154s is now reinforced across timeframes (30M → Daily).
Momentum Shifts:
RSI Divergence: Lower highs on RSI across 2H/1H, despite flat or slightly higher price.
PVT Flattening: No fresh accumulation during recent tests.
Volume Decline: Progressive volume deterioration on each retest distributional tone building.
Demand Shelf:
Key demand and support range from low-150s to mid-151s has held through three separate dips.
This is the immediate pivot zone — lose it and vacuum effect likely down into the upper 140s.
Updated Trade Plan:
Rejection Short Setup:
Entry: Breakdown through mid-151s with confirming sell volume.
Stop: Above low-154s to account for potential deviation wicks.
TP1: Upper 148s (first OB cluster).
TP2: Mid-146s (Fib + minor support).
TP3: Low 140s (macro demand + wedge base).
Bear Confirmation: RSI breakdown + volume expansion + OB flips into resistance.
Breakout Setup (Only on Clear Validation):
Entry: Strong candle close above low-154s with breakout volume.
Stop: Below low-151s — invalidation of reclaim.
TP1: Upper 157s (Fib zone).
TP2: Low 160s (swing high area).
TP3: Upper 160s (macro breakout expansion).
Bull Confirmation: RSI > 62 on 2H, strong PVT rise, and flip of local OB into demand.
Risk Warning:
Triple tops near macro resistance are high-risk unless clearly broken. This zone is overloaded with historical rejection. Don't front-run the breakout — volume will show you who's in control.
Closing Thoughts:
With a confirmed triple top now visible, SOL is facing its most important rejection zone in weeks. Bulls must reclaim with strength or this becomes a clean setup for rotation into the mid to low 140s. Patience and confirmation are key here. Keep risk asymmetric.
SOL/USD in Clear Downtrend – Short Setup in PlayHi traders! , Analyzing SOL/USD on the 30-minute timeframe, price is currently moving within a defined descending channel, respecting lower highs and lower lows. A recent rejection from the channel top suggests continuation to the downside.
🔹 Entry: 150.09
🔹 Take Profit (TP): 145.47
🔹 Stop Loss (SL): 154.51
The price failed to hold above the 200 EMA and has resumed its downward trajectory. The RSI shows a recent bounce from overbought levels, supporting the bearish momentum. This short setup offers a favorable risk-reward ratio within the context of the broader downtrend.
A clean rejection at resistance and confirmation of the trendline add confluence to this trade idea. Keep an eye on the 145.47 zone, where buyers may attempt to defend the support.
⚠️ DISCLAIMER: This is not financial advice. Every trader is responsible for their own decisions and risk management.
