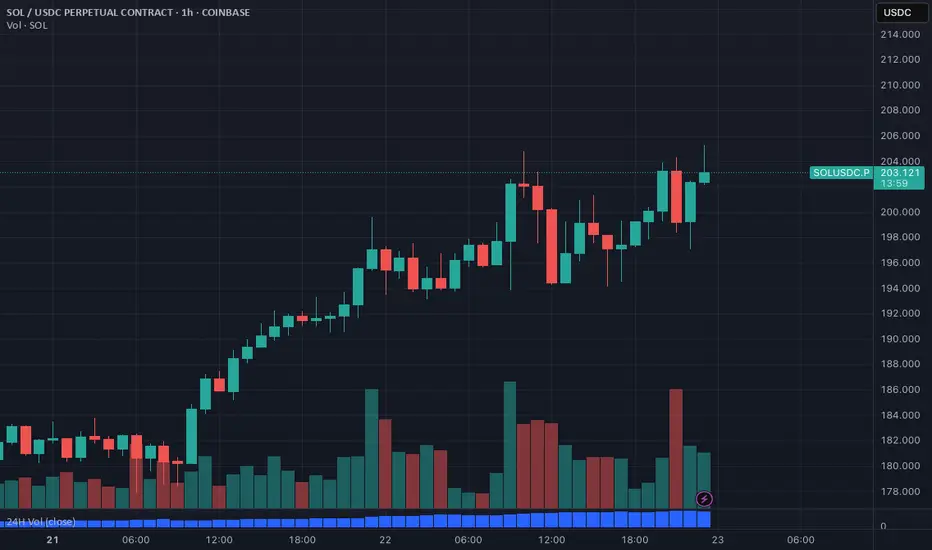
SOL PERP Breakout & Scalping Zones (Coinbase)This chart tracks real-time SOL-PERP on Coinbase with key breakout, bounce, and rejection levels for scalping and trend continuation.
Indicators: EMA 9/21, VWAP, RSI (short-term overextension), volume-based support zones.
Key levels:
Bounce zone: $195–$196
Reclaim breakout: $202.5–$205.5
Final
Related pairs
Price tapped the origin. Now we wait for the rest to catch up.Most of the market is reacting. I’m just tracking delivery.
SOLUSDC just printed a clean raid into the 1D OB — perfectly aligned with a HVN on the volume profile. It’s not a coincidence. It’s Smart Money reloading before the next distribution cycle.
The sell-side sweep into 150.7 tagged the 0.786

Opened liquidity pool for SOLUSDC💰Opened a SOL/USDC liquidity pool
1% range with approximately $300
I want to create detailed statistics and understand how well it performs within narrow ranges.

Why Solana (SOL) might correct to the $75–$85 range?Let’s break down why Solana (SOL) might correct to the $75–$85 range, considering fundamental factors, news, events, technical analysis, Coinbase orders, and on-chain activity.
Fundamental Factors
Solana is a high-performance blockchain known for its speed and low fees. However, in 2024–2025, it

Solana — a correction to around $180-$200.A correction to around $180-$200, marking the start of the bearish phase.

For Solana, the $74-$110 range.For Solana, the $74-$110 range seems like a solid Spot entry point, with long-term targets of $800-$1000.
Why $74-$110? Because Coinbase has large limit buy orders set at $74 and $85 for Solana.
Waiting for the stock market and crypto market to drop.
The right moment to enter Spot is coming soo

SolusdcSOL/USDC has successfully broken out of its downward trend and is now showing strong bullish momentum. With this breakout, we anticipate further upward movement, making it an ideal opportunity for buyers.
🔹 Entry: 195
🔹 Target 1: 205
🔹 Target 2: 217
🔹 Stop Loss: 187
A sustained move above the entr

SOLUSDC - SOLANA BREAKOUT ALERT🚀🚀 SOLANA BREAKOUT ALERT! 🚀🚀
Solana (SOL) is at a breakout point! If it clears $207.43 with volume, we could see a massive rally toward $222+ and beyond!
🔹 Key Levels to Watch:
✅ Breakout Zone: $207.43 (If broken, SOL goes parabolic)
✅ Next Resistance: $222.16 (0.618 Fib – Golden Ratio)
✅ Major Ta


SOL: Symmetrical Triangle—Is an Explosive Move Next?1. Key Patterns, Indicators & Elements Visible
Chart Patterns: There is a clear symmetrical‐triangle formation near the recent highs, outlined by a descending trendline (green dashed) from roughly $295 down and an ascending trendline (white dashed) from the mid‐$190s region upward.
Fibonacci Levels

See all ideas
Summarizing what the indicators are suggesting.
Oscillators
Neutral
SellBuy
Strong sellStrong buy
Strong sellSellNeutralBuyStrong buy
Oscillators
Neutral
SellBuy
Strong sellStrong buy
Strong sellSellNeutralBuyStrong buy
Summary
Neutral
SellBuy
Strong sellStrong buy
Strong sellSellNeutralBuyStrong buy
Summary
Neutral
SellBuy
Strong sellStrong buy
Strong sellSellNeutralBuyStrong buy
Summary
Neutral
SellBuy
Strong sellStrong buy
Strong sellSellNeutralBuyStrong buy
Moving Averages
Neutral
SellBuy
Strong sellStrong buy
Strong sellSellNeutralBuyStrong buy
Moving Averages
Neutral
SellBuy
Strong sellStrong buy
Strong sellSellNeutralBuyStrong buy
Displays a symbol's price movements over previous years to identify recurring trends.