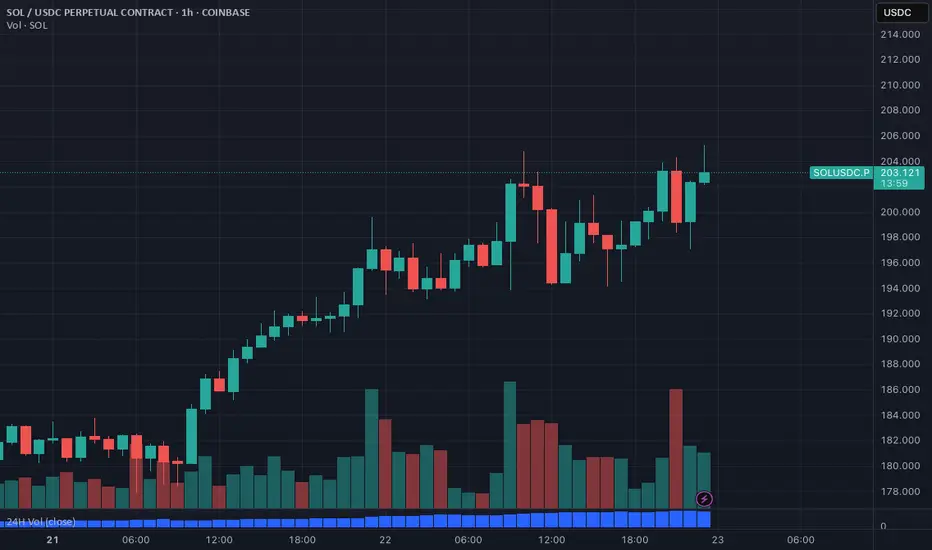
SOL PERP Breakout & Scalping Zones (Coinbase)This chart tracks real-time SOL-PERP on Coinbase with key breakout, bounce, and rejection levels for scalping and trend continuation.
Indicators: EMA 9/21, VWAP, RSI (short-term overextension), volume-based support zones.
Key levels:
Bounce zone: $195–$196
Reclaim breakout: $202.5–$205.5
Final TP target: $209+
Setup focused on short-term trading (1m–5m) with momentum confirmation.
Monitored live for real-time decision support, alert integration, and automated trade journaling.
SOLUSDC trade ideas
Price tapped the origin. Now we wait for the rest to catch up.Most of the market is reacting. I’m just tracking delivery.
SOLUSDC just printed a clean raid into the 1D OB — perfectly aligned with a HVN on the volume profile. It’s not a coincidence. It’s Smart Money reloading before the next distribution cycle.
The sell-side sweep into 150.7 tagged the 0.786 retracement and the top edge of a stacked STB/OB zone. That’s where I’m already building long exposure.
Price isn’t reversing because of “support.”
It’s reversing because the inefficiency from the rally has now been filled — the FVG is complete, and the reaction confirms it.
From here, my first draw is 171.198 — the EQ of a 1D OB and a known liquidity pool. If we displace through that with conviction, I expect full expansion toward the 184.8 high.
Execution logic:
🔑 Entry: 150.7–154 zone (1D OB + STB zone + 0.786 retrace)
🎯 First TP: 171.198
🛑 Invalidation: 141.4 break and close below (full POI invalidation)
🧠 Patience if we revisit 141 — that level may serve as the final sweep before a macro move higher
I don’t trade headlines. I trade imbalance and narrative.
Precision or nothing. This is why my trades don’t miss.

Opened liquidity pool for SOLUSDC💰Opened a SOL/USDC liquidity pool
1% range with approximately $300
I want to create detailed statistics and understand how well it performs within narrow ranges.

Why Solana (SOL) might correct to the $75–$85 range?Let’s break down why Solana (SOL) might correct to the $75–$85 range, considering fundamental factors, news, events, technical analysis, Coinbase orders, and on-chain activity.
Fundamental Factors
Solana is a high-performance blockchain known for its speed and low fees. However, in 2024–2025, it faces several challenges that could impact its price. One of these challenges is the phenomenon of meme tokens, often referred to as the " Meme Casino ," which has become a significant part of Solana’s ecosystem.
1. Decline in DeFi, NFT, and Meme Token Activity
Solana has been widely used for DeFi and NFT projects and has established itself as the leading blockchain for meme tokens. However, in 2024–2025, these sectors are experiencing a downturn. For instance, NFT trading volume and DeFi activity on Solana have significantly dropped compared to their peak levels in 2021–2022. Interest in meme tokens like BONK, which temporarily boosted demand for SOL, may also fade due to the volatility of this market. This reduces the demand for SOL tokens for transactions within the ecosystem, putting downward pressure on the price and diminishing the token’s fundamental value.
2. Competition from Other Blockchains
Solana competes with networks like Ethereum (following the Ethereum 2.0 upgrade and the introduction of sharding), Arbitrum, Optimism, and newer players such as Sui and Aptos. These blockchains also offer high performance and low fees, potentially drawing developers and users away from Solana and reducing interest in SOL.
3. Regulatory Risks
In 2024–2025, regulators worldwide, particularly in the U.S., are tightening control over cryptocurrencies. Meme tokens, which drive a significant portion of Solana’s activity, are often associated with scams. I believe that 99.999% of meme tokens are scam coins, and this could lead to regulatory actions that harm the meme sector on Solana. Since Solana heavily relies on this sector, the price of SOL could plummet to levels like $2–$11.
4. Declining Interest in Meme Tokens on Solana
In 2023–2024, meme tokens like BONK temporarily increased Solana’s popularity and demand for SOL. However, in 2025, this hype may fade, as the meme token market is prone to sharp rises and falls. This could reduce network activity and, consequently, the price of SOL. In other words, "the music is slowly fading."
Technical Analysis
On the provided SOL/USDC chart (5-day timeframe), several key points support the idea of a correction to the $75–$85 range:
➖ Volume Profile
On the right side of the chart, the volume profile shows a significant trading volume (a thick zone) in the $75–$85 range. This indicates strong support, making it a likely area for the price to return to due to high liquidity.
➖ Trend Structure
The chart shows signs of a slowing uptrend: shorter upward impulses and increasing volatility (short candles with long wicks). This could signal a reversal or the start of a correction.
➖ Correction Target: $75–$85 Zone ("Coinbase Orders")
The $75–$85 range, marked as "Coinbase orders," is a support zone with limit buy orders. For example, on Coinbase alone, there are orders for 44,419 SOL worth $3,553,520. Similar orders may exist on other exchanges like Binance, Kraken, OKX, and others, creating a strong demand zone.
➖ Hyperliquid Liquidation Map
According to the Hyperliquid Liquidation Map, the $75–$85 range contains liquidation levels for long traders. A drop to this level could trigger a cascade of liquidations, intensifying the downward move but also attracting buyers looking for an entry point.
What Event Could Trigger a Correction?
An expected correction in Bitcoin to the $70,000–$76,000 range could act as a trigger for Solana and other cryptocurrencies to fall, as the altcoin market often follows BTC.
===
I believe this will be the last corrective bounce for cryptocurrencies, synchronized with a bounce in the S&P 500. After that, I expect all markets to enter a deep decline.
🤔🤔🤔

Solana — a correction to around $180-$200.A correction to around $180-$200, marking the start of the bearish phase.

For Solana, the $74-$110 range.For Solana, the $74-$110 range seems like a solid Spot entry point, with long-term targets of $800-$1000.
Why $74-$110? Because Coinbase has large limit buy orders set at $74 and $85 for Solana.
Waiting for the stock market and crypto market to drop.
The right moment to enter Spot is coming soon.

SolusdcSOL/USDC has successfully broken out of its downward trend and is now showing strong bullish momentum. With this breakout, we anticipate further upward movement, making it an ideal opportunity for buyers.
🔹 Entry: 195
🔹 Target 1: 205
🔹 Target 2: 217
🔹 Stop Loss: 187
A sustained move above the entry level could signal further gains, while the stop loss is strategically placed to manage risk. Trade with proper risk management and follow market movements closely

SOLUSDC - SOLANA BREAKOUT ALERT🚀🚀 SOLANA BREAKOUT ALERT! 🚀🚀
Solana (SOL) is at a breakout point! If it clears $207.43 with volume, we could see a massive rally toward $222+ and beyond!
🔹 Key Levels to Watch:
✅ Breakout Zone: $207.43 (If broken, SOL goes parabolic)
✅ Next Resistance: $222.16 (0.618 Fib – Golden Ratio)
✅ Major Target: $234.34 – $261.58
💎 Bullish Signs:
🔥 Volume increasing – Big buyers stepping in
🔥 Higher lows forming – Bullish momentum
🔥 Retesting key Fib levels – Confirmation time
📈 If SOL Holds Above $207.43 → Next Stop: $222, $234, and $260+!
⚠️ If Rejected → Pullback to $193 - $182 Possible.
💰 Ready for takeoff! Buckle up! 🚀🔥


SOL: Symmetrical Triangle—Is an Explosive Move Next?1. Key Patterns, Indicators & Elements Visible
Chart Patterns: There is a clear symmetrical‐triangle formation near the recent highs, outlined by a descending trendline (green dashed) from roughly $295 down and an ascending trendline (white dashed) from the mid‐$190s region upward.
Fibonacci Levels: Notably displayed are the 0.5 (≈$232), 0.618 (≈$217), 0.786 (≈$196), and 1.0 (≈$169) retracements, plus a 0.236 Fib (≈$265–$267) acting as overhead resistance.
ADX (+DI / −DI): The ADX is around 27, indicating a moderate trend strength; +DI is slightly above −DI, hinting at a mild bullish bias but not strongly decisive.
RSI: Hovering near 50, which suggests neutral momentum with neither strong overbought nor oversold conditions.
2. Current State of the Chart
Price is coiling within a symmetrical triangle just below a horizontal resistance band around $265–$267. The market’s short‐term trend strength (ADX ~27) is moderate, and the RSI near 50 confirms a state of consolidation. Volume has tapered off somewhat compared to the prior strong rally, consistent with a tightening price range.
3. Probabilities for Upward vs. Downward Movement
Upward Breakout Probability: ~60%
Downward Breakout Probability: ~40%
These percentages reflect the ongoing bullish bias (+DI > −DI) and the fact that symmetrical triangles often continue the preceding trend (which, judging purely from this chart, was upward). However, the neutrality of the RSI and only modest ADX strength temper the bullish edge.
4. Suggested Potential Entry Points
Long Entries
Above $265–$267 Breakout: A confirmed close above the triangle’s upper boundary (around the 0.236 Fib) would likely indicate bullish continuation. Look for increased volume on the breakout to validate momentum.
Pullback to ~$232: If price dips to the 0.5 Fib level and holds (i.e., forms a clear bounce), that would offer a lower‐risk entry aligned with the broader uptrend line.
Short Entries
Failure at $265–$267: If price fails to break (or quickly rejects) that overhead resistance, a short position targeting lower Fib supports could be warranted.
Break Beneath Ascending Support: A decisive move below the triangle’s rising trendline—particularly under the $248–$250 zone with strong volume—would suggest the uptrend is faltering, offering a short setup with a stop above the broken support.


Solana still going sidewaysI will be looking for a buy of OKX:SOLUSDC at the bottom of the range. The bias of the price action is long. Depending on how we reach the top of the range I may hold the position for longer.

SOL is set to rallySOL price action looks bullish right now. It's a good time to add SOL to your portfolio the return on your investment is big. In the longer perspective SOL is set to hit $500 in the near future.

Winner winner Sol to pay for my Dinner!Hi All,
Sol has finally broken free from it's shackles in the $130, breaking out into the late $140's before coming back to retest.
As you can see there's a hidden divergence with the confluence of an inverse H&S.
I expect the next area of resistance to be in the $160's.
If you zoom out into the weekly you can see Sol's just broken out from a multi-month inverse H&S. If it plays out Sol' price action should move to the mid $200's without too much trouble.
Cheers
BB

SOLANA Solana is a blockchain platform which uses a proof-of-stake mechanism to provide smart contract functionality. Its native cryptocurrency is SOL. Solana was launched in 2020 by Solana Labs, which was founded by Anatoly Yakovenko and Raj Gokal in 2018.

Solana can go to 32- 36 usd.After FOMC meeting, crypto bull market is confirmed.
CPI data will release in Feb 14, forecasting 6 - 6.25%.
And the main game changer of solana is its mobile phone SAGA, will come in first quarter of 2023.
This can be mass adoption for solana.
So we are expect to see solana can easily can go to 32- 36 usd level at least or it can go higher 50 usd level.
Best entry level are
First 24.5 usd
Second 24 usd
Second 23.5 usd
Stop loss 22.5 usd
For my personal view, I do not sell my sol before reaching ATH.

$SOL Solana Bearish GartleySOL testing the inflection zone here again. Looks like its shaping up a nice ABC move up with consecutive higher lows. 42 and 47 would be the first targets here i would think if we break this level, and 53 being an extension of the first wave up from the lows.
Rising volume, OBV is bullish, ADX is bullish, and volatility is expanding on this time frame. The RSI is also approaching the bull zone and shows momentum as well.
Worth keeping an eye on.
