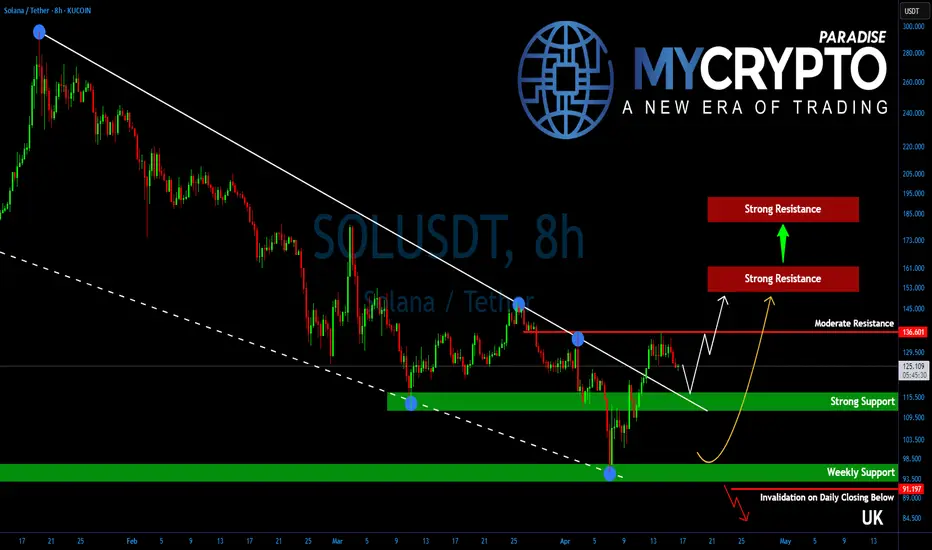
SOLANA → Pre-breakout consolidation relative to 136.00BINANCE:SOLUSDT relative to the range support forms a false breakdown. The market reacts quite positively and the price recovers, forming a consolidation in front of strong resistance
Bitcoin is also in consolidation, as well as SOL, in general the movements coincide, but lately bitcoin is lea

SOL – Small pullback to then grab the liquidity?This 1H chart of SOLUSDT on Bybit showcases a clean bullish continuation setup after a strong impulsive move upward. The current price action suggests a strategic retracement into a high-probability zone of interest before a potential continuation toward buy-side liquidity.
---
1. Market Structur

Trading opportunity for SOLUSDTBased on technical factors there is a Sell position in :
📊 SOLUSDT
🔴 Sell Now
🪫Stop loss 151.00
🔋Target 97.00
📏 R/R 2
💸RISK : 1%
We hope it is profitable for you ❤️
Please support our activity with your likes👍 and comments📝

SOL Bulls Strike Back — But Is It Sustainable?Solana continues to respect technicals with precision — after a +42.9% move from the $95 low, we're now at a pivotal moment in price structure. Let’s break down what’s happening and where the high-probability setups lie.
📍 Key Bounce Zone – Golden Pocket Confluence
Local Low: $95.26
Golden Po

Solana Is One Breakout Away From a Bullish Explosion!Yello, Paradisers! Did you notice how #SOLUSD has been quietly positioning itself while the rest of the market remains uncertain? If you're not paying attention right now, you could be missing one of the cleanest setups on the charts.
💎After several weeks of downside grind and tight consolidation,
SHORT SOLUSDT SOONI believe we may be setting up for a potential short opportunity between the 138 and 150 levels. This appears to be an expanded flat, which is one of the most common corrective patterns seen in wave 4.
Wave B has already successfully bounced off the 1.38 Fibonacci level, which adds further confiden

Elliott Wave Update – Structure OverviewBINANCE:SOLUSDT
We may have found a potential local bottom at yellow Wave A, and are now tracking a move towards yellow Wave B.
This yellow Wave B appears to be unfolding as a 1-2-3-4-5 structure:
Waves 1-2-3 are likely completed.
Waves 4 and 5 could still be ahead.
This full impul

SOLANA I Monthly CLS I KL - OB I Model 1 , Target 50% than CLSHey, Market Warriors, here is another outlook on this instrument
If you’ve been following me, you already know every setup you see is built around a CLS range, a Key Level, Liquidity and a specific execution model.
If you haven't followed me yet, start now.
My trading system is completely mech

SOL - Some new TA- IO and CVD increased regarding last highs (15.04.) but price has not broken Local Daily line. This means Big Money is shorting the Local Daily and absorbing Longs.
- Price is going up while Volume (OBV and AD) is decreasing in almost every time frame. Again. Big money is selling heavily to the Lon

See all ideas
Summarizing what the indicators are suggesting.
Oscillators
Neutral
SellBuy
Strong sellStrong buy
Strong sellSellNeutralBuyStrong buy
Oscillators
Neutral
SellBuy
Strong sellStrong buy
Strong sellSellNeutralBuyStrong buy
Summary
Neutral
SellBuy
Strong sellStrong buy
Strong sellSellNeutralBuyStrong buy
Summary
Neutral
SellBuy
Strong sellStrong buy
Strong sellSellNeutralBuyStrong buy
Summary
Neutral
SellBuy
Strong sellStrong buy
Strong sellSellNeutralBuyStrong buy
Moving Averages
Neutral
SellBuy
Strong sellStrong buy
Strong sellSellNeutralBuyStrong buy
Moving Averages
Neutral
SellBuy
Strong sellStrong buy
Strong sellSellNeutralBuyStrong buy
Displays a symbol's price movements over previous years to identify recurring trends.
Related pairs
Frequently Asked Questions
The current price of SOL3xShort/Tether (SOL) is 0.006528 USDT — it has fallen −10.22% in the past 24 hours. Try placing this info into the context by checking out what coins are also gaining and losing at the moment and seeing SOL price chart.
SOL3xShort/Tether price has fallen by −34.80% over the last week, its month performance shows a −31.85% decrease, and as for the last year, SOL3xShort/Tether has decreased by −94.01%. See more dynamics on SOL price chart.
Keep track of coins' changes with our Crypto Coins Heatmap.
Keep track of coins' changes with our Crypto Coins Heatmap.
SOL3xShort/Tether (SOL) reached its highest price on Sep 11, 2023 — it amounted to 1.800000 USDT. Find more insights on the SOL price chart.
See the list of crypto gainers and choose what best fits your strategy.
See the list of crypto gainers and choose what best fits your strategy.
SOL3xShort/Tether (SOL) reached the lowest price of 0.000031 USDT on Apr 3, 2021. View more SOL3xShort/Tether dynamics on the price chart.
See the list of crypto losers to find unexpected opportunities.
See the list of crypto losers to find unexpected opportunities.
The safest choice when buying SOL is to go to a well-known crypto exchange. Some of the popular names are Binance, Coinbase, Kraken. But you'll have to find a reliable broker and create an account first. You can trade SOL right from TradingView charts — just choose a broker and connect to your account.
Crypto markets are famous for their volatility, so one should study all the available stats before adding crypto assets to their portfolio. Very often it's technical analysis that comes in handy. We prepared technical ratings for SOL3xShort/Tether (SOL): today its technical analysis shows the sell signal, and according to the 1 week rating SOL shows the strong sell signal. And you'd better dig deeper and study 1 month rating too — it's sell. Find inspiration in SOL3xShort/Tether trading ideas and keep track of what's moving crypto markets with our crypto news feed.
SOL3xShort/Tether (SOL) is just as reliable as any other crypto asset — this corner of the world market is highly volatile. Today, for instance, SOL3xShort/Tether is estimated as 15.23% volatile. The only thing it means is that you must prepare and examine all available information before making a decision. And if you're not sure about SOL3xShort/Tether, you can find more inspiration in our curated watchlists.
You can discuss SOL3xShort/Tether (SOL) with other users in our public chats, Minds or in the comments to Ideas.